



Collector Sources
Unlike other Cribl Stream Sources, Collectors are designed to ingest data intermittently, rather than continuously. You can use Collectors to dispatch on-demand (ad hoc) collection tasks, which fetch or “replay” (re-ingest) data from local or remote locations.
Collectors also support scheduled periodic collection jobs - recurring tasks that can make batch collection of stored data more like continual processing of streaming data. You configure Collectors prior to, and independently from, your configuration of ad hoc versus scheduled collection runs.
For distributed deployments, High-availability Collectors can keep scheduled Collector jobs running when the Leader is temporarily unavailable, without NFS-based Leader High Availability/Failover. Workers in an eligible Worker Group elect a temporary Worker Captain to orchestrate those jobs until the Leader is reachable again. High-availability Collectors complements standby Leaders but does not restore the full control plane (for example the Leader UI, commit and deploy, or licensing distribution) during the outage.
Collectors are integral to Cribl Stream’s larger story about optimizing your data throughput. Send full-fidelity log and metrics data (“everything”) to low-cost storage, and then use Cribl Stream Collectors to selectively route (“replay”) only needed data to your systems of analysis.
Collector Resources
- Video introduction to Data Collection, in < 2 minutes.
- Video introduction to Data Collection Scheduling, in < 2 minutes.
- Free, interactive try-out of Collectors in Cribl’s Data Collection & Replay sandbox.
- Example Collector configurations - ready to import into Cribl Stream - in Cribl’s Collector Templates repository.
- Using Collectors guides: S3 Storage and Replay | REST API Collectors | Microsoft Graph API Collection | ServiceNow API Collection | Creating a Custom Collector.
- High-availability Collectors provides resiliency for Collector jobs when the Leader is unreachable.
Collector Types
Cribl Stream currently provides the following Collector options:
- Azure Blob - enables data collection and replay from Azure Blob Storage objects.
- Cribl Lake - enabled data collection and reply from Cribl Lake Datasets.
- Database - enables data collection from database management systems like MySQL and SQL Server.
- File System/NFS - enables data collection and replay from local or remote filesystem locations.
- Google Cloud Storage - enables data collection and replay from Google Cloud Storage buckets.
- Health Check - monitors the availability of system endpoints.
- REST/API Endpoint - enables data collection and replay via REST API calls. Provides four Discover options, to support progressively more complex (and dynamic) item enumerations.
- S3 - enables data collection and replay from Amazon S3 buckets or S3-compatible stores.
- Script - enables data collection and replay via custom scripts.
- Splunk Search - enables data collection and replay from Splunk queries. Supports both simple and complex queries, as well as real-time searches.
If you are exploring Collectors for the first time, the File System/NFS Collector is the simplest to configure, while the REST/API Collector offers the most complex configuration options.
How Do Collectors Work
You can configure a Cribl Stream Node to retrieve data from a remote system by selecting Manage from the top nav, then a Worker Group to configure. Next, click Data > Sources > Collectors. Data collection is a multi-step process:
First, define a Collector instance. In this step, you configure collector-specific settings by selecting a Collector type and pointing it at a specific target. For example, the target will be a directory if the type is File System, or an S3 bucket/path if the type is Amazon S3.
Next, schedule or manually run the Collector. In this step, you configure either scheduled-job-specific or run-specific settings - such as the run Mode (Preview, Discovery, or Full Run), the Filter expression to match the data against, the time range, and so on.
In a Distributed environment, the Leader Node orchestrates collection jobs. The Leader maintains the job definitions and breaks them down into individual tasks. It then distributes these tasks to registered Worker Nodes for execution. Workers do not pull job definitions, they execute the tasks assigned to them by the Leader.
A collection job is typically made up of one or more tasks that: discover the data to be fetched; fetch data that match the run filter; and finally, pass the results either through the Routes or (optionally) into a specific Pipeline and Destination.
Collector Changes
A key difference in how Collectors work relates to when configuration changes are applied. Unlike many other configurations, certain Collector modifications do not require a Commit & Deploy to take effect.
Leader-Scheduled Collectors
For the following Collector types, the job definition is managed entirely on the Leader Node:
- REST/API Endpoint
- Database
- Health Check
Any changes made to the configuration of these Collectors - such as updating a URL, adding a field, or changing a query - are applied on the next scheduled run automatically. No Commit & Deploy is needed for the Collector’s own configuration. This is because the Leader always uses its current, saved configuration to generate tasks for Workers at execution time.
For all other Collector types not listed above, changes require a Commit & Deploy to be propagated to the Worker Nodes.
Dependencies Require Commit & Deploy
While the job definition for a Leader-scheduled Collector doesn’t need to be deployed, any dependencies it relies on do. If your Collector job references Knowledge objects like Event Breakers, Pipelines, or Lookups, those objects must be deployed to the Workers.
If you update a dependent object but fail to deploy it, the collection job will fail with an error, such as “missing event breaker.”
Advanced Collector Configuration
You can edit the configuration of an existing Collector. Or, you can create a new Collector from a template. A template is just a Collector configuration file (in JSON, as usual) intended to copied and edited.
Editing an Existing Collector
When configuring the Collector, click Manage as JSON on the Configure tab.
Cribl Stream will open a JSON editor.
Edit the Collector as desired.
(Optional) If you want to make the Collector configuration available locally, click Export.
When JSON configuration contains sensitive information, it is redacted during export.
Click OK to exit the Manage as JSON modal.
Finish configuring the Collector and click Save.
Create a New Collector from a Template
You can create a new Collector from a template like those in Cribl’s Collector Templates repository.
For many popular Collectors, the Collector Templates repository provides configurations (with companion Event Breakers, and event samples in some cases) that you can import into your Cribl Stream instance, saving the time you’d have spent building them yourself. For many Collectors, you will need to import both the Collector itself (a
collector.jsonfile) and its Event Breaker (abreaker.jsonfile). See the Event Breakers topic for instructions on how to import them.
Collector configurations can contain placeholders defined in the form <Label|Description>, where Label is the input field label and Description is the tooltip text. The Cribl Stream JSON editor makes it easy to work with placeholders, as you’ll see in the following procedure and placeholders example.
Click Manage as JSON at the bottom of the New Collector modal.
Cribl Stream will open a JSON editor.
Import the Collector configuration (that is, the template) using either of the two following methods:
Import method: If your desired Collector configuration file is available locally, click Import, navigate to the file, select it, and click Open.
Copy and paste method: If your desired Collector configuration file is open in a local text editor, or is in a Git repository, copy the file. (In the Cribl’s Collector Templates repo, navigate to the
collector.jsonfile in the desired Collector’s folder, then click the copy icon.) Back in the JSON text editor, paste the Collector configuration.
If the template contains placeholders:
- If you used the import method, Cribl Stream will open the Replace Placeholder Values modal.
- If you used the copy and paste method, click OK to open the modal.
Enter desired values for any fields defined as placeholders.
(Optional) Edit the configuration further as desired.
(Optional) If you want to make the Collector configuration available locally, click Export.
When JSON configuration contains sensitive information, it is redacted during export.
Click OK to exit the Manage as JSON modal.
Finish configuring the Collector and click Save.
Placeholders Example
Here’s an example where the configuration defines placeholders for fields named Client ID and Client Credentials:
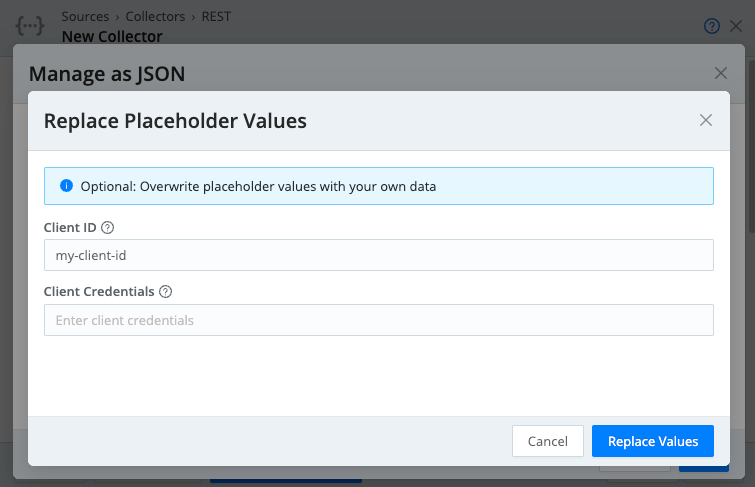
Filling in fields is optional; if you leave a field empty, its placeholder will remain in the JSON configuration, and you can enter a value later.
Scheduled Collection Jobs
You might process data from inherently non-streaming sources, such as REST endpoints, blob stores, and so on. Scheduled jobs enable you to emulate a data stream by scraping data from these sources in batches, on a set interval.
You can schedule a specific job to pick up new data from the source - data that hadn’t been picked up in previous invocations of this scheduled job. This essentially transforms a non-streaming data source into a streaming data source.
Collectors in Distributed Deployments
In a Distributed deployment, you configure Collectors at the Worker Group level, and Worker Nodes execute the tasks. However, the Leader Node oversees the task distribution, and tries to maintain a fair balance across jobs.
When Workers ask for tasks, the Leader will normally try to assign the next task from a job that has the least tasks in progress. This is known as “Least-In-Flight Scheduling,” and it provides the fairest task distribution for most cases. If desired, you can change this default behavior by opening Group Settings > General Settings > Limits > Jobs, and then setting Job dispatching to Round Robin.
More generally: In a Distributed deployment, you configure Collectors and their jobs on individual Worker Groups. But because the Leader manages Collectors’ state, if the Leader instance fails, Collection jobs will fail as well. (This is unlike other Sources, where Worker Groups can continue autonomously receiving incoming data if the Leader goes down.)
Monitor and Inspect Collection Jobs
Select Monitoring > System > Job Inspector to view and manage pending, in-flight, and completed collection jobs and their tasks.
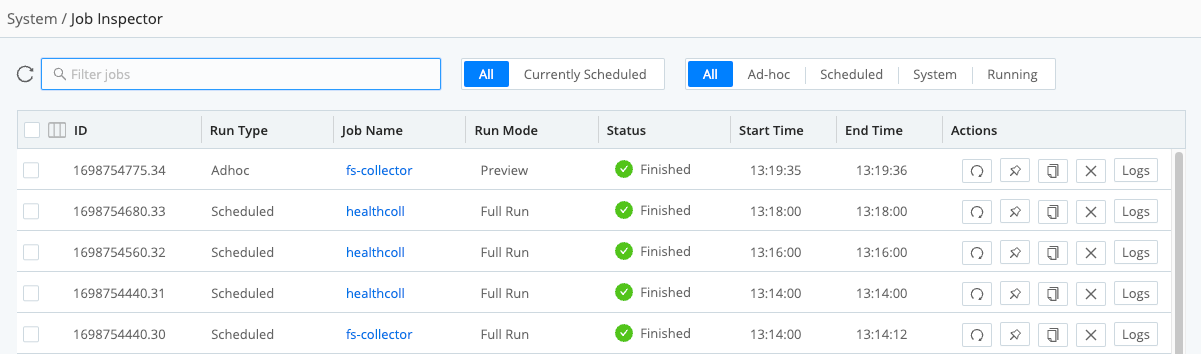
Here are the options available on the Job Inspector page:
All vs. Currently Scheduled tabs: Click Currently Scheduled to see jobs forward-scheduled for future execution - including their cron schedule details, last execution, and next scheduled execution. Click All to see all jobs initiated in the past, regardless of completion status.
Job categories (buttons): Select among Ad-hoc, Scheduled, System, and Running. (At this level, Scheduled means scheduled jobs already running or finished.)
Group selectors: Select one or more check boxes to display action buttons at the bottom of the table, like Pause and Resume.
Sortable headers: Click any column to reverse its sort direction.
Search bar: Click to filter displayed jobs by arbitrary strings.
Action buttons: For finished jobs, the icons (from left to right) indicate: Rerun; Keep job artifacts; Copy job artifacts; Delete job artifacts; and Display job logs in a modal, where you can view and export the logs. For running jobs, the options (again from left to right) are: Pause; Stop; Copy job artifacts; Delete job artifacts; and Live (show collection status in a modal).
Monitor Job Artifacts
Collection jobs create artifacts that include internal accounting data about the job execution process and log files. Because the artifacts have limited value after the job is completed, the system automatically deletes them when they exceed configured limits. This process is called “artifact reaping”.
To monitor collection job artifacts that are being reaped, you can enable debug logging for the JobArtifactReaper logging channel.
The system will then log the reason why the artifacts were reaped. To do this, set logging level for JobArtifactReaper to debug.
Job Artifact Retention
Cribl Stream keeps a job’s artifacts for the job’s Time to live period after the job finishes. The default is 4h. You can change the period on the job. The period also controls how long the job remains listed in Job Inspector.
When the period expires, Cribl Stream can remove the job directory and all of its logs. A keep marker in the job directory prevents that cleanup. Ignore Worker Group job limits excludes the job’s artifacts from the Worker Group finished-artifact limit. Those artifacts are then removed only after the configured time to live.
Copy artifacts that you need for a longer investigation before the time-to-live period expires.
Collector Job Logs
A Collector job writes its own logs while it discovers data and runs collection tasks. Collector job logs are useful when a specific collection run fails, returns no data, or stops before its tasks finish.
For the application logs under $CRIBL_HOME/log/ that record data about system health, API activity, configuration changes, and data handling, see Internal Logs.
Cribl Stream stores each job under $CRIBL_HOME/state/jobs/<group>/<job-id>/. The following table lists and describes the log artifacts:
| File | Contents |
|---|---|
logs/job/job.log | Job-level activity for the collection run, recorded when the job initializes |
tasks/<task-id>/log/task.log | Activity for one discovery or collection task, recorded when the task starts |
logs/task/tasklog.log | A merged, time-ordered copy of the task logs, created when someone requests the job logs and Cribl Stream builds or reuses the merge |
task-errors.ndjson | Structured errors from the job or its tasks, recorded when the job or a task reports an error |
The job directory can also contain files that describe the job state and collected data, such as status.json, args.json, stats.json, and task result files.
Example Events
The following examples show typical events in Collector job logs. Event fields may vary depending on the process or action that generated the event.
logs/job/job.log records this event when the job changes state:
{
  "time": "2026-03-03T19:37:55.764Z",
  "cid": "api",
  "channel": "Job",
  "level": "info",
  "message": "job execution state change",
  "jobId": "1597928313.0",
  "ioType": "collector",
  "ioName": "filesystem",
  "previousState": "pending",
  "currentState": "running"
}| Field | Description |
|---|---|
time | UTC time when the event was written. |
cid | Process that wrote the event. Job logs on the Leader use api. |
channel | Logger channel. Job-level events use Job. |
level | Log level for the event. |
message | job execution state change. |
jobId | ID of the collection run. |
ioType | collector for a Collector job. |
ioName | Collector type, such as filesystem. Custom Collectors use custom. |
previousState | Job state before this change. One of initializing, pending, running, paused, cancelled, finished, failed, orphaned, or unknown. |
currentState | Job state after this change. Same values as previousState. |
tasks/<task-id>/log/task.log records this event when a task starts.
{
  "time": "2020-08-20T12:58:33.913Z",
  "cid": "w0",
  "channel": "task",
  "level": "info",
  "message": "Task starting",
  "jobId": "1597928313.0",
  "taskId": "discover",
  "host": "worker-01",
  "ioType": "collector",
  "ioName": "filesystem",
  "logLevel": "info",
  "executor": {
    "type": "collection",
    "collectStep": "discover"
  },
  "task": {
    "type": "filesystem",
    "conf": {
      "collectorId": "demo",
      "path": "/data/input"
    }
  },
  "pid": 14325
}| Field | Description |
|---|---|
time | UTC time when the event was written. |
cid | Worker Process that wrote the event, such as w0. |
channel | task for task events. |
level | Log level for the event. |
message | Task starting. |
jobId | ID of the collection run that owns the task. |
taskId | Discovery tasks use discover. Collection tasks use an ID such as collect.0. |
host | Hostname of the node that ran the task. |
ioType | collector for a Collector job. |
ioName | Collector type, such as filesystem. Custom Collectors use custom. |
logLevel | Log level configured for the task. |
executor.type | collection for a Collector task. |
executor.collectStep | discover while the job lists collectible items, or collect while a collection task reads them. |
executor.collectibles | Items assigned to a collection task, when the event includes them. |
task.type | Collector type for the task. |
task.conf.collectorId | ID of the configured Collector. |
task.conf.path | For a filesystem Collector, the path to read. Other Collector types include their own task.conf fields. |
pid | Process ID of the process that started the task. |
tasks/<task-id>/log/task.log records this event when a task fails:
{
  "time": "2026-03-03T19:38:12.441Z",
  "cid": "w0",
  "channel": "task",
  "level": "error",
  "message": "task execution failure",
  "jobId": "1597928313.0",
  "taskId": "collect.0",
  "host": "worker-01",
  "ioType": "collector",
  "ioName": "filesystem",
  "reason": "ENOENT: no such file or directory"
}| Field | Description |
|---|---|
time | UTC time when the event was written. |
cid | Worker Process that wrote the event, such as w0. |
channel | task for task events. |
level | Log level for the event. Failures use error. |
message | task execution failure. |
jobId | ID of the collection run that owns the task. |
taskId | Task that failed, such as collect.0. |
host | Hostname of the node that ran the task. |
ioType | collector for a Collector job. |
ioName | Collector type, such as filesystem. Custom Collectors use custom. |
reason | Error message from the failed task. |
Use Collector Job Logs for Troubleshooting
The following table identifies the Collector job logs to investigate for common issues and the action to take in each log.
| Issue | Collector Job Log | Investigation Actions |
|---|---|---|
| The job never starts or exits before tasks run | logs/job/job.log | Confirm the job ID and log level, then read the first error. |
| Discovery returns no items | The discovery task’s task.log | Confirm that executor.collectStep is discover. |
| One task fails but other tasks finish | tasks/<task-id>/log/task.log | Match taskId and check level for the failed task. |
| The job reports errors but the message is difficult to find | task-errors.ndjson | Read one structured error per line. |
| You need a single timeline for every task | logs/task/tasklog.log | Order events by time, then use taskId and executor.collectStep to separate tasks. |
To confirm that a Worker Process handled collection tasks during a specific minute, check tasksStarted and tasksCompleted on its _raw stats event in cribl.log. These counters are not in the Collector job logs. They provide process-level activity for all Collector jobs, but they do not identify an individual job or indicate why a task failed. To investigate a specific run, use the Collector job logs in the preceding table.
For High-availability Collectors, Job Inspector on the Leader might not display logs for a scheduled job that a Worker Captain ran while the Leader was unavailable. The log request can return HTTP status code 422 Unprocessable Content because the job artifacts remain on Worker Nodes. To inspect the artifacts directly, check $CRIBL_HOME/state/jobs/default/<job-id>/ on the Worker Captain for job-level artifacts and on task-executing Workers for task-level artifacts.
Built-in Datasets in Cribl Search and Lake
Built-in Cribl Search and Cribl Lake Datasets do not include the contents of the Collector job log artifacts. However, when Job Inspector cannot show Collector job logs, the following built-in Datasets can help you find out why:
cribl_internal_logs, a federated search Dataset.cribl_logs, a Lake Dataset.
Members must have the Admin Permission on Cribl Search to query cribl_internal_logs. To query cribl_logs, Members need the Read Only Permission on Cribl Lake Datasets in addition to the Admin Permission on Cribl Search.
cribl_internal_logs includes the Leader’s internal logs. To find out why the Leader removed a job’s logs, set the JobArtifactReaper logging channel to debug as described in Monitor Job Artifacts. Then, search cribl_internal_logs as shown in the following example. Each reaping artifact event includes the job ID and the reason why the Leader deleted the job’s artifacts.
dataset="cribl_internal_logs" channel=="JobArtifactReaper"If Job Inspector cannot display a job’s logs, you can use cribl_internal_logs to search the Leader access.log for the failed request as shown in the following example. The url shows the job ID. A 404 status means the Leader no longer has the logs, usually because they were deleted. A 422 status means a Worker Captain ran the job, so the logs are on Worker Nodes.
dataset="cribl_internal_logs" source="*access.log" url="*/system/jobs/logs/*" status>=400cribl_internal_logs includes the current Leader access.log and its five most recent rotated copies. If the rotated files no longer include the failed request, search cribl_logs instead. cribl_logs keeps Cribl.Cloud Leader access.log events for 30 days. Filter on data_source as shown in the following example.
dataset="cribl_logs" data_source="*access.log" url="*/system/jobs/logs/*" status>=400