


These docs are for Cribl Edge 4.0 and are no longer actively maintained.
See the latest version (4.17).
Internal Metrics
When sending Cribl Edge metrics to a metric system of analysis - such as InfluxDB, Splunk, or Elasticsearch - some metrics are particularly valuable. You can use these metrics to set up alerts when a Worker/Edge Node is having a problem, a Node is down, a Destination is down, a Source stops providing incoming data, etc.
Cribl Edge reports its internal metrics within the Cribl Edge UI, in the same way that it reports internal logs at Monitoring > Logs (Cribl Stream) and Health > Logs (Cribl Edge). To expose metrics for capture or routing, enable the Cribl Internal Source > CriblMetrics section.
By default, Cribl Edge generates internal metrics every 2 seconds. To consume metrics at longer intervals, you can use or adapt the cribl-metrics_rollup Pipeline that ships with Cribl Stream. Attach it to your Cribl Internal Source as a pre-processing Pipeline. The Pipeline’s Rollup Metrics Function has a default Time Window of 30 seconds, which you can adjust to a different granularity as needed.
You can also use our public endpoints to automate monitoring using your own external tools.
Counter-type metrics in Cribl Edge do not monotonically increase or decrease. They are reset at the end of each reporting period. Cribl Edge does not report counters when their value is 0. For example, if there aren’t any Destinations reporting dropped events then the total.dropped_events metric won’t be reported because its value would be 0.
Total Throughput Metrics
Five important metrics below are prefixed with total. These power the top of Cribl Edge’s Monitoring dashboard. The first two report on Sources, the remainder on Destinations.
total.in_bytestotal.in_eventstotal.out_eventstotal.out_bytestotal.dropped_events- helpful for discovering situations such as: you’ve disabled a Destination without noticing.
Interpreting Total Metrics
These total. metrics’ values could reflect Cribl Edge’s health, but could also report low activity simply due to the Source system. E.g., logs from a store site will be low at low buying periods.
Also, despite the total. prefix, these metrics are each specific to the Worker/Edge Node Process that’s generating them.
You can distinguish unique metrics by their #input=<id> dimension. For example, total.in_events|#input=foo would be one unique metric, while total.in_events|#input=bar would be another.
System Health Metrics
Five specific metrics are most valuable for monitoring system health. The first two are Cribl Edge composite metrics; the remaining three report on your hardware or VM infrastructure. Because the Cribl Internal Source does not export these metrics to Routes or Pipelines, you can obtain them only by using the REST endpoints documented listed on this page.
health.inputshealth.outputs- see the JSON Examples below for bothhealth.metrics.system.load_avgsystem.free_memsystem.disk_used- valuable if you know your disk size, especially for monitoring Persistent Queues. Here, a0value typically indicates that the disk-usage data provider has not yet provided the metric with data. (Getting the first value should take about one minute.)
All of the above metrics take these three values:
0= green = healthy.1= yellow = warning.2= red = trouble.
Health Inputs/Outputs JSON Examples
The health.inputs metrics are reported per Source, and the health.outputs metrics per Destination. The health.inputs example below has two configured Sources, and two Cribl Stream-internal inputs. The health.outputs example includes the built-in devnull Destination, and six user-configured Destinations.
Given all the 0 values here, everything is in good shape!
  "health.inputs": [
    { "model": { "ci": "http:http",   "input": "http:http" }}, "val": 0},
    { "model": { "ci": "cribl:CriblLogs",   "input": "cribl:CriblLogs" }}, "val": 0},
    { "model": { "ci": "cribl:CriblMetrics",   "input": "cribl:CriblMetrics" }}, "val": 0},
    { "model": { "ci": "datagen:DatagenWeblog",   "input": "datagen:DatagenWeblog" }}, "val": 0 }
    ],
  "health.outputs": [
    { "model": { "output": "devnull:devnull" }}, "val": 0},
    { "model": { "output": "router:MyOut1" }}, "val": 0},
    { "model": { "output": "tcpjson:MyTcpOut1" }}, "val": 0},
    { "model": { "output": "router:MyOut2" }}, "val": 0},
    { "model": { "output": "tcpjson:MyTcpOut2" }}, "val": 0},
    { "model": { "output": "router:MyOut3" }}, "val": 0},
    { "model": { "output": "router:MyOut4" }}, "val": 0 }
],Worker/Edge Node Resource Metrics
The Cribl Internal Source reports two useful metrics on individual Worker/Edge Node Processes’ resource usage:
system.cpu_perc- CPU percentage usage.system.mem_rss- RAM usage in bytes.
Persistent Queue Metrics
These metrics are valuable for monitoring Persistent Queues’ behavior:
pq.queue_size- Total bytes in the queue.pq.in_bytes- Total bytes in the queue for the given Time Window.pq.in_events- Number of events in the queue for the given Time Window.pq.out_bytes- Total bytes flushed from the queue for the given Time Window.pq.out_events- Number of events flushed from the queue for the given Time Window.
These are aggregate metrics, but you can distinguish unique metrics per queue. On the Destination side, use the #output=<id> dimension. For example, pq.out_events|#output=kafka would be one unique metric; pq.out_events|#output=camus would be another.
Other Internal Metrics
The Cribl Internal Source emits other metrics that, when displayed in downstream dashboards, can be useful for understanding Cribl Edge’s behavior and health. These include:
cribl.logstream.total.activeCxn- Total active inbound TCP connections.cribl.logstream.pipe.in_events- Inbound events per Pipeline.cribl.logstream.pipe.out_events- Outbound events per Pipeline.cribl.logstream.pipe.dropped_events- Dropped events per Pipeline.cribl.logstream.metrics_pool.num_metrics- The total number of unique metrics that have been allocated into memory.cribl.logstream.collector_cache.size- Each Collector function (default/cribl/collectors/<collector>/index.js) is loaded/initialized only once per job, and then cached. This metric represents the current size of this cache.cribl.logstream.cluster.metrics.sender.inflight- Number of metric packets currently being sent from a Worker/Edge Node Process to the API Process, via IPC (interprocess communication).cribl.logstream.backpressure.outputs- Destinations experiencing backpressure, causing events to be either blocked or dropped.cribl.logstream.blocked.outputs- Blocked Destinations. (This metric is more restrictive than the one listed just above.)cribl.logstream.pq.queue_size- Current queue size, in bytes, per Worker Process.cribl.logstream.host.in_bytes- Inbound bytes from a given host (host is a characteristic of the data).cribl.logstream.host.in_events- Inbound events from a given host (host is a characteristic of the data).cribl.logstream.host.out_bytes- Outbound bytes from a given host (host is a characteristic of the data).cribl.logstream.host.out_events- Outbound events from a given host (host is a characteristic of the data).cribl.logstream.index.in_bytes- Inbound bytes per index.cribl.logstream.index.in_events- Inbound events per index.cribl.logstream.index.out_bytes- Outbound bytes per index.cribl.logstream.index.out_events- Outbound events per index.cribl.logstream.route.in_bytes- Inbound bytes per Route.cribl.logstream.route.in_events- Inbound events per Route.cribl.logstream.route.out_bytes- Outbound bytes per Route.cribl.logstream.route.out_events- Outbound events per Route.cribl.logstream.source.in_bytes- Inbound bytes per Source.cribl.logstream.source.in_events- Inbound events per Source.cribl.logstream.source.out_bytes- Outbound bytes per Source.cribl.logstream.source.out_events- Outbound events per Source.cribl.logstream.sourcetype.in_bytes- Inbound bytes per sourcetype.cribl.logstream.sourcetype.in_events- Inbound events per sourcetype.cribl.logstream.sourcetype.out_bytes- Outbound bytes per sourcetype.cribl.logstream.sourcetype.out_events- Outbound events per sourcetype.
Dimensions
Cribl Edge internal metrics have extra dimensions, these include:
cribl_wp- Identifies the Worker/Edge Node Process that processed the event.event_host- Machine’s hostname from which the event was made.event_source- Set ascribl.group- Name of Cribl Fleet from which the event was made.input- Entire Input ID, including the prefix, from which the event was made.output- Entire Output ID, including the prefix, from which the event was made.
Controlling Metrics
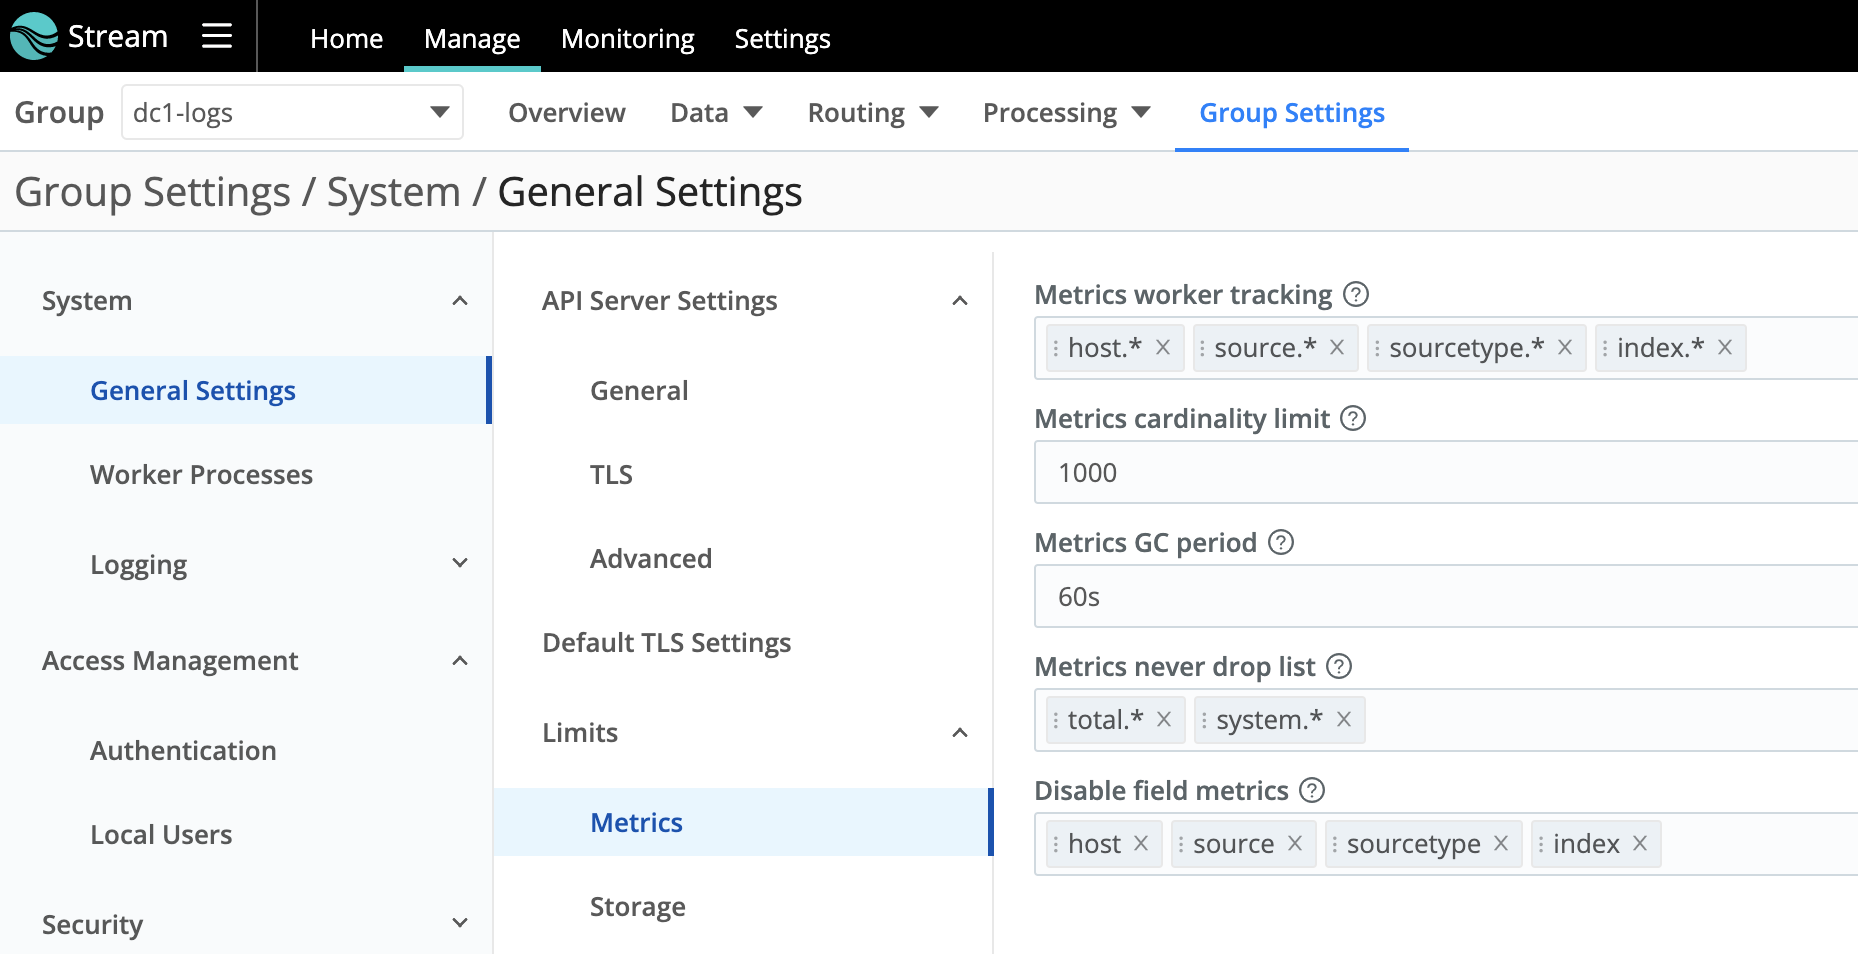
You can control the volume of internal metrics that Cribl Edge emits by adjusting Metrics Limits, which you access as follows:
- Distributed deployments: [Select a Fleet] > Group/Fleet Settings > System > General Settings > Limits > Metrics.
- Single-instance deployments: Settings > Global Settings > System > General Settings > Limits > Metrics.
Here, you can adjust metrics’ cardinality, metrics to always include (Metrics never drop lis), metrics to never include (Disable field metrics), and other options.
Other Metrics Endpoints
Below is basic information on using the /system/metrics endpoint, the /system/info endpoint, and the cribl_wp dimension.
/system/metrics Endpoint
/system/metrics is Cribl Edge’s primary public metrics endpoint, which returns most internal metrics. Note that many of these retrieved metrics report configuration only, not runtime behavior. For details, see our API Docs.
/system/info Endpoint
/system/info generates the JSON displayed in the Cribl Edge UI at Settings > Global Settings > Diagnostics > System Info. Its two most useful properties are loadavg and memory.
loadavg Example
"loadavg": [1.39599609375, 1.22265625, 1.31494140625],
This property is an array containing the 1-, 5-, and 15-minute load averages at the UNIX OS level. (On Windows, the return value is always [0, 0, 0].) For details, see the Node.js os.loadavg() documentation.
memory Example
"memory": { "free": 936206336, "total": 16672968704 },
Divide total / free to monitor memory pressure. If the result exceeds 90%, this indicates a risky situation: you’re running out of memory.
cpus Alternative
The cpus metric returns an array of CPU/memory key-value pairs. This provides an alternative way to understand CPU utilization, but it requires you to query all your CPUs individually.