


These docs are for Cribl Edge 4.0 and are no longer actively maintained.
See the latest version (4.17).
Sources
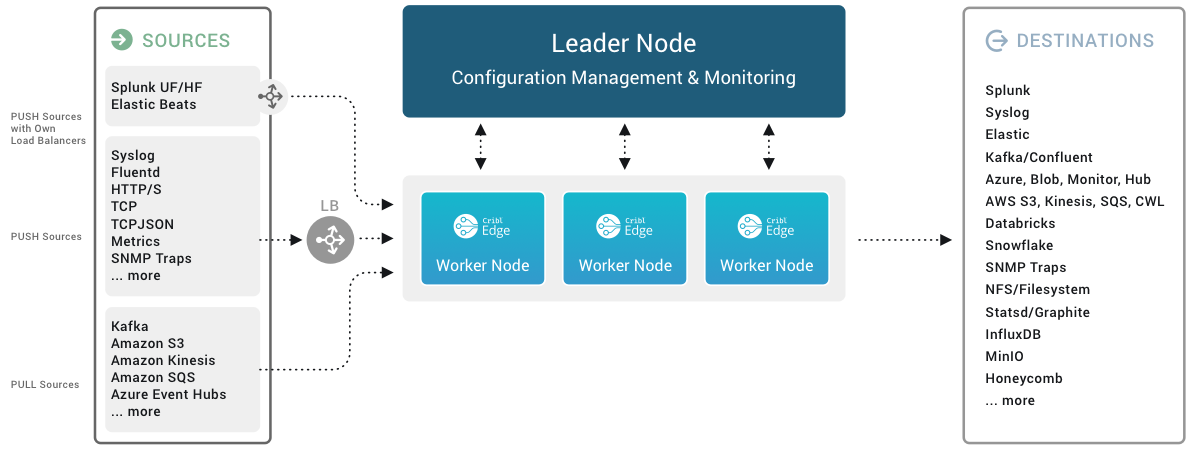
Each Cribl Edge Source is a configuration that enables Edge nodes to collect or receive observability data - logs, metrics, application data, etc. - in real time. Edge can receive continuous data input from Splunk, HTTP senders, Elastic Beats, Prometheus, TCP JSON, and many others.
Edge’s UI offers a configuration modal for each type of supported Source. However, you can add multiple instances of each Source type - with each configured to match the parameters of the corresponding sender. E.g., you can have multiple File Monitors and multiple listeners for Syslog, Splunk, Elastic Beats, Prometheus, TCP JSON, and many others.
System and Internal Sources
Sources that generate data locally at the Edge Node; or monitor resources; or move data among Edge Nodes and/or Stream Workers within your Cribl deployment.
- AppScope
- Cribl Internal
- Cribl HTTP
- Cribl TCP
- Datagen
- Exec
- File Monitor
- Kubernetes Logs
- Kubernetes Metrics
- System Metrics
- System State
- Windows Metrics
- Cribl Stream (Deprecated): Use either Cribl HTTP or Cribl TCP instead.
PUSH Sources
Supported data Sources that send to Cribl Edge.
In the absence of an active Leader, these Sources can generally continue data ingestion. However, some Sources may experience functional limitations during prolonged Leader unavailability. See the respective Source documentation for details.
- Syslog
- TCP JSON
- Splunk TCP
- Splunk HEC
- Amazon Kinesis Firehose
- Prometheus Remote Write
- HTTP/S (Bulk API)
- Raw HTTP/S
- Elasticsearch API
- Metrics
- SNMP Trap
- TCP (Raw)
- Datadog Agent
- OpenTelemetry (OTel)
- Grafana
- Loki
- Windows Event Forwarder
PULL Sources
Supported data Sources that Cribl Edge fetches data from.
These Sources can ingest data only if a Leader is active:
Configuring and Managing Sources
For each Source type, you can create multiple definitions, depending on your requirements.
To configure Sources, from the top nav, click Manage, then select a Fleet to configure. Then, you have two options:
To access the graphical QuickConnect UI, click Collect. Next, click either + Add New or (if displayed) Select Existing.
To access the Routing UI, click More > Sources. On the resulting Data Sources page’s tiles or left menu, select the desired type, then click + Add New.
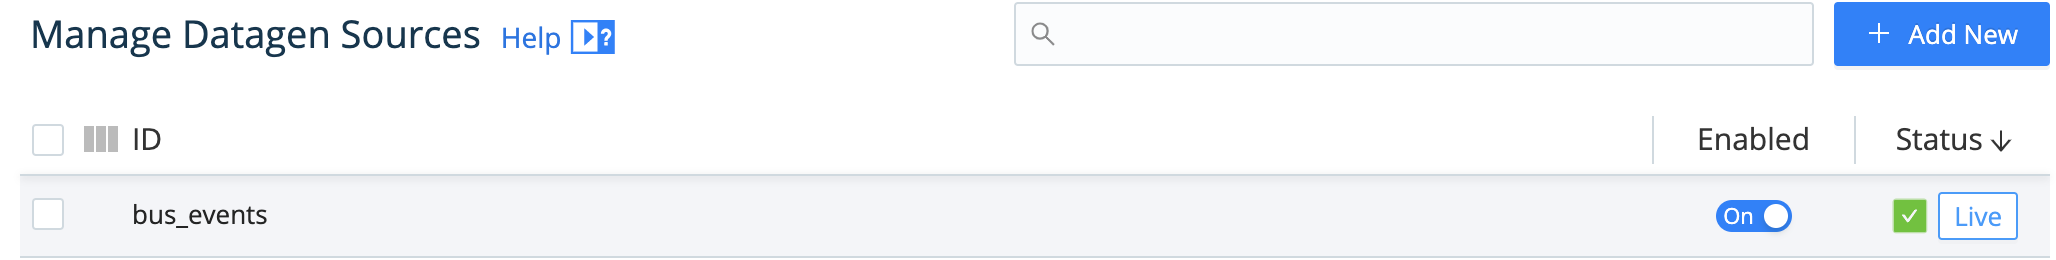
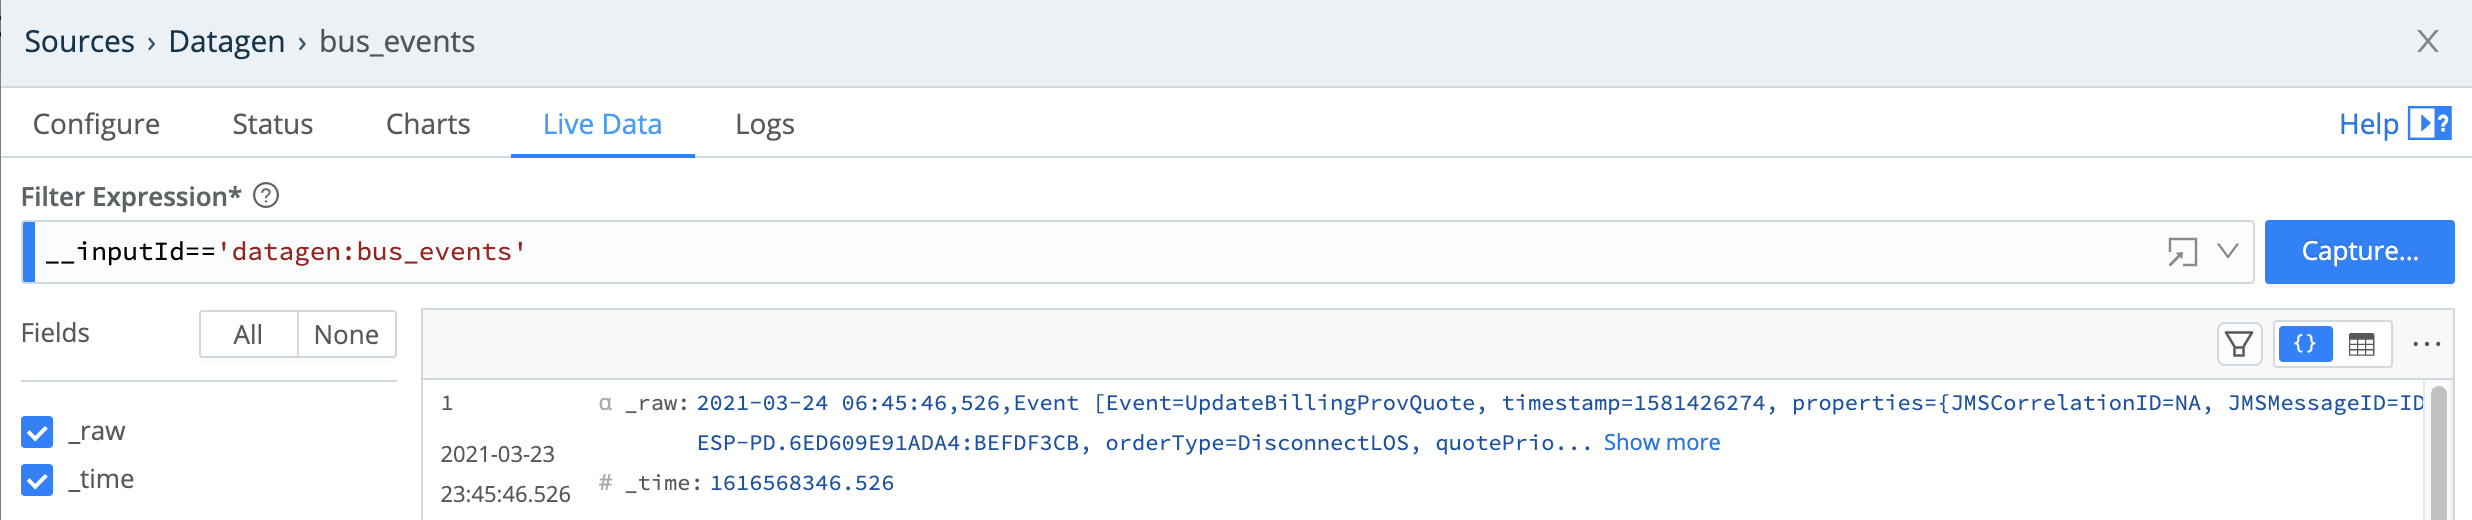
Capturing Source Data
To capture data from a single enabled Source, you can bypass the Preview pane, and instead capture directly from a Manage Sources page. Just click the Live button beside the Source you want to capture.
You can also start an immediate capture from within an enabled Source’s configuration modal, by clicking the modal’s Live Data tab.
Preconfigured Sources
To accelerate your setup, Cribl Edge ships with several common Sources configured but not switched on. Open, clone (if desired), modify, and enable any of these preconfigured Sources to get started quickly:
- System Metrics - Basic Level
- File Monitor > in_file_auto - Auto Discovery Mode
- File Monitor > in_file_varlog - Manual Discovery Mode
- AppScope > in_appscope - Unix Domain Socket listener
- Cribl Internal > CriblLogs - Internal
- Cribl Internal > CriblMetrics - Internal