These docs are for Cribl Edge 4.1 and are no longer actively maintained.
See the latest version (4.17).
Exploring Cribl Edge on Windows
Cribl Edge on Windows offers easy-to-use tools for exploring and collecting Windows events. You can run Cribl Edge on Windows Server 2016, 2019, or 2022, to collect events via the Windows Events API.
Limitations
Cribl Edge on Windows is currently subject to the following limitations. We will update this page as we enable more features.
Modes
Cribl Edge on Windows supports only the following modes:
Edge: SingleEdge: Managed Edge (managed by Leader)
This means you can’t switch Cribl Edge on Windows into Cribl Stream mode (Single-instance, Worker, or Leader).
You can, however, switch between the Cribl Edge supported modes via the UI, in Settings (top nav) > Distributed Settings > Mode.
Do not select an unsupported mode from this drop-down! Doing so will cause the Cribl service to fail.
Sources and Destinations
Cribl Edge on Windows supports the same Sources and Destinations as Cribl Edge on Linux, with the following exceptions:
- The AppScope and System Metrics Sources are unavailable on Windows.
- The Kubernetes Logs and Kubernetes Metrics Sources. Cribl Edge on Windows does not support Kubernetes deployments.
- The Kafka Destination does not support Kerberos authentication on Windows.
Sources on Windows Only
The following Sources are available only when running Cribl Edge on Windows (not on Linux):
Functions
The Grok Function is unavailable on Windows. If you include it in a Pipeline, Cribl Edge processing will skip over it.
Data Formats
Cribl Edge on Windows does not support reading or writing Parquet files. This is a limitation on the following Destinations: Amazon S3, Azure Blob Storage, MinIO, and FileSystem/NFS.
Accessing Cribl Edge on Windows
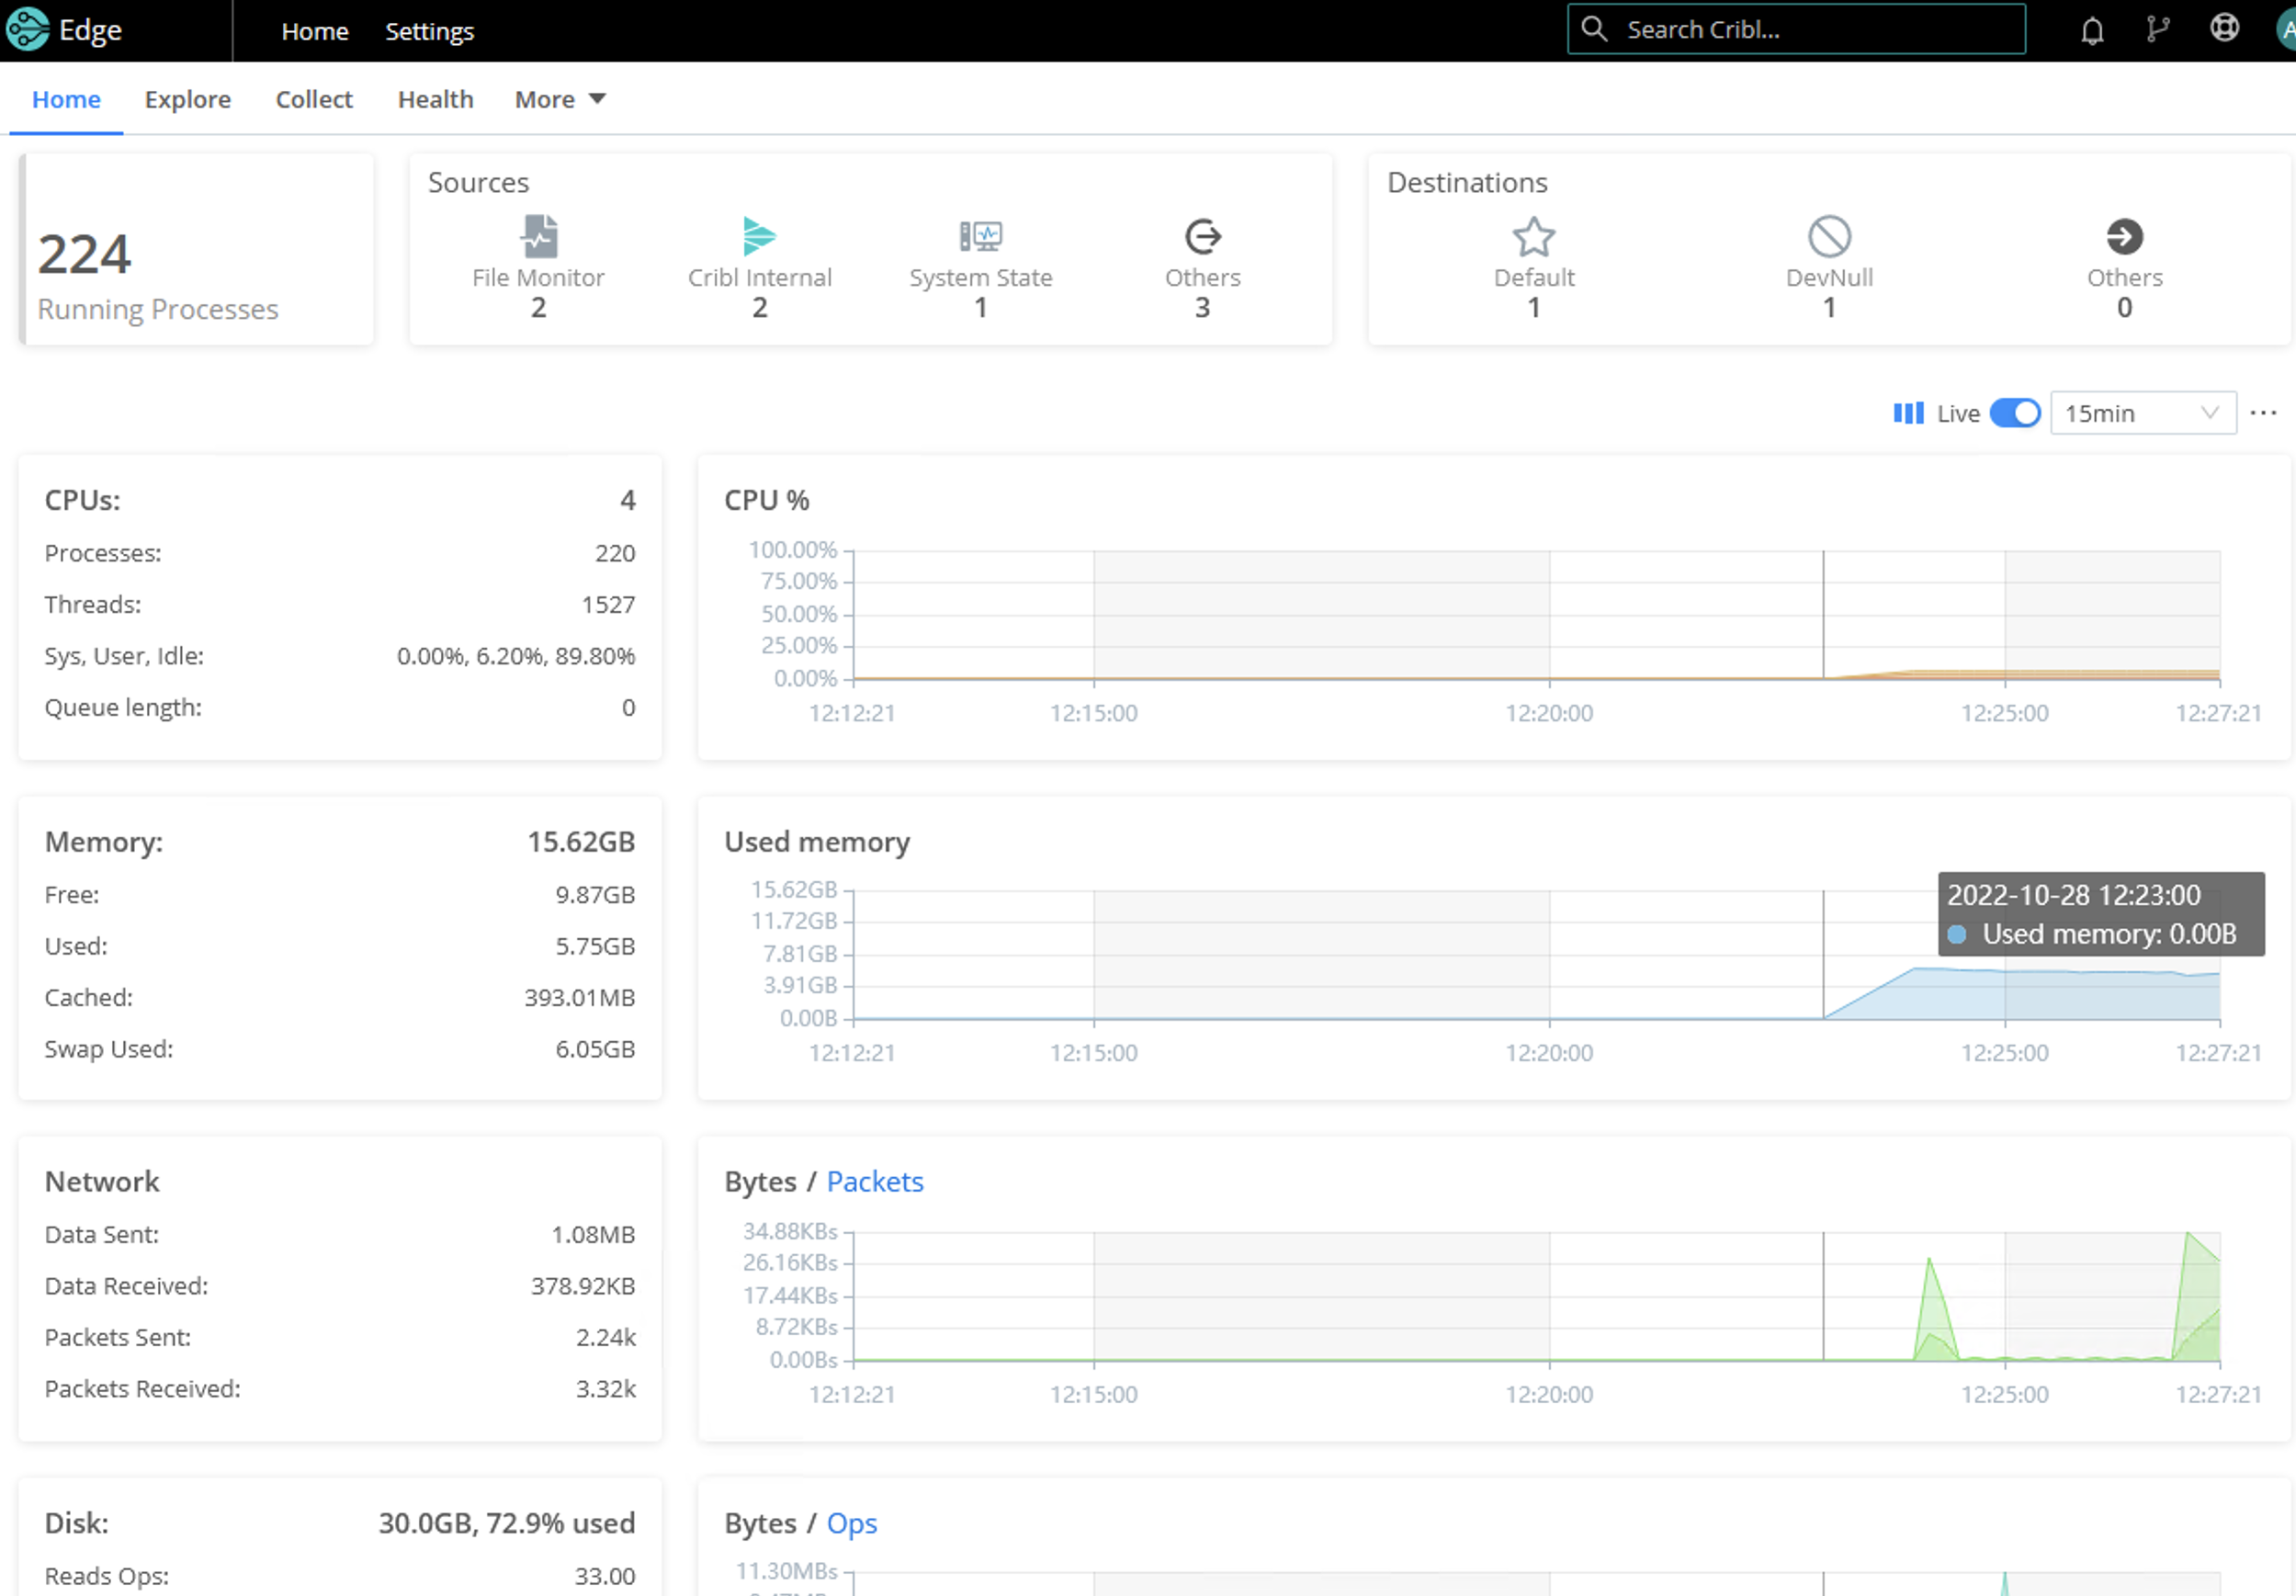
When you first log into Cribl Edge on Windows (single-instance or managed node), you’ll land on the Home tab where you can explore the metrics and log data that the Node has auto-discovered, and can manually discover and explore other data of interest.
From the Explore page, you can view more details on your node via the following tabs:
Processes
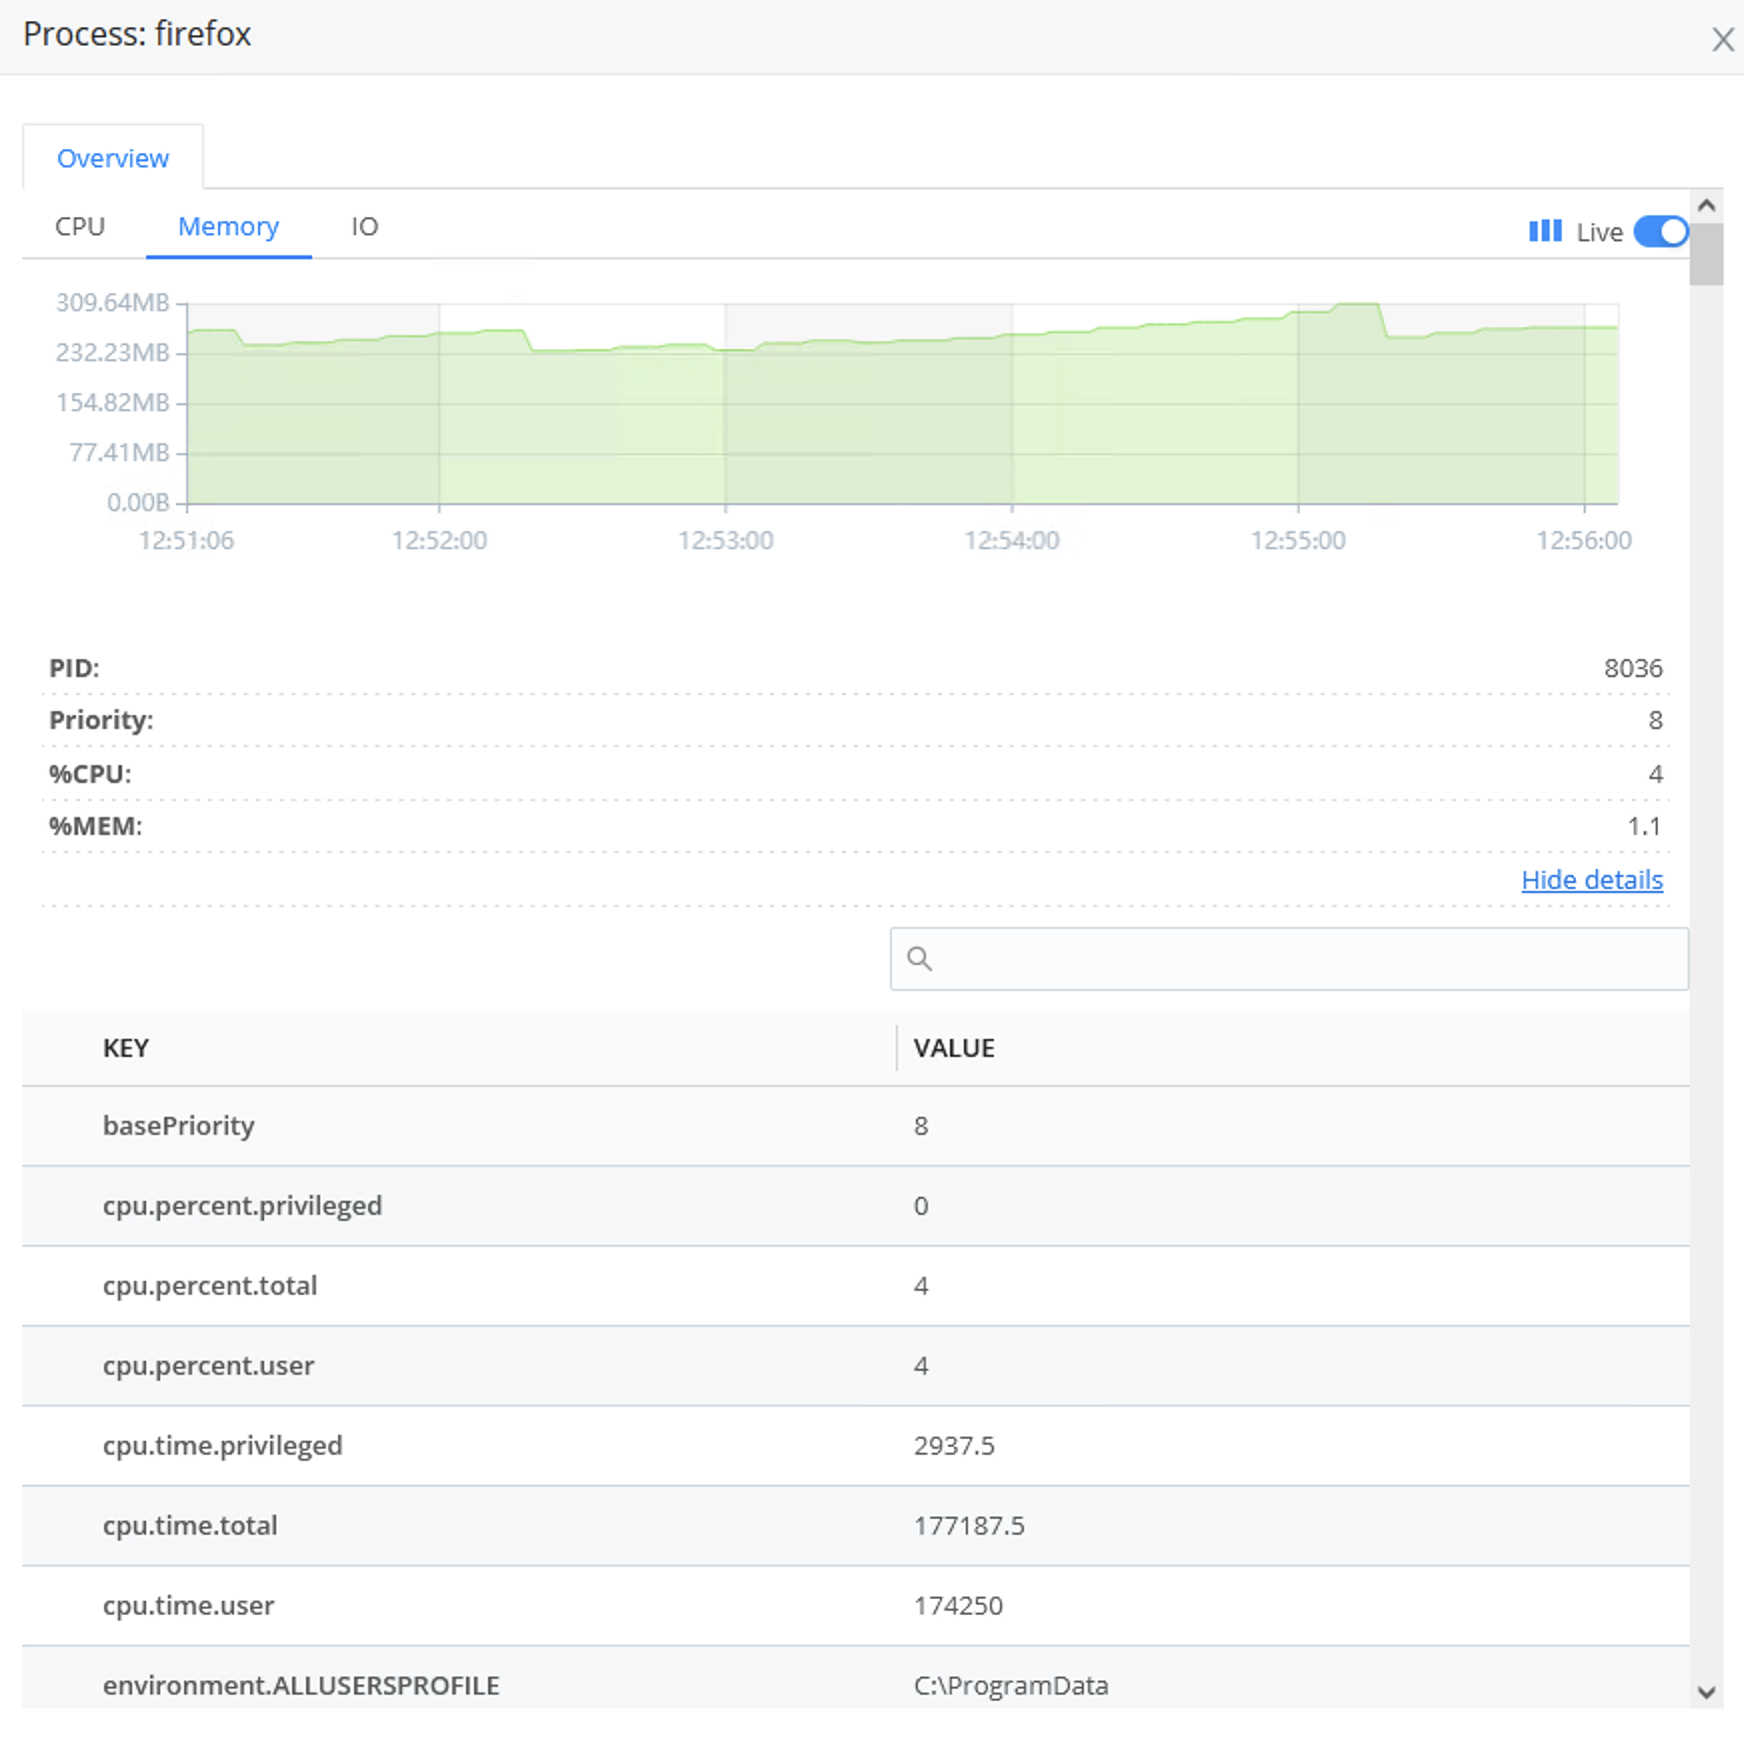
The Processes tab lists all the processes running on the Edge Node.
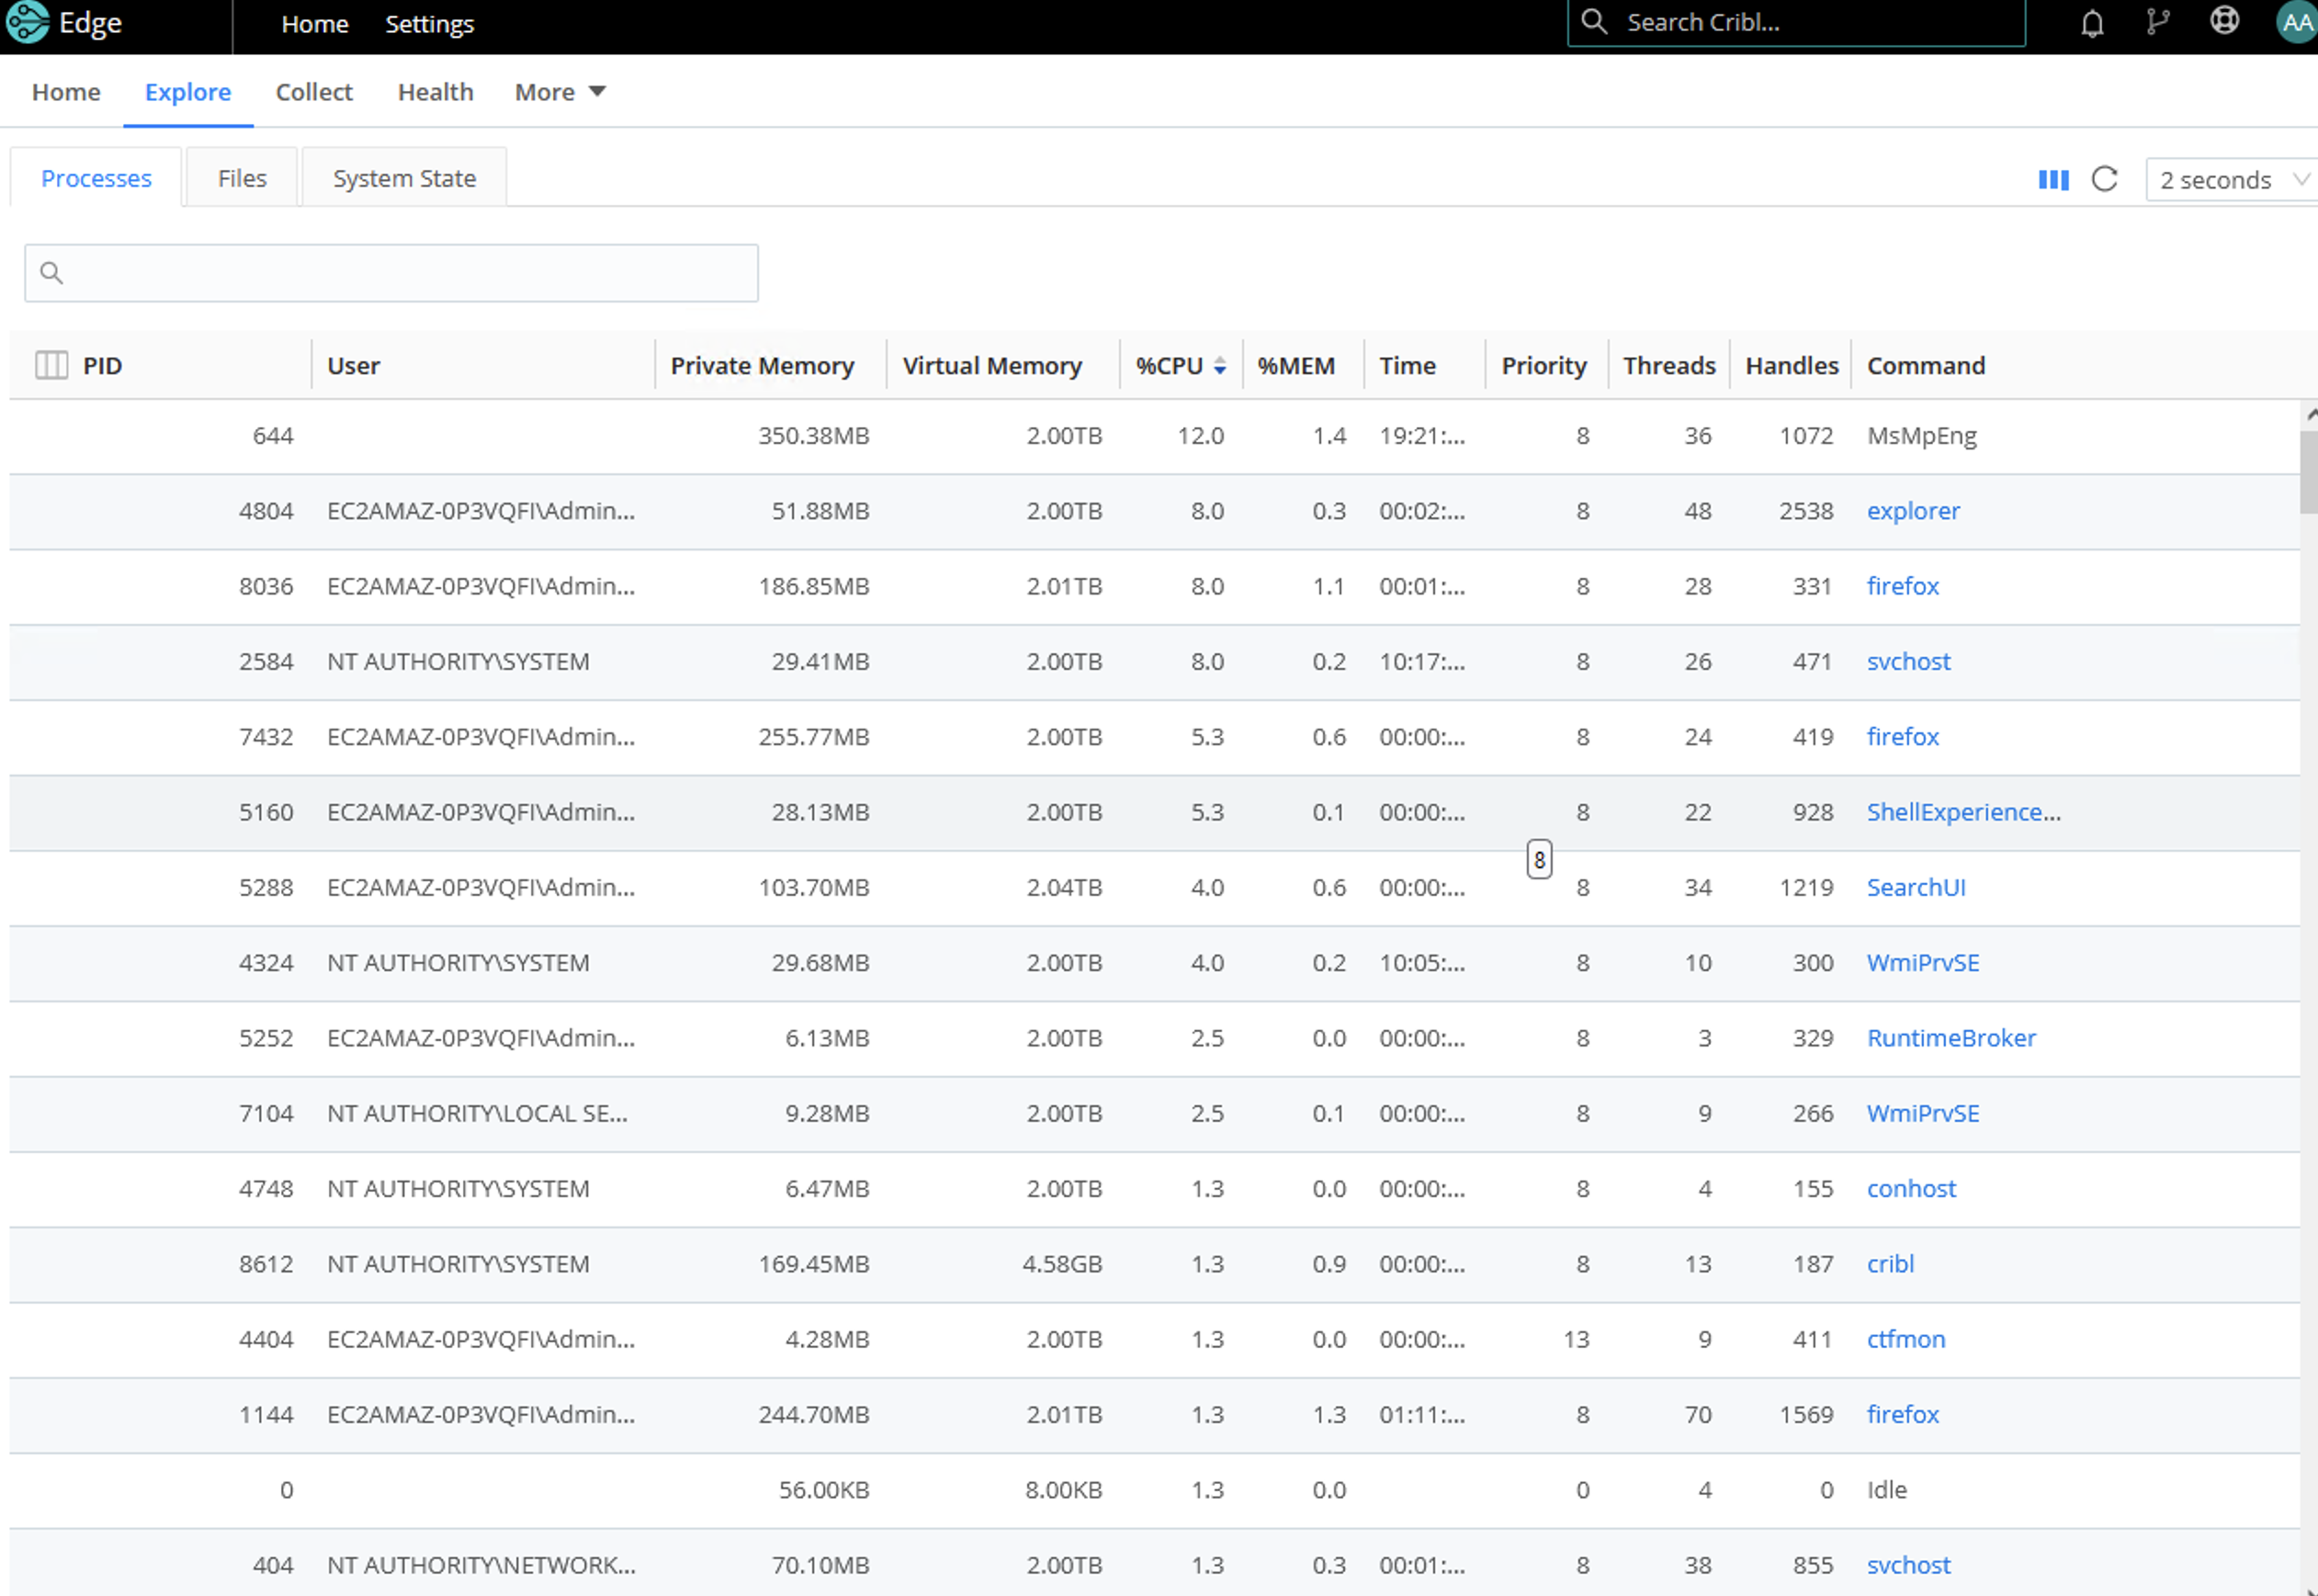
Click on any of the rows to display a modal with basic information on the process, including CPU usage, Memory usage, and I/O graphs.
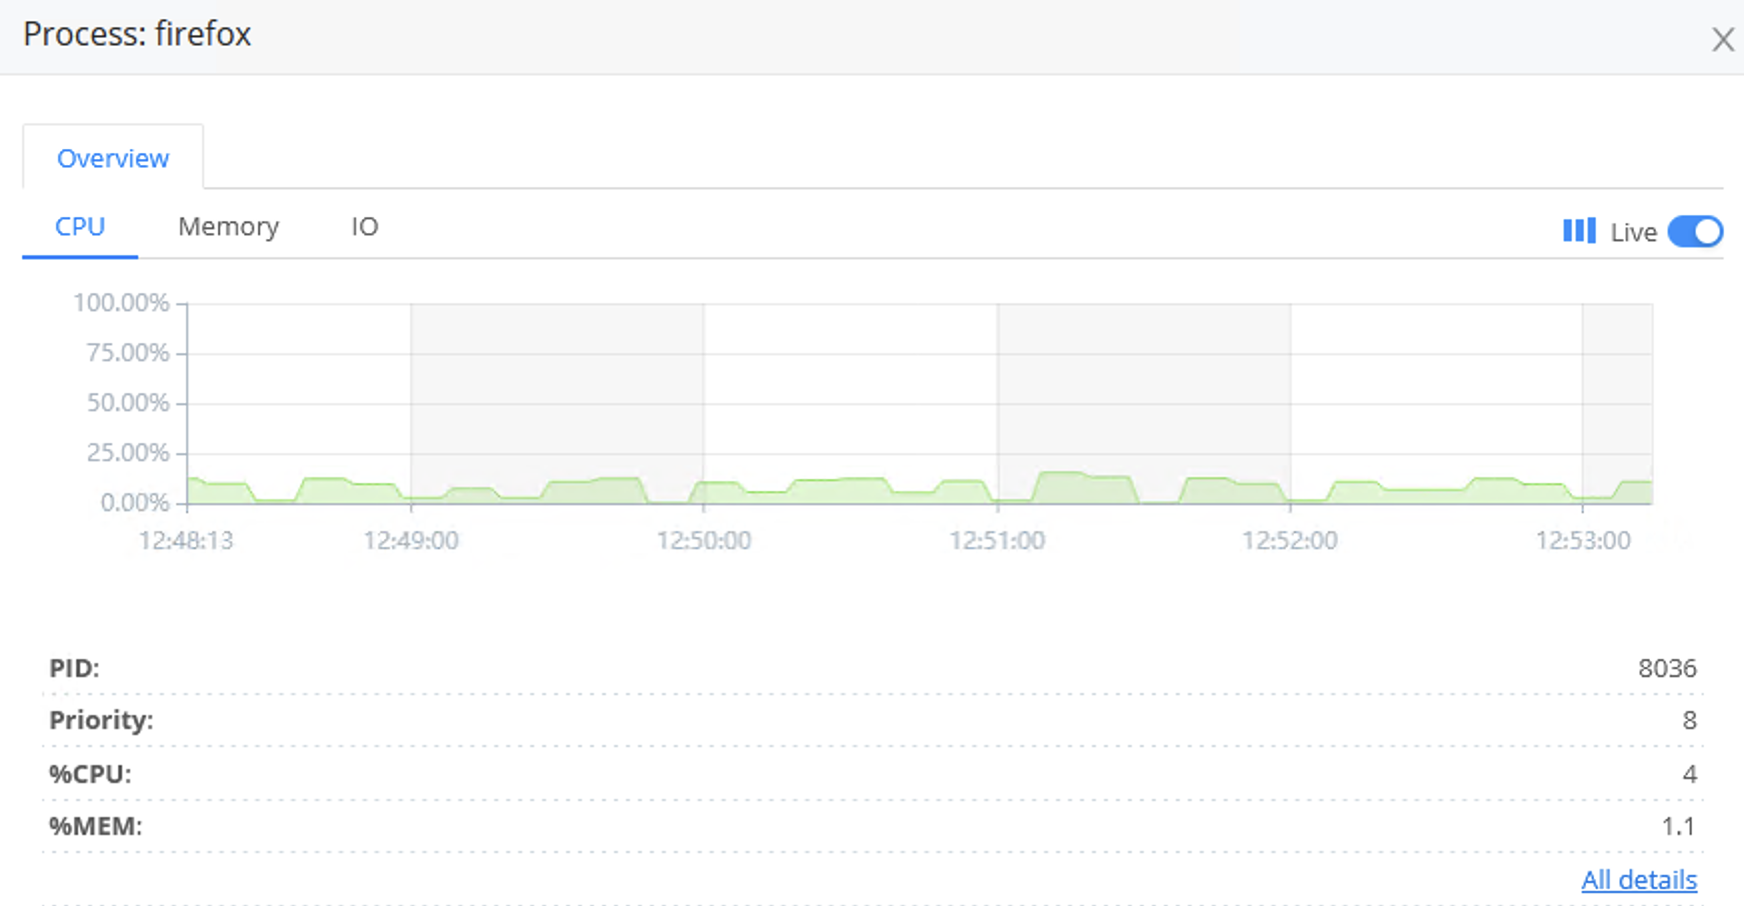
In this modal, click All details to get a table view of processes’ information. To access this information, you would normally need to SSH to the machine; this view makes troubleshooting across multiple systems much easier.
Files
The Files tab enables you to specify a list of directories and files to actively monitor. There are two discovery modes:
- Manual
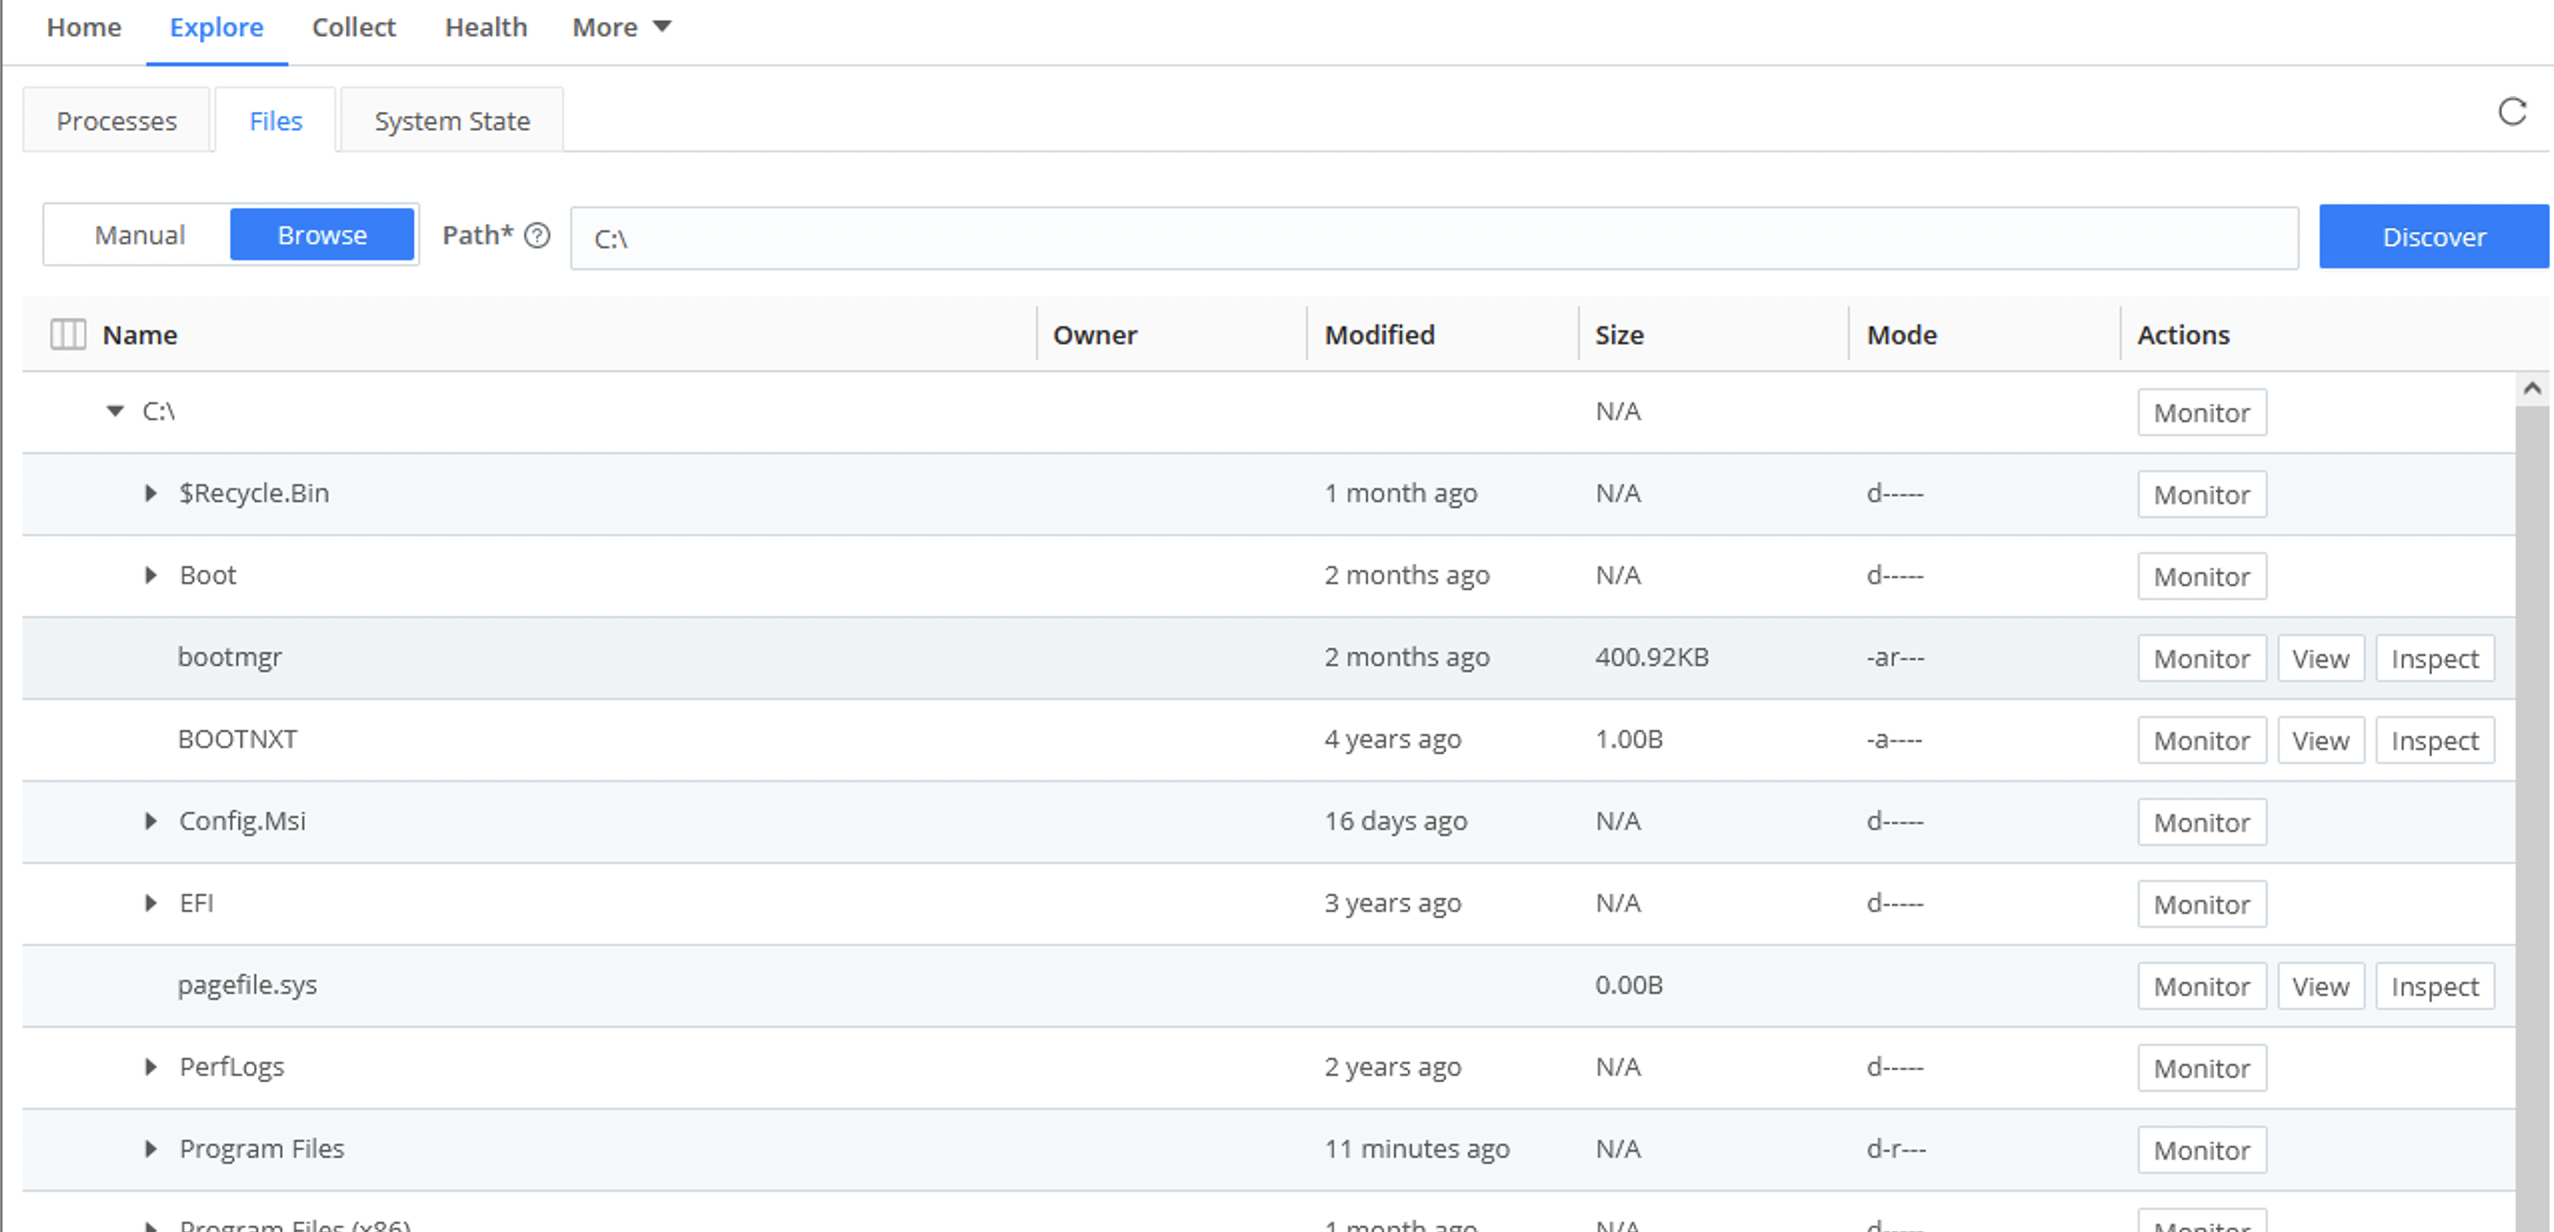
- Browse
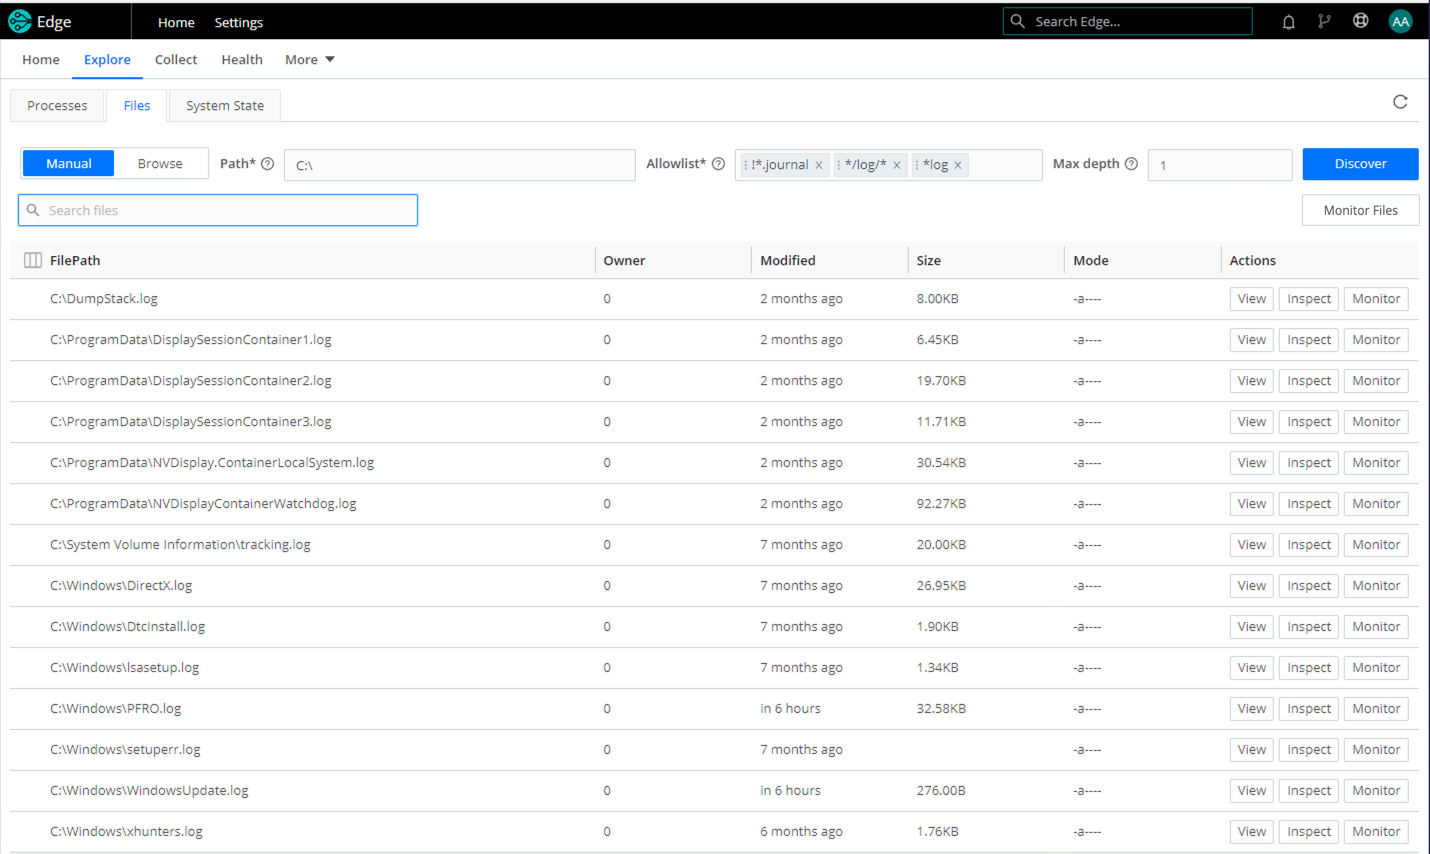
Manual mode provides the following options:
Path
The Path field tells Cribl Edge to discover the files within the path (a directory) that you specify, down to the Max depth.
Allowlist
The Allowlist field supports wildcard syntax, and supports the exclamation mark (!) for negation. For example, you can use !*cribl*access.log to prevent Cribl Edge from discovering its own access log. The default filters are */log/* and *log.
Click any file to see a representation of the lines it contains. To restrict how much data is displayed, you can use the search field or time picker on the Search tab.
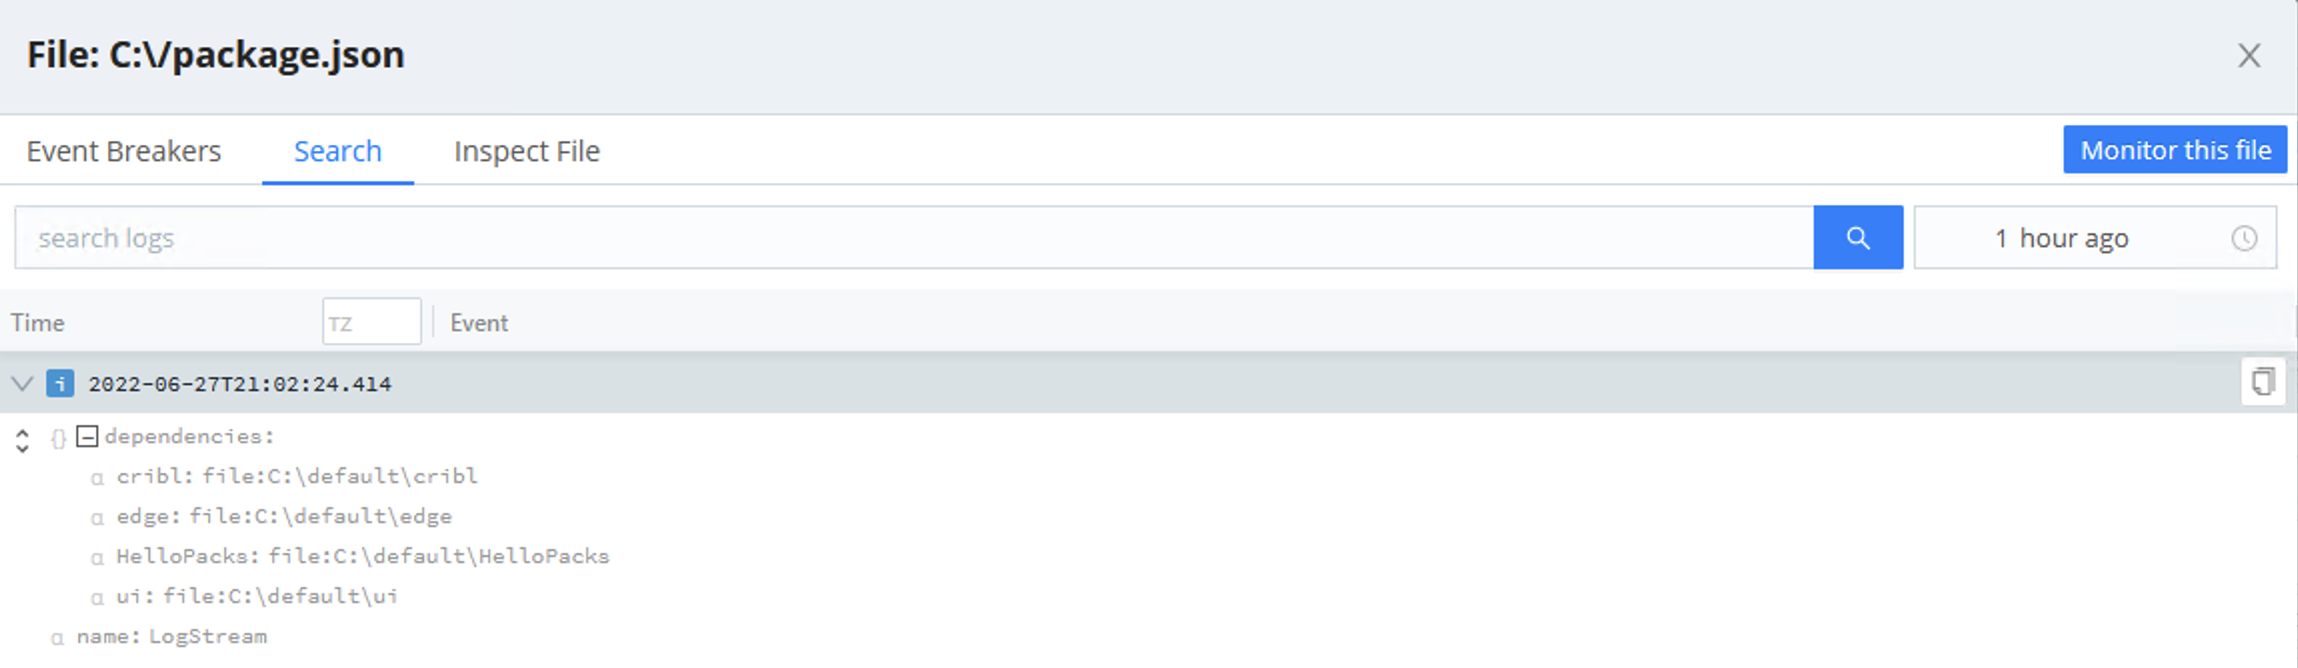
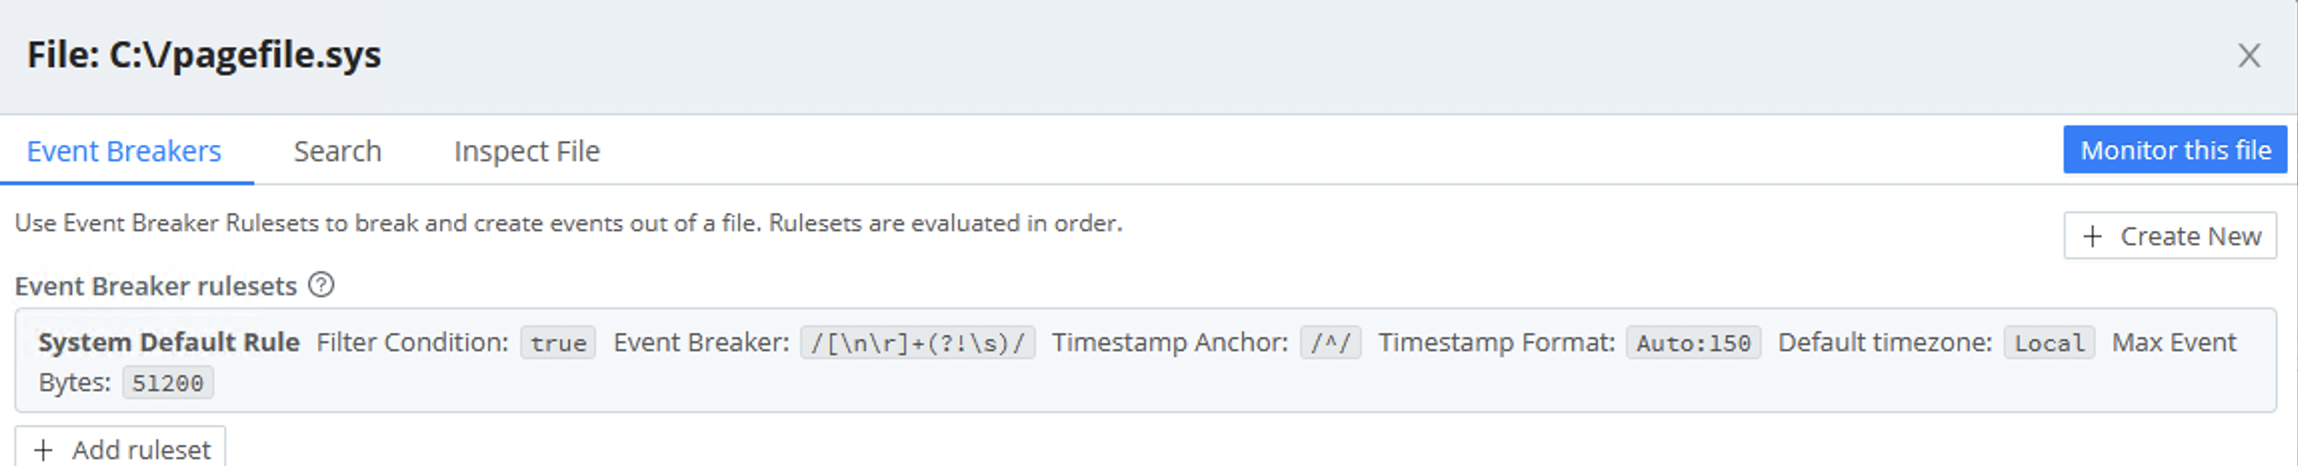
If the representation of events shown on the Search tab isn’t ideally suited to the file’s contents, you can use the Event Breakers tab to refine it.
In both Manual and Browse mode, you can click Monitor this file to display the File Monitor’s configuration modal.
Cribl Edge on Windows does not currently support the Inspect feature to view file metadata, including permissions, file size, user, and modified date.
Max Depth
The Max depth field is empty by default. Cribl Edge will search subdirectories, and their subdirectories, downward without limit.
If you enter 0, Cribl Edge will discover only the top-level files within the specified path. If you specify 1, Cribl Edge will discover files one level down from the top. Follow this pattern to specify the depth you want.
Monitor Files
The Monitor Files button opens a New File Monitor modal prefilled with the discovery mode, path, max depth, and allowlist entries specified on the Files tab.
Monitor
Click a file’s Monitor button to configure your File Monitor Source to generate events from the file’s lines or records.
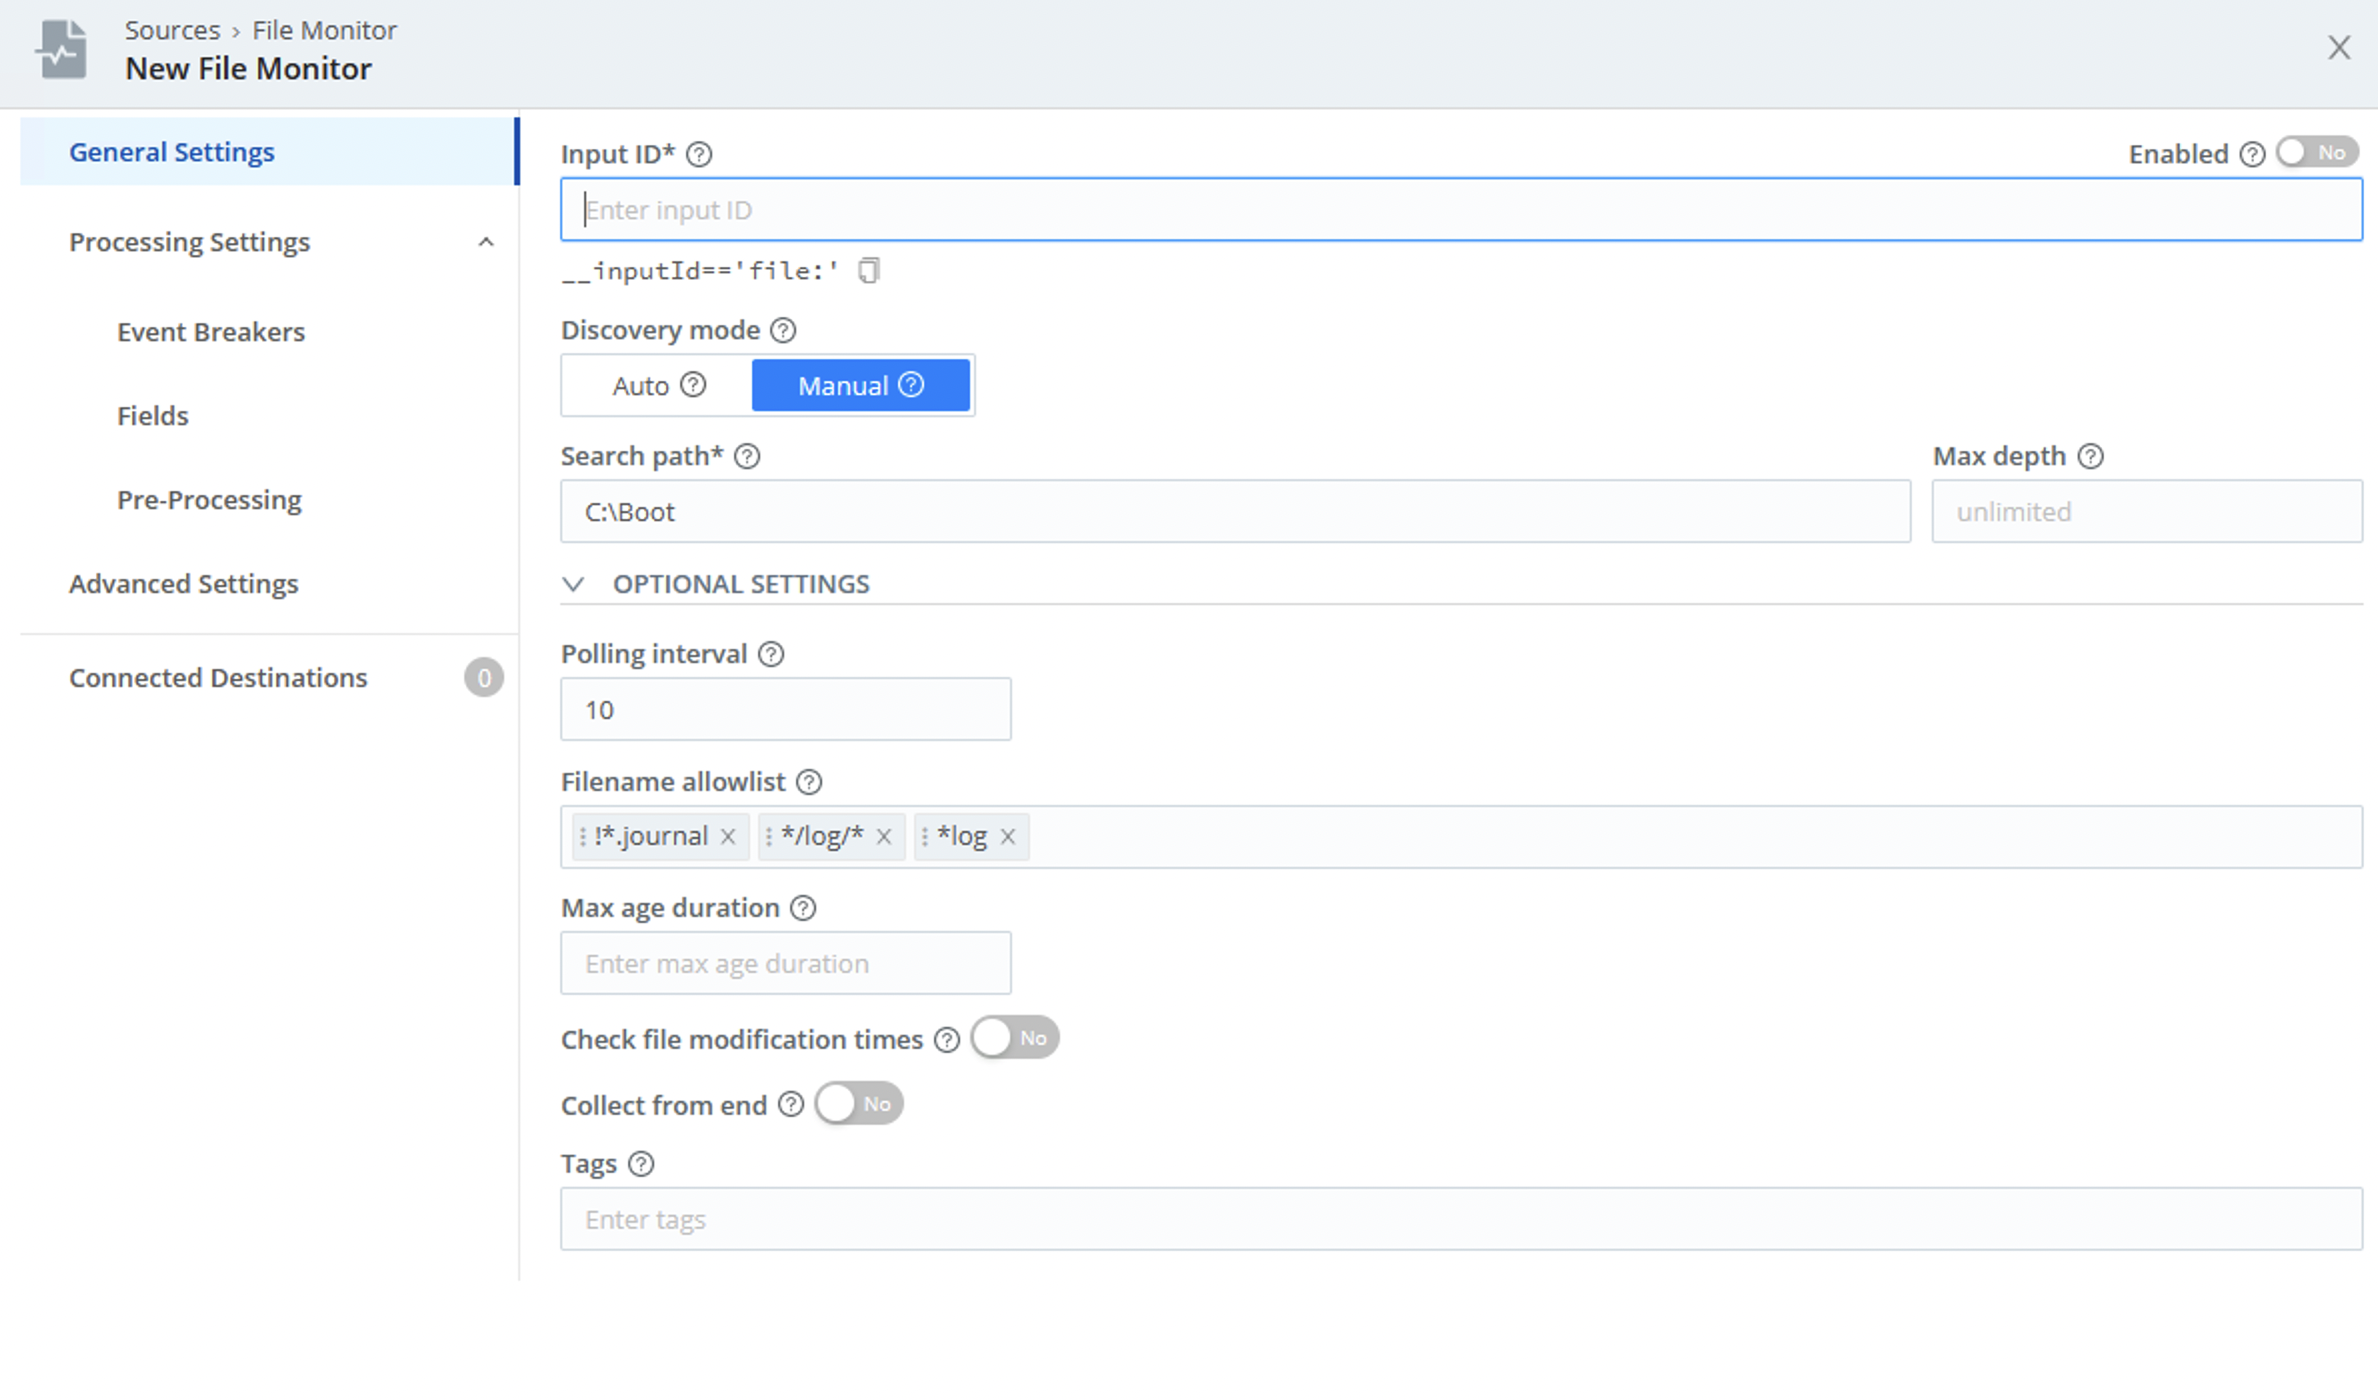
The Monitor feature automatically prepopulates the modal with the following settings configured on the Files tab:
- Search path
- Discovery mode: Defaults to Manual for Windows.
- Max depth
- Filename allowlist
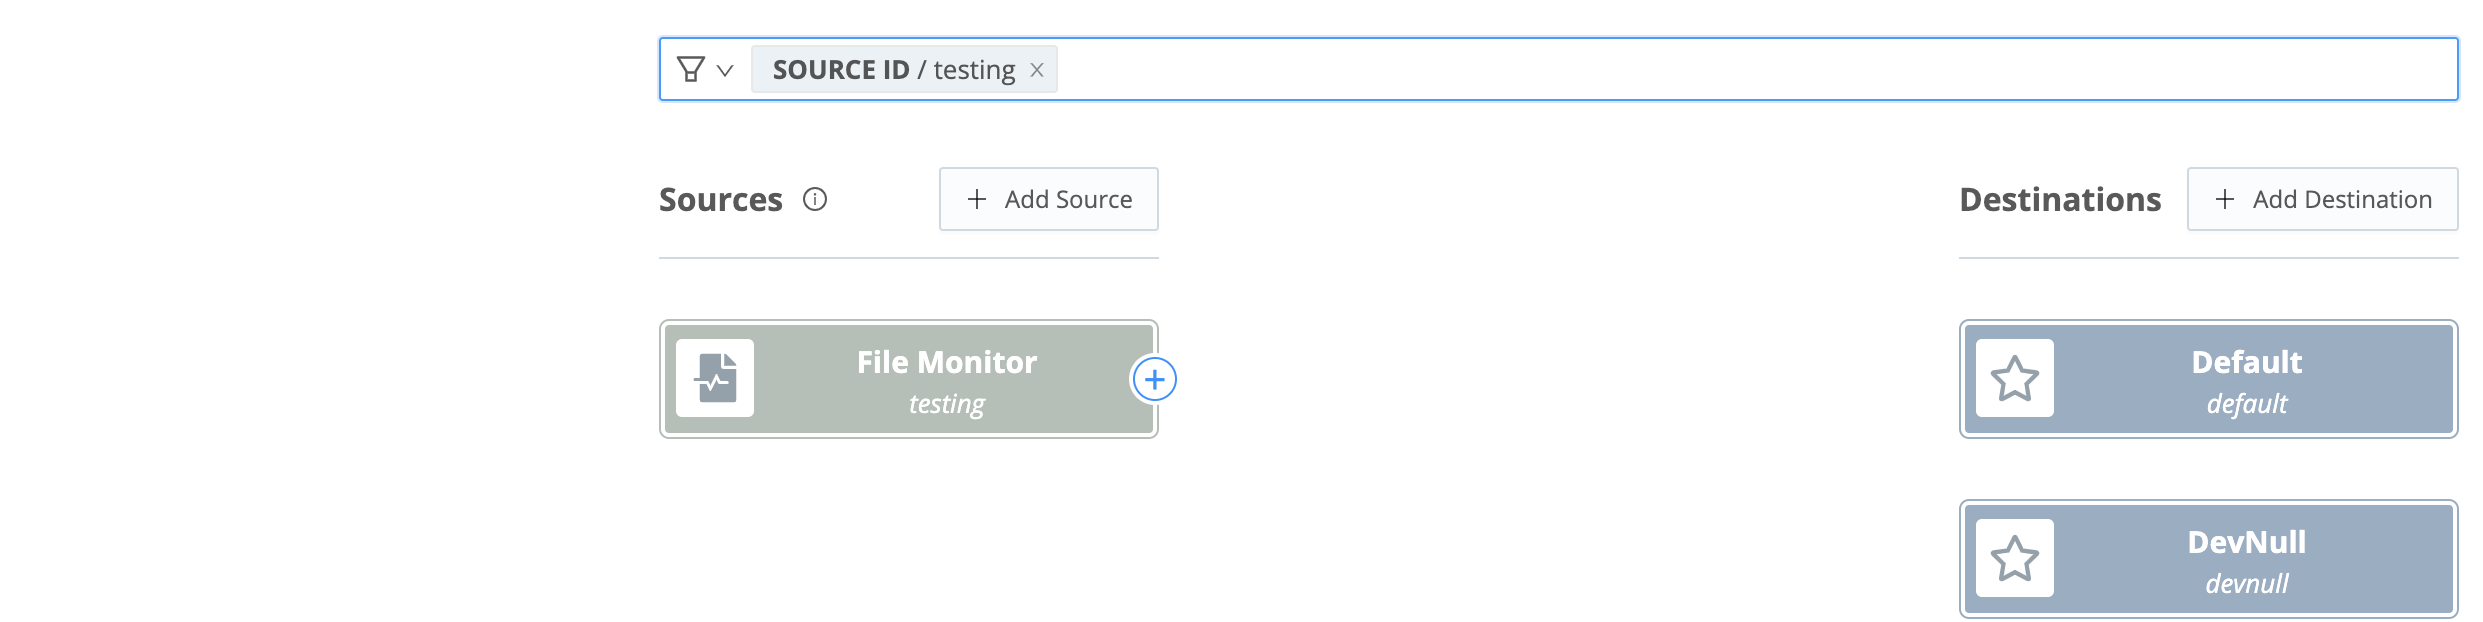
Note that the Connected Destinations section defaults to QuickConnect, Cribl Edge’s graphical UI. In the Connected Destinations section, you can select a Pipeline or Pack and a Destination. Otherwise, when you save, you’ll be routed to the Collect page to set up your connections via QuickConnect.
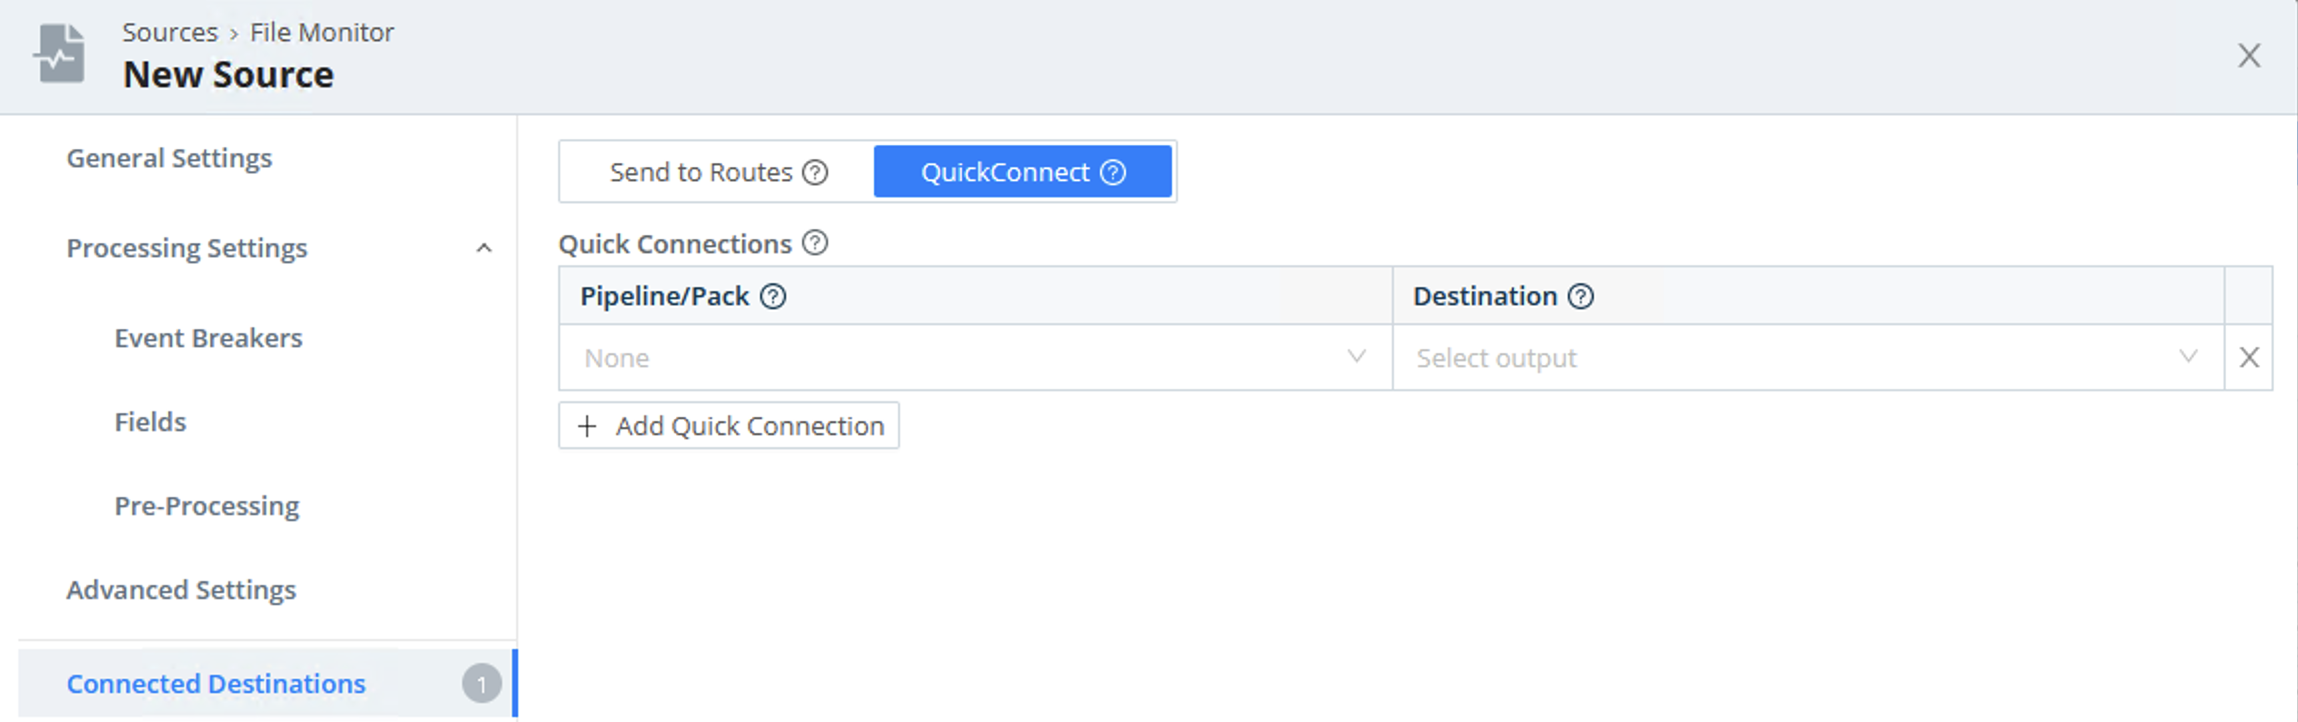
For details about making these connections, see File Monitor and QuickConnect.
Exploring Files with Event Breakers
When you click a file in the Files tab, and Cribl Edge shows a representation of the lines that the file contains - how does that work? Cribl Edge is applying a default Event Breaker to format the file.
You are not limited to the default Event Breaker, though. Select the Event Breakers tab, then:
To apply a different (existing) Event Breaker, click Add ruleset, then select the desired ruleset from the Event Breaker rulesets drop-down.
To create a new Event Breaker ruleset, click Create New. In the resulting New Ruleset modal, proceed as described here. Later, you can reuse the new Event Breaker as part of a Source or a Collector.
While you create the new ruleset, Cribl Edge pulls the contents of the open file into the Sample File area. Toggle between the In and Out tabs to compare, respectively, the original content and the content as modified by the Event Breaker you’re creating.
Now return to the Search tab - the contents of your chosen file will appear with the new Event Breaker applied.
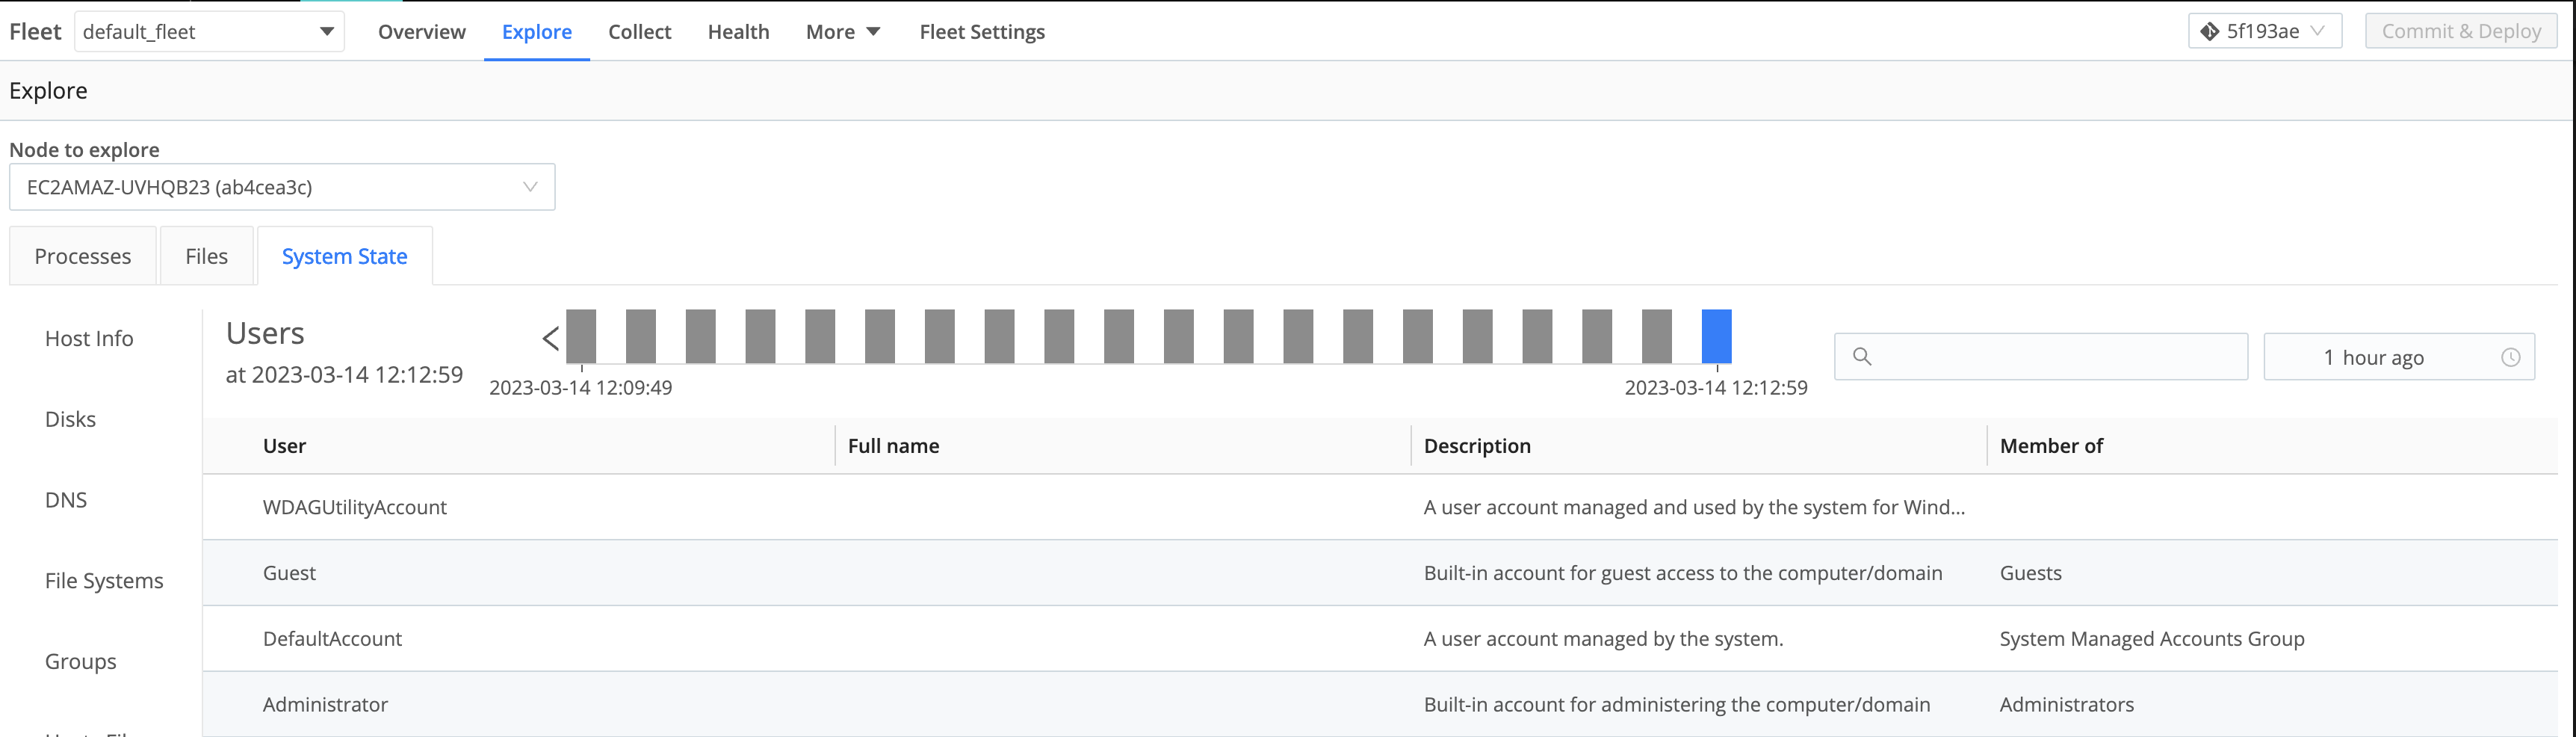
System State
The System State upper tab provides access to these left tabs:
To display any of the tabs above, you need to configure and enable the System State Source. Also, make sure that the Source’s Collector Settings fields are enabled.
Host Info/Metadata
Cribl Edge can add a __metadata property to every event emitted from every enabled Source. The Host Info tab displays the metadata collected for each Edge Node.
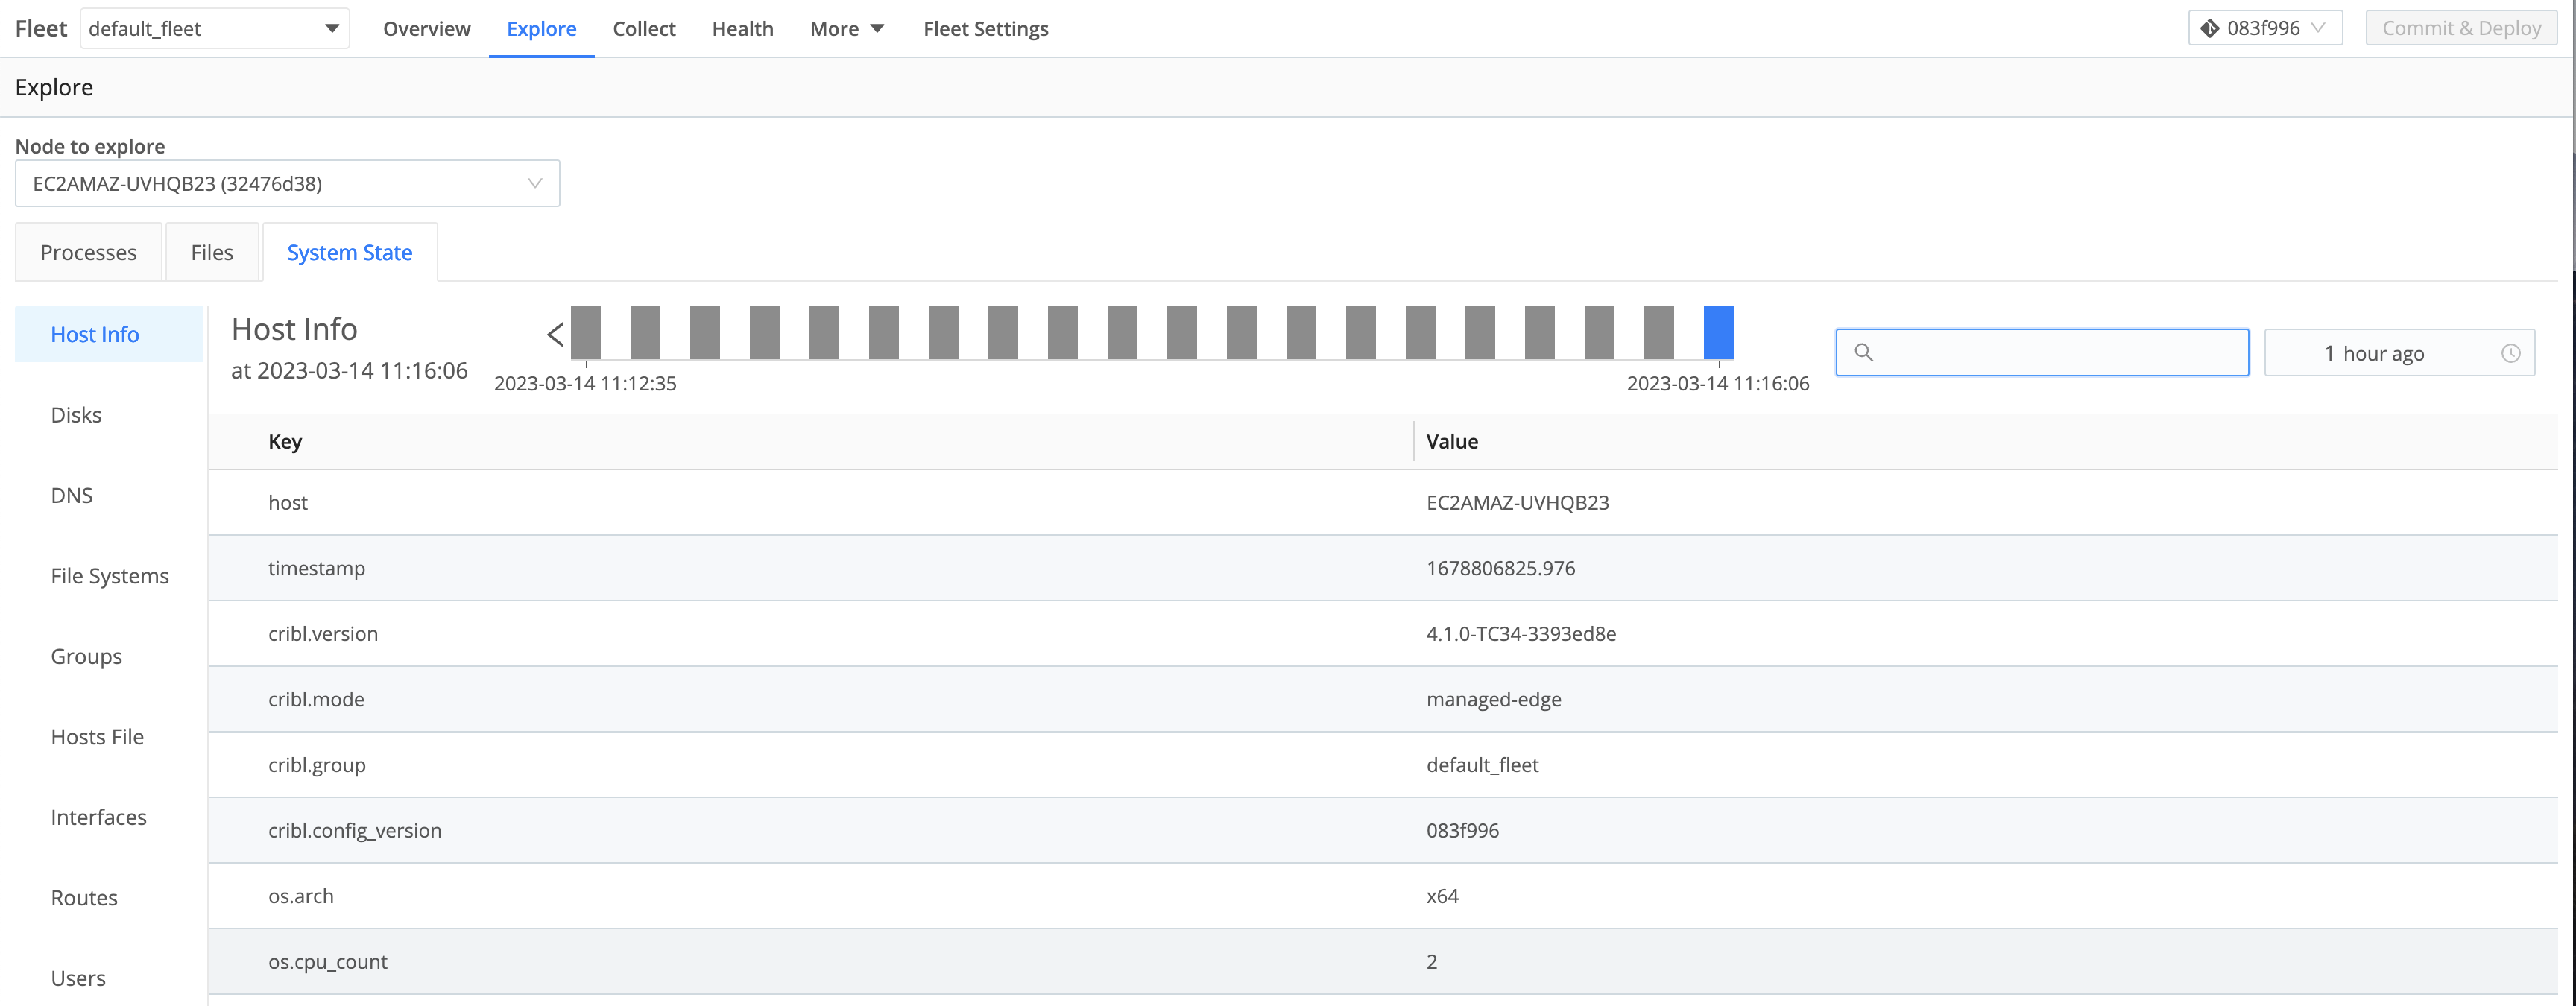
The metadata surfaced by an Edge Node can be used to:
- Enrich events (with an internal
__metadatafield). - Display to users as a part of instance exploration.
To customize the type of metadata collected, select Settings > General Settings > Limits > Metadata. Use the Event metadata sources drop-down (and/or the Add source button) to add and select metadata sources.
In Edge mode, all the Event metadata sources are enabled by default.
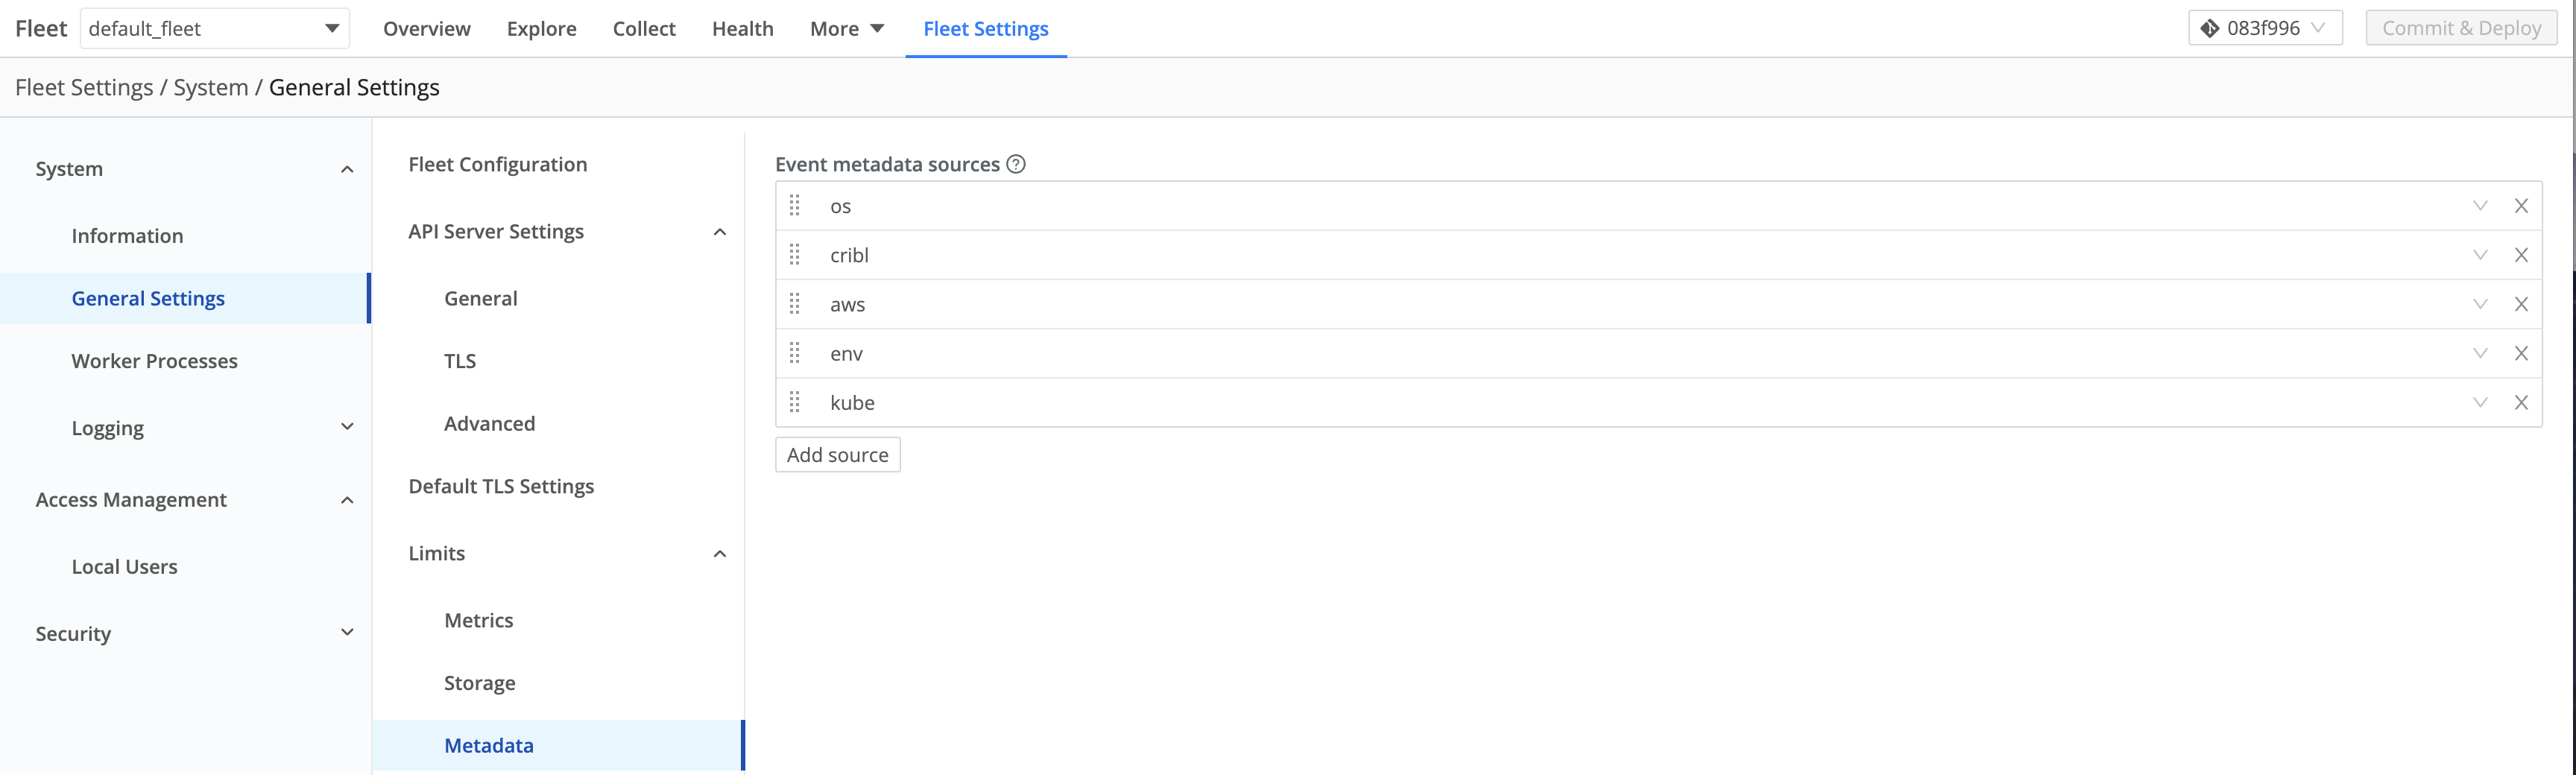
The metadata sources that you can select here include:
os: Reports details for the host OS and host machine, like OS version, kernel version, CPU and memory resources, hostname, network addresses, etc.cribl: Reports the Cribl Edge version, mode, Fleet for managed instances, and config version.aws: Reports details for an EC2 instance, including the instance type, hostname, network addresses, tags, and IAM roles. For security reasons, we report only IAM role names.env: Reports environment variables.
When these metadata sources are enabled (and can get data), Cribl Edge will add the corresponding property to events, with a nested property for each enabled source.
Some metadata sources work only in configured environments. For example, the
awssource is available only when running on an AWS EC2 instance.If your security tools report denied outbound traffic to IP addresses like
169.254.169.168or169.254.169.254, you can suppress these by removingawsfrom the metadata sources described above. If you have a proxy setup, Cribl recommends adding these IP addresses to yourno_proxyenvironment variable.
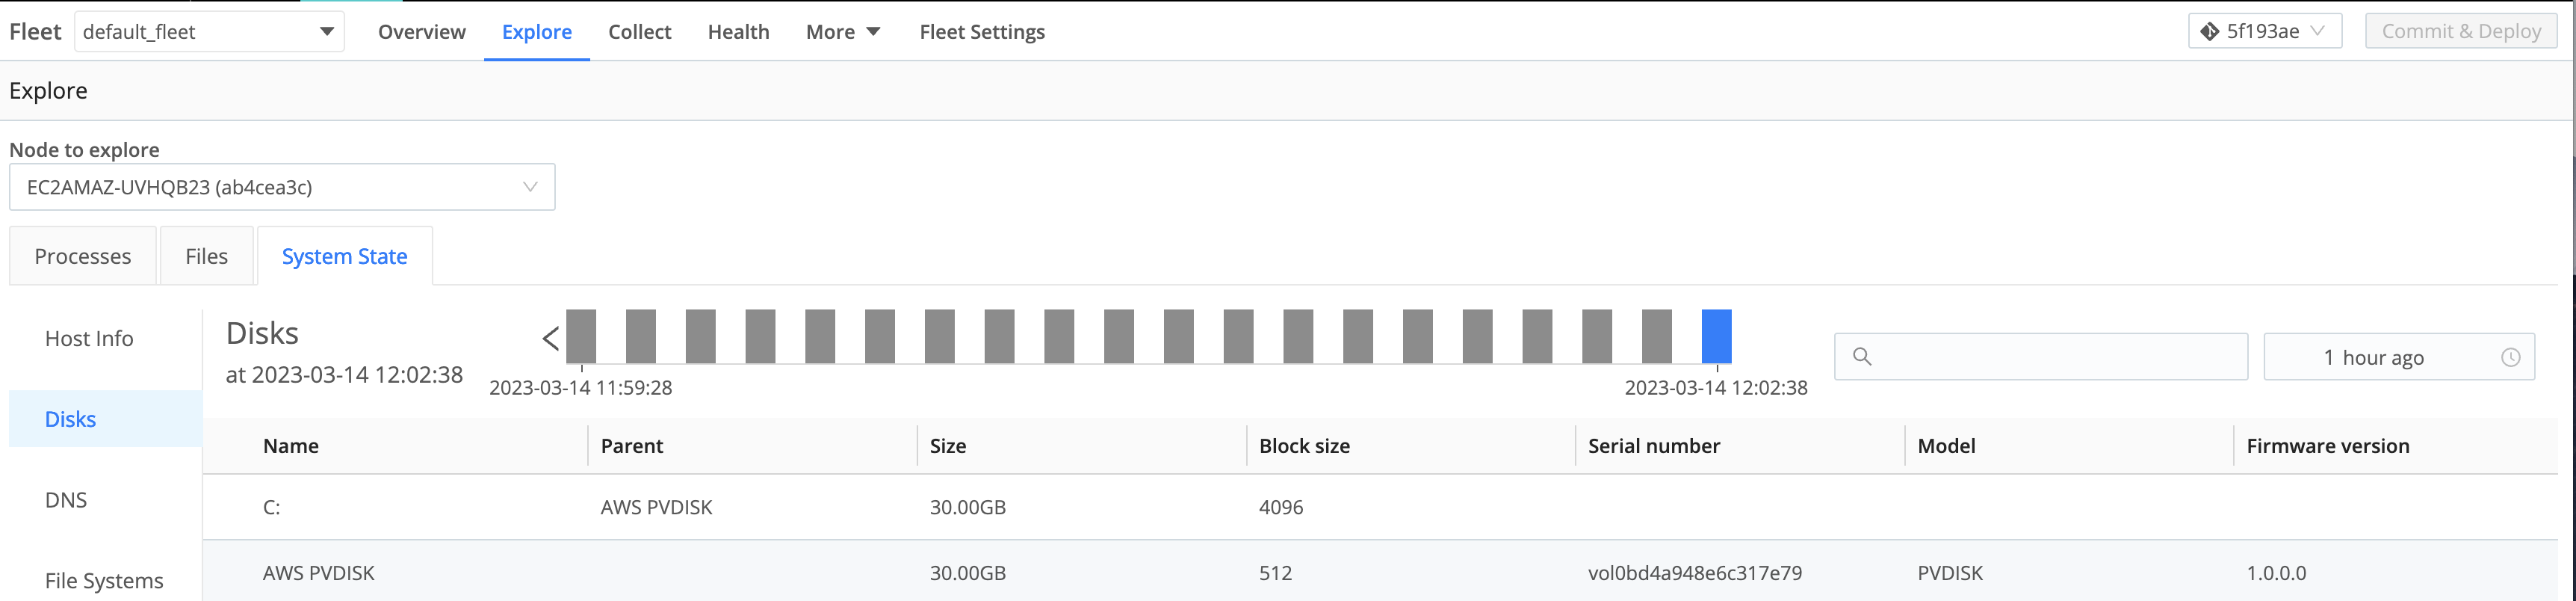
Disks
The Disks tab displays the inventory of physical disks and their partitions on the host system.
DNS
The DNS tab lists the DNS resolvers and search entries on the host system.
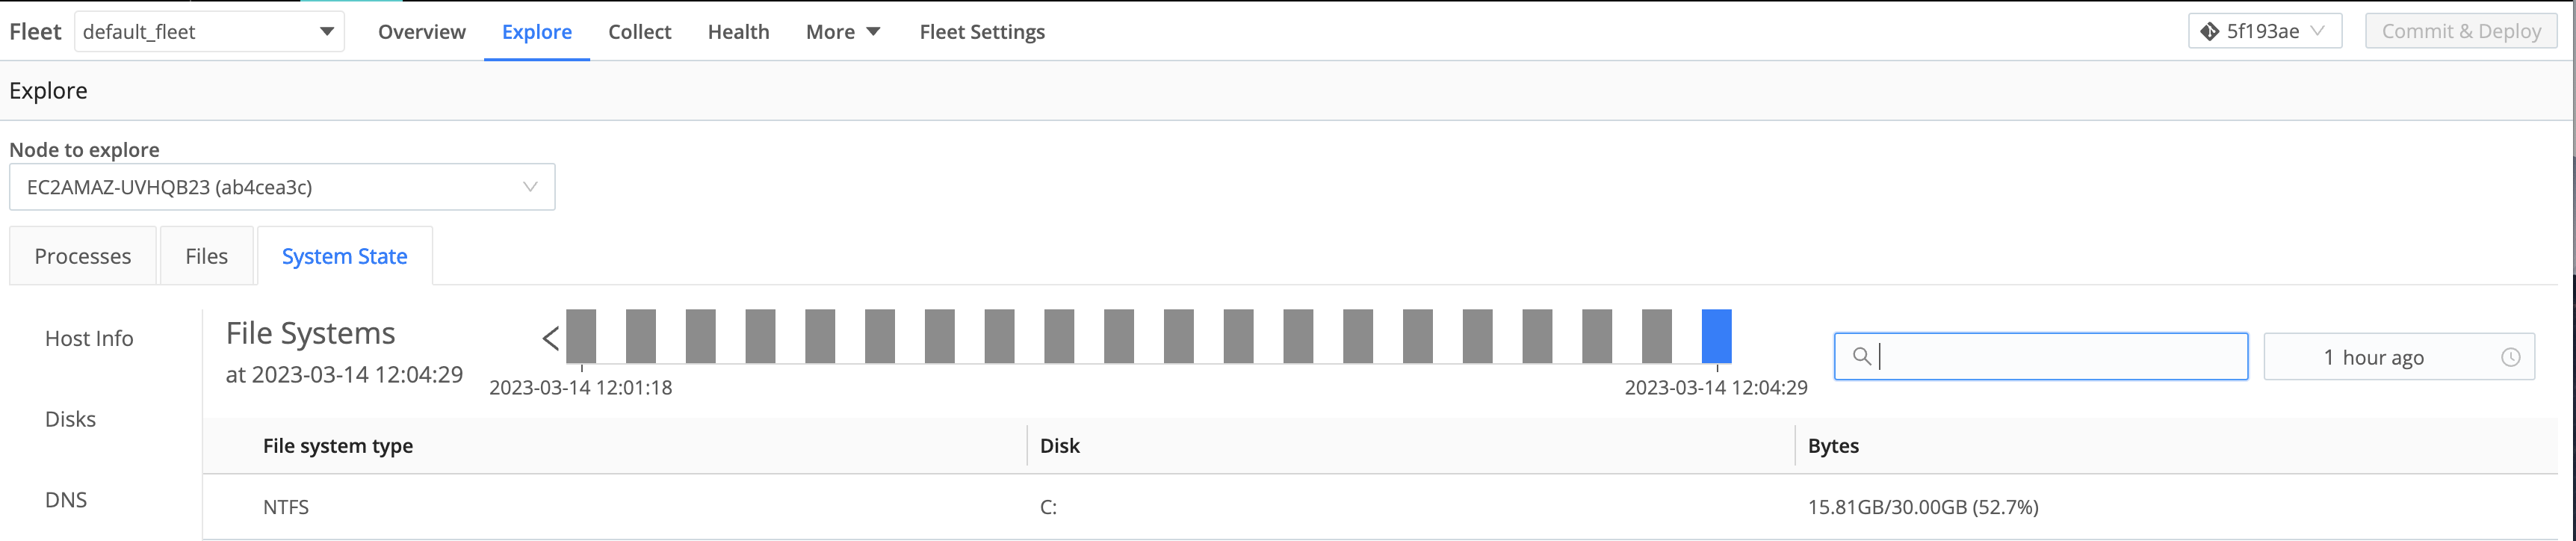
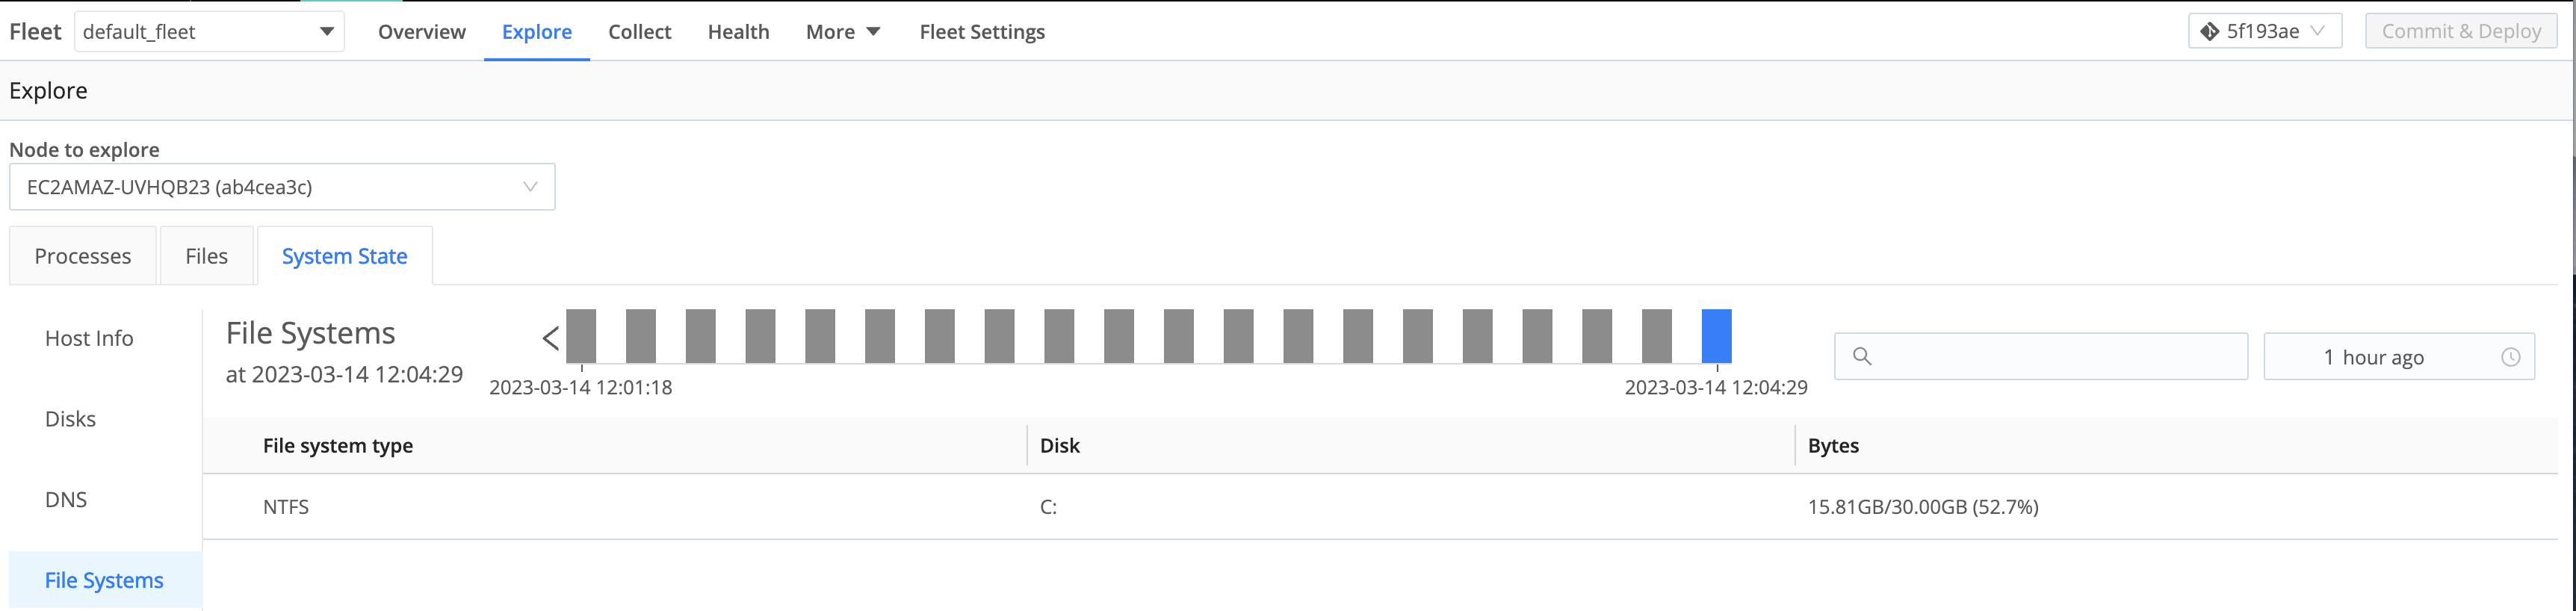
File Systems
The File Systems tab displays an inventory of the mounted file systems on the host system.
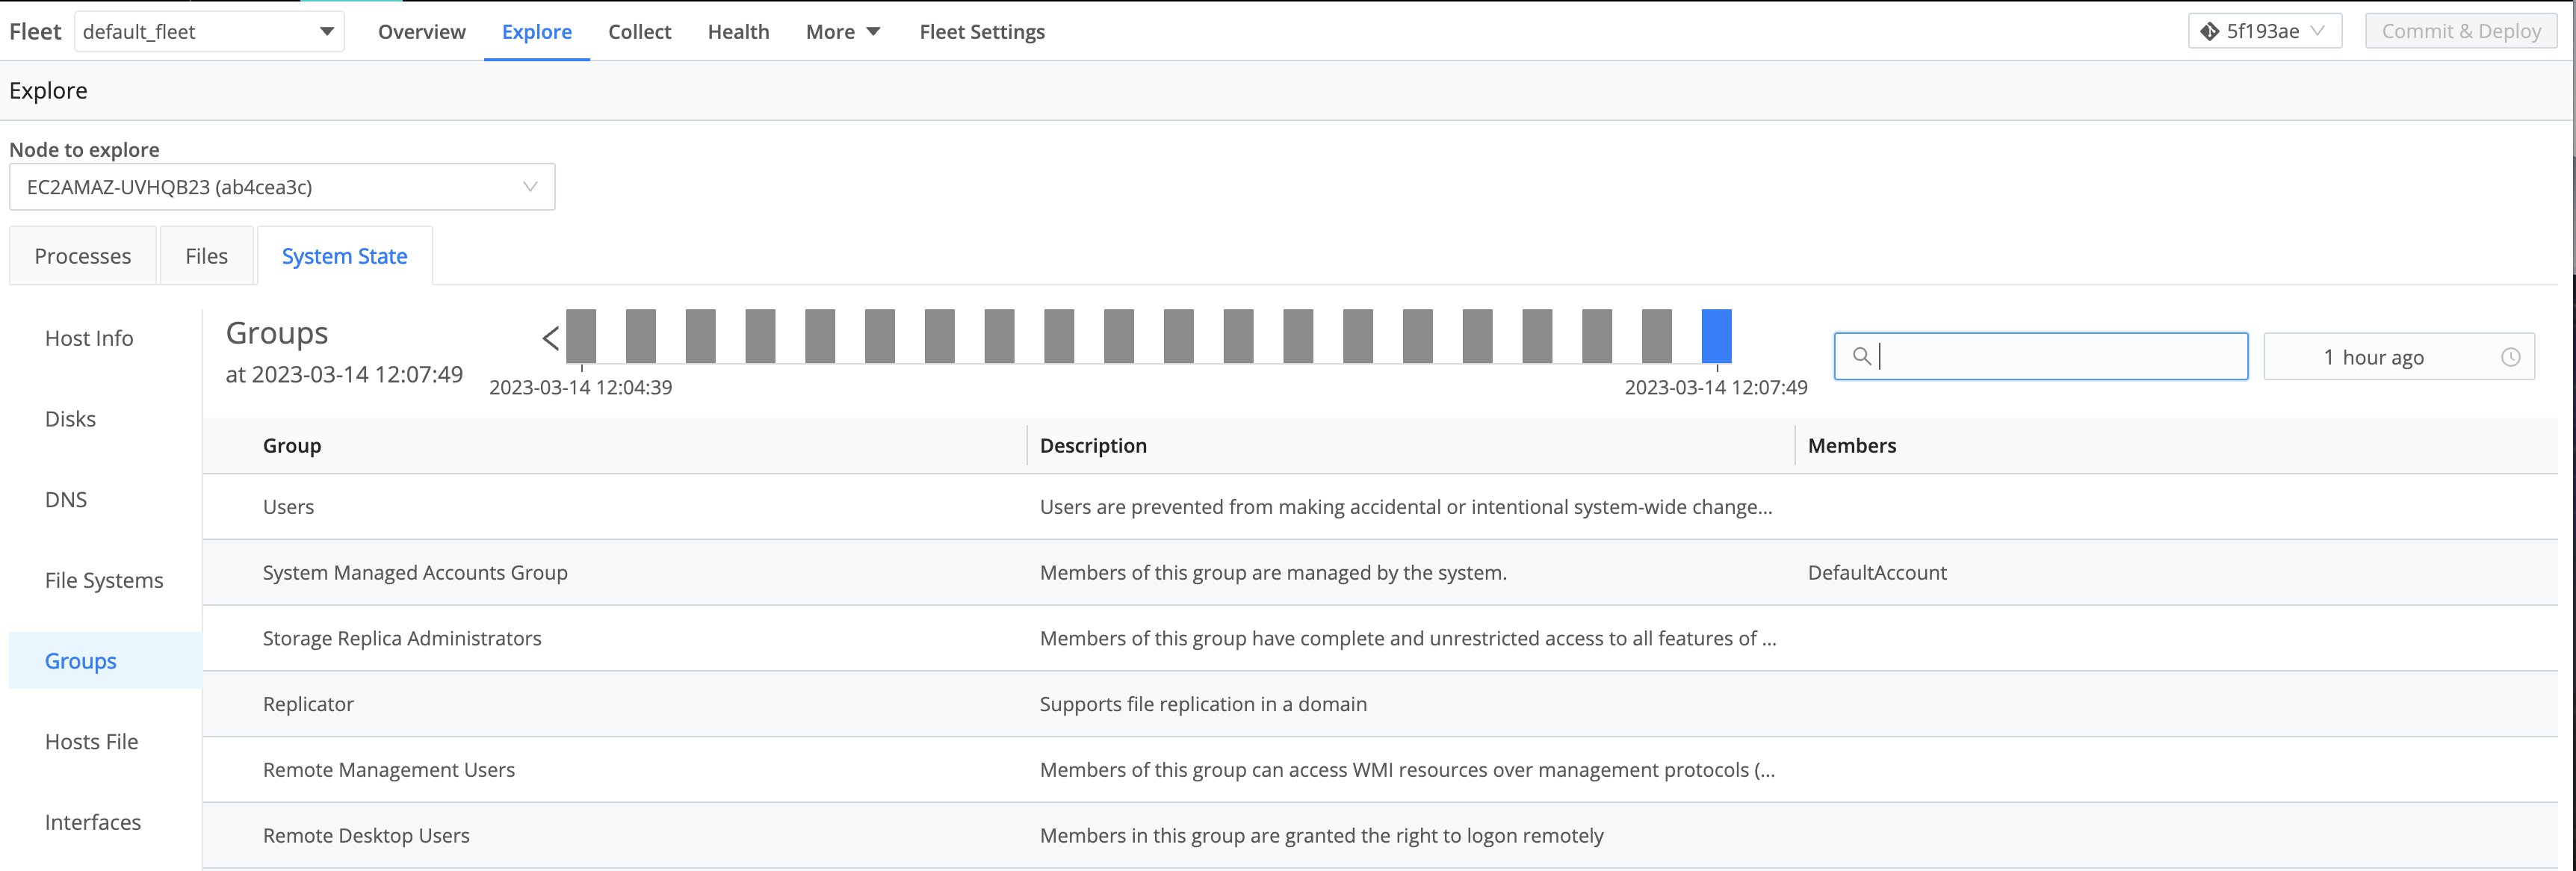
Groups
The Groups tab displays a list of local groups including their names, descriptions, and members on the host system.
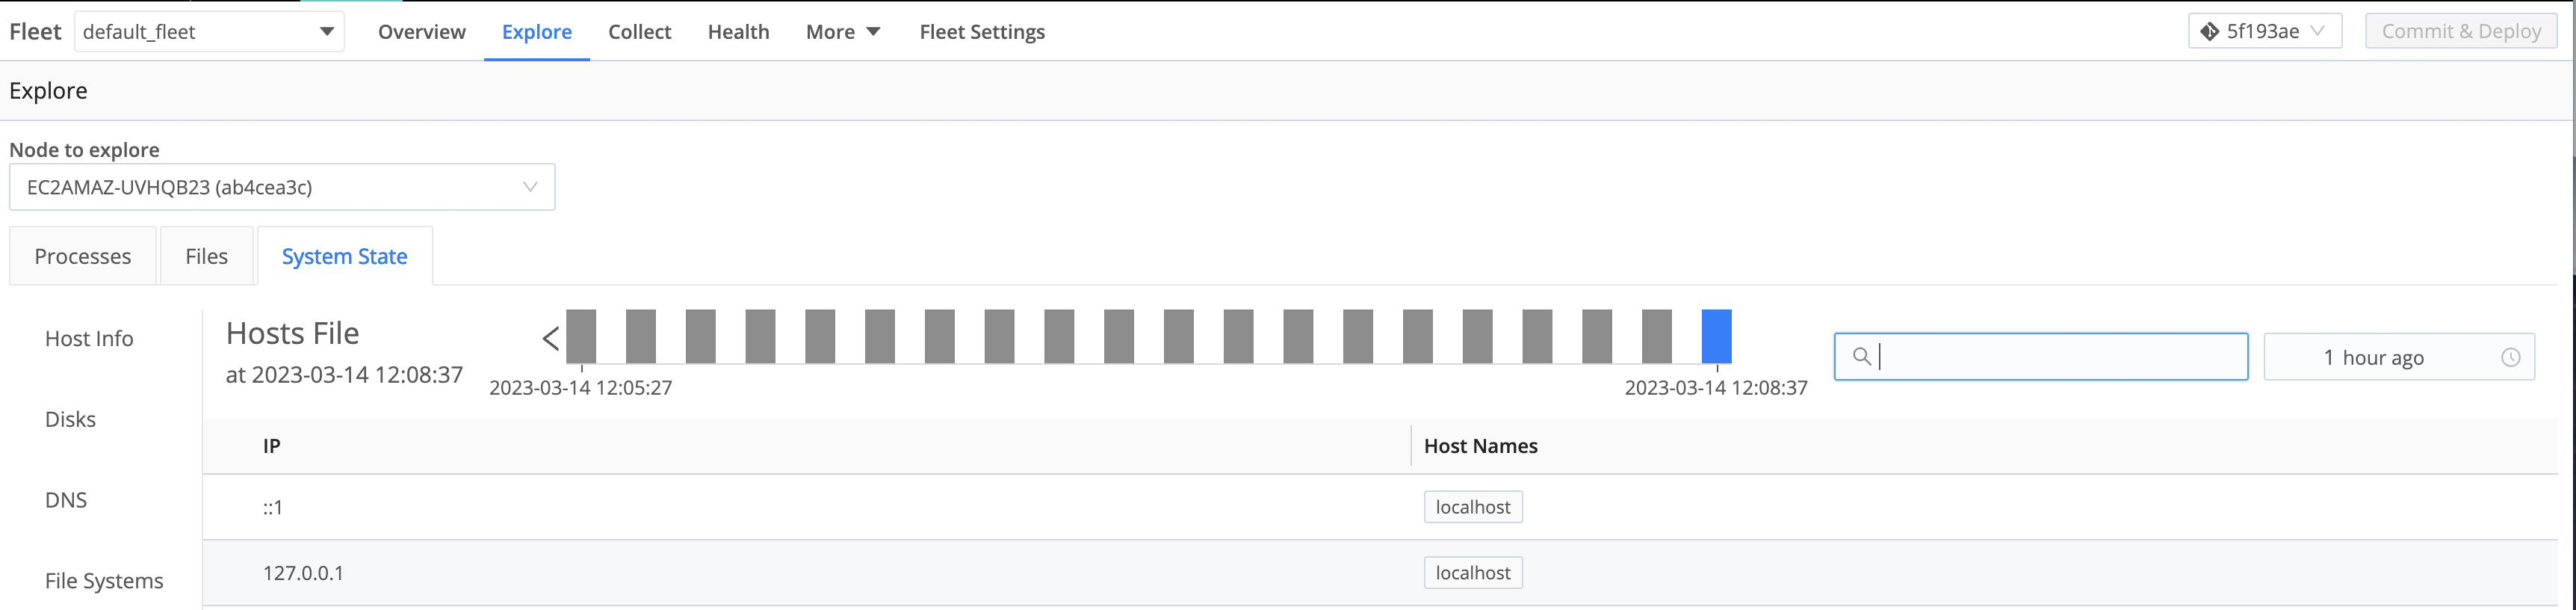
Hosts File
The Hosts File tab displays the current state on the host system.
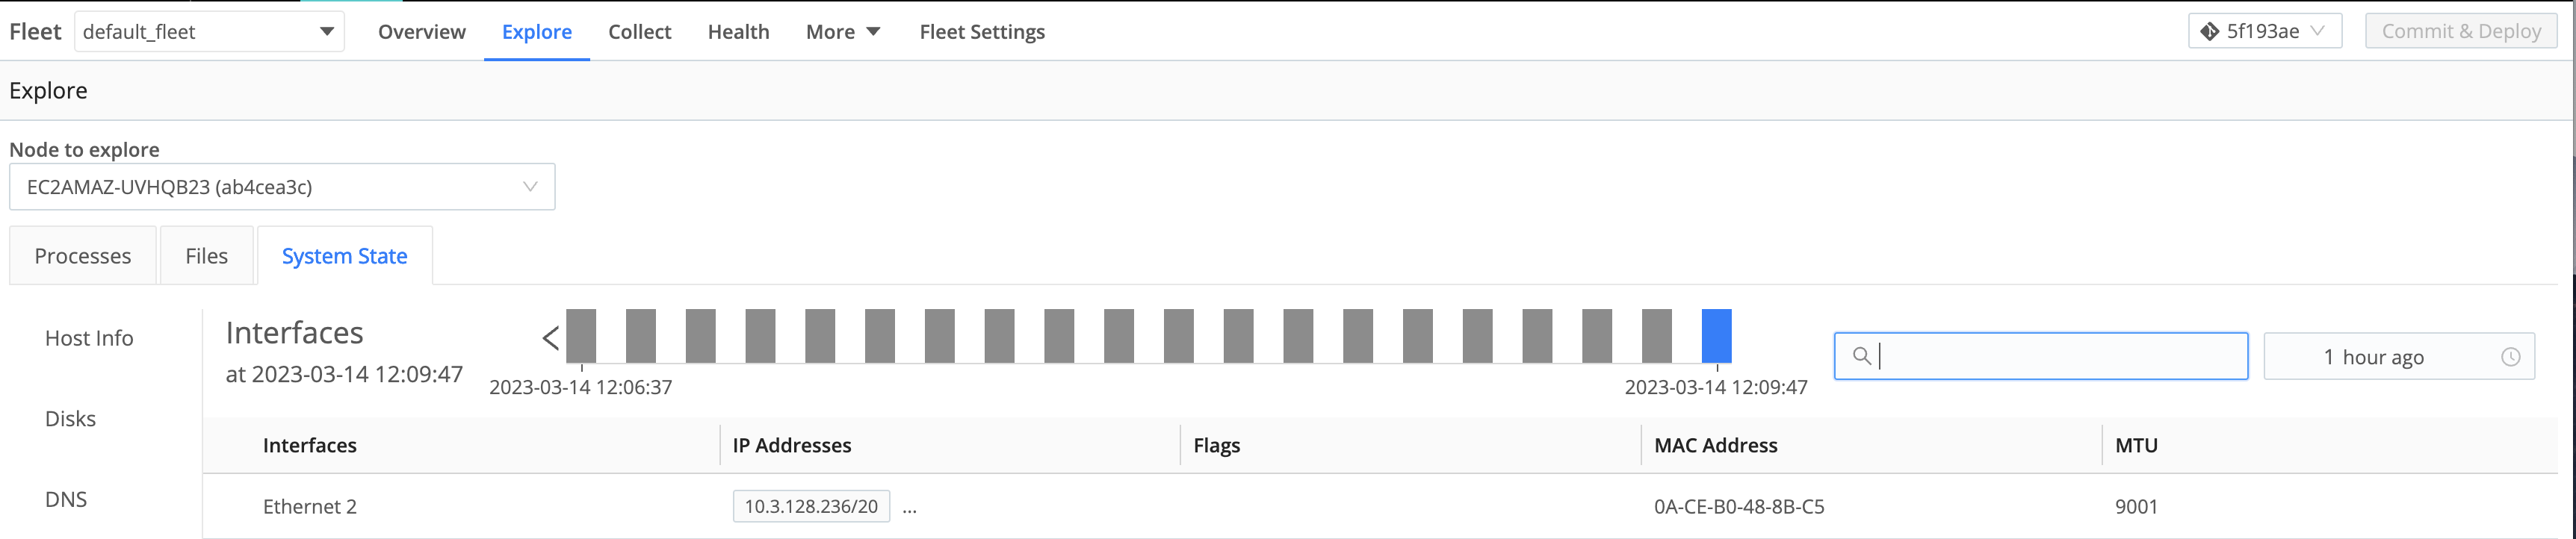
Interfaces
The Interfaces tab displays a list of each of the network interfaces on the host system.
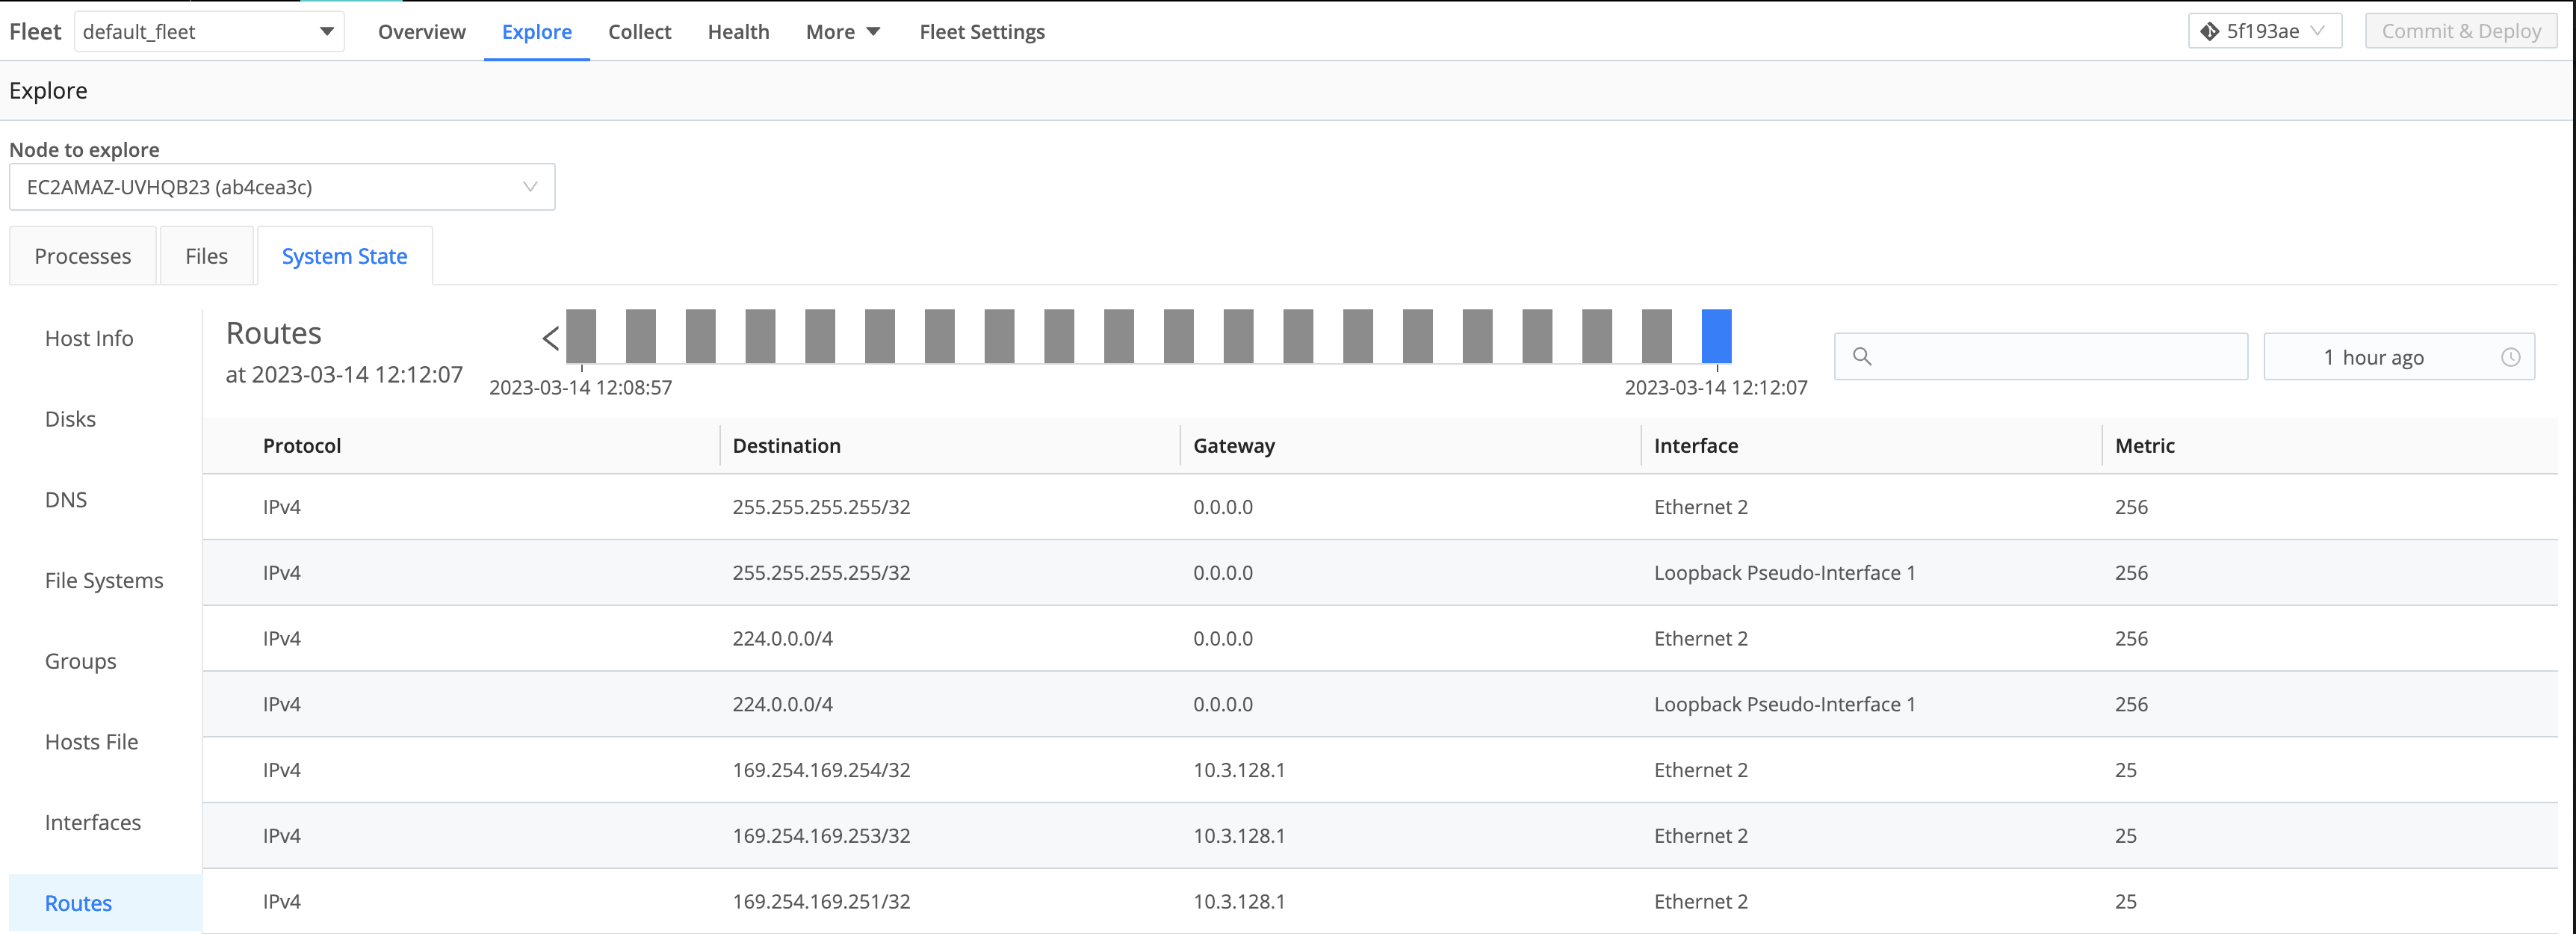
Routes
The Routes tab displays entries from network routes on the host system.
Users
The Users tab displays a list of local users on the host system.