These docs are for Cribl Edge 4.1 and are no longer actively maintained.
See the latest version (4.17).
Windows Observability Using Cribl Edge
Cribl Edge offers holistic support for Windows observability, allowing comprehensive data collection across your Windows servers to provide reliable monitoring and analysis. You can run Cribl Edge on your Windows servers (2016, 2019, or 2022) to collect observability data (both metrics and logs) and send them to your desired destinations. By combining Cribl Edge with your favorite system of analysis, or data visualization tool, you can identify and investigate issues faster and monitor applications more effectively.
In this guide, we will walk you through the following:
- Deploy Cribl Edge on Windows by using the bootstrap script to add an Edge Node.
- Create a Windows-specific Fleet, and modify Mapping Rulesets to assign Nodes to Fleets.
- Explore the Windows Node and get a snapshot of the host system’s current state.
- Locate and collect custom Windows event logs and send them to your desired destination.
- Collect Windows metrics and send them to your visualization tool of choice (or any supported destination).
- Collect logs using the File Monitor Source.
As a bonus, we’ll walk you through how to use Cribl’s Exec Source to execute Powershell commands and process them in Cribl.
Deploy Cribl Edge on Windows
This section covers creating a Windows-specific Fleet, adding Windows Nodes via bootstrap scripts, and assigning Nodes to Fleets or Subfleets via mapping rules.
Create a Windows-Specific Fleet
Before we deploy the Edge Node, let’s configure a Fleet. Fleets and their corresponding Subfleets allow you to author and manage configuration settings for a particular set of Edge Nodes. We recommend separating Linux and Windows machines into different Fleets per OS.
The first step is to configure a Fleet and name it: Windows.
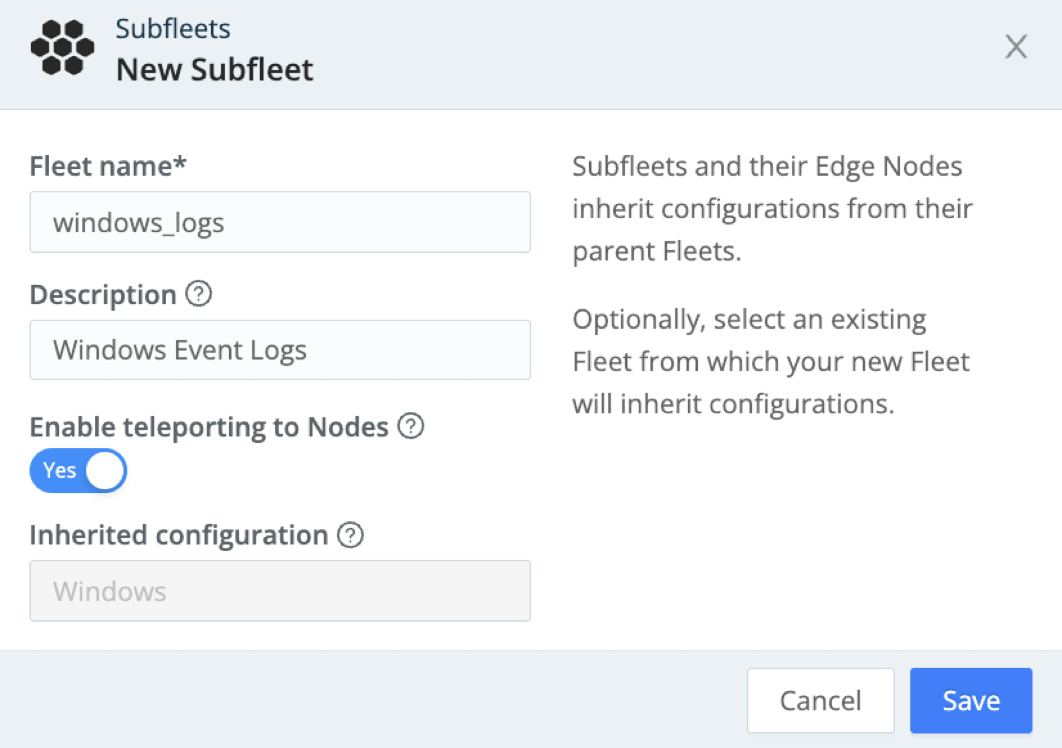
For our mapping illustration later, let’s also create a Subfleet in your Windows Fleet. In our example, we named it windows_logs.
We use the name
Windowsfor demonstration purposes and simplicity. Since Fleet names must be unique across your deployment, you should select a name that makes sense in practice. For better practices on designing and naming your Fleets, see the Fleet Hierarchy and Design doc.
Use the Bootstrap Script to Add an Edge Node
Next, bootstrap a new Windows Edge Node on your Fleet.
Below is a composite screenshot of adding an Edge Node on Windows.
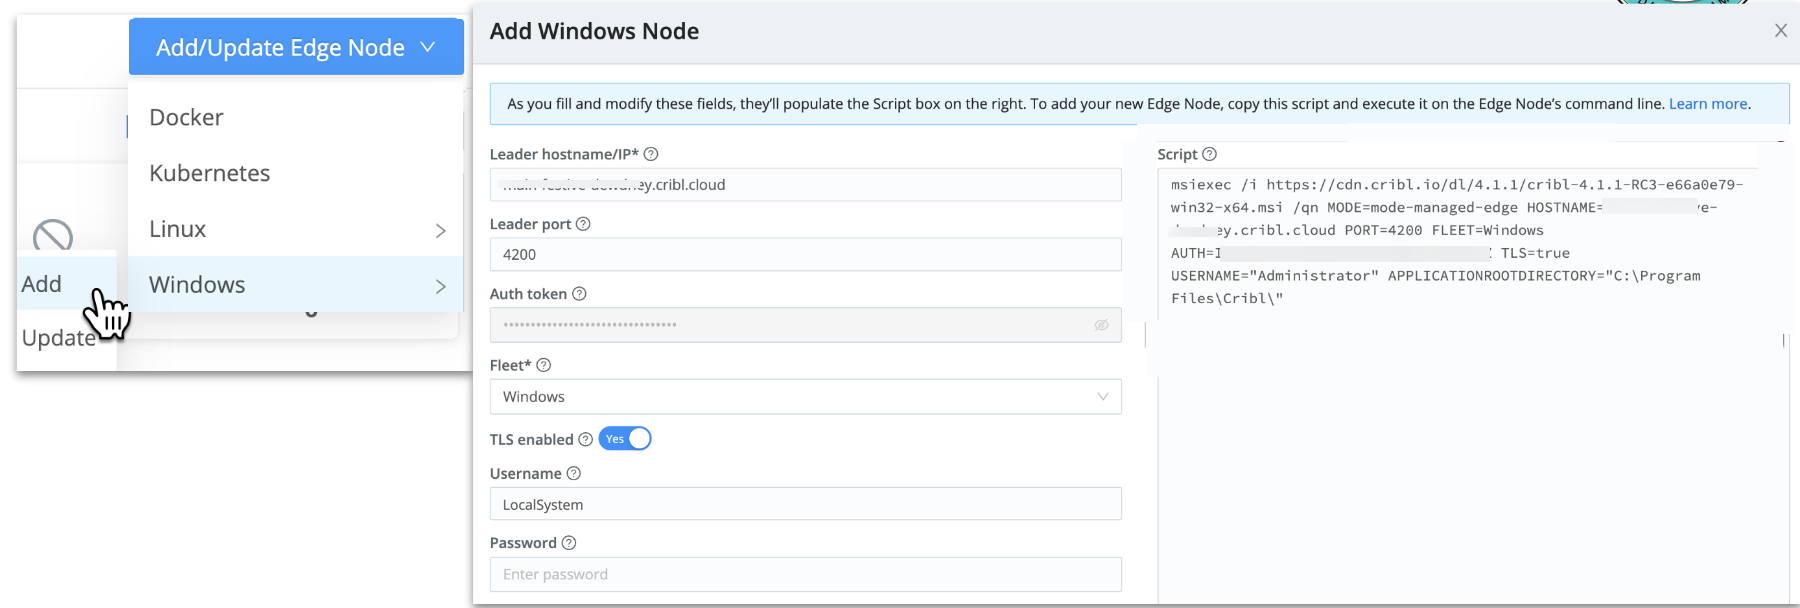
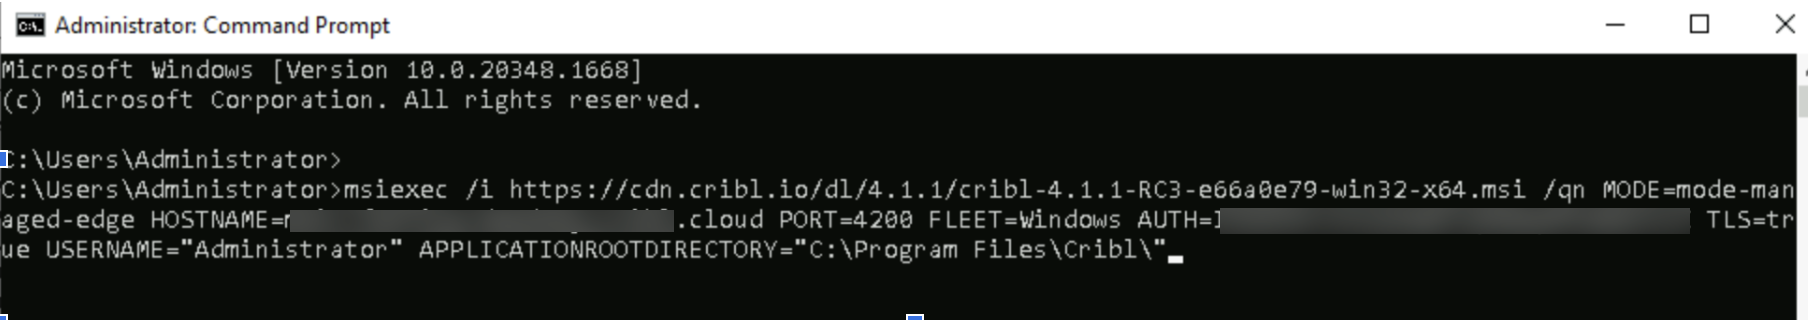
To add the Edge Node, paste the script into your Windows Command Prompt and execute it. You must run the Command Prompt as an administrator for this to work. For details, see Start Command Prompt as an Administrator.
You can edit the instance.yml files to change options like the following:
- Reassign the Edge Node to a different Fleet.
- Enable TLS after installation for prior versions of Cribl Edge. In Cribl Edge 4.1 and later, this is included in the bootstrap script when you deploy from a Cribl.Cloud Leader. For details, see Enabling TLS After Installation.
For details, see Using YAML Config File to configure an Edge Node.
Keep in mind, there were two more changes related to deployment as of Cribl Edge 4.1 (and later):
- The Edge 4.1 (and later) MSI installer uses the
CRIBL_VOLUME_DIR, so logs, configs, state, etc. are inProgramData\Criblinstead ofProgram Files\Cribl. Theinstance.ymlis located inProgramData\Cribl, too. - The Edge 4.1 (and later) MSI installer’s command-line syntax changed. So if you simply change the MSI file that it uses, and reuse the earlier installation command, you will get default settings - that is, an Edge single-instance deployment. You can find the current syntax in the Add/Update Edge Node UI.
Use a Mapping Ruleset to Switch Fleets
In this step, we will show you how to create a Mapping Ruleset to switch the Windows Edge Node to the Subfleet windows_logs you created earlier.
First, we’ll add a new rule in the existing default ruleset.
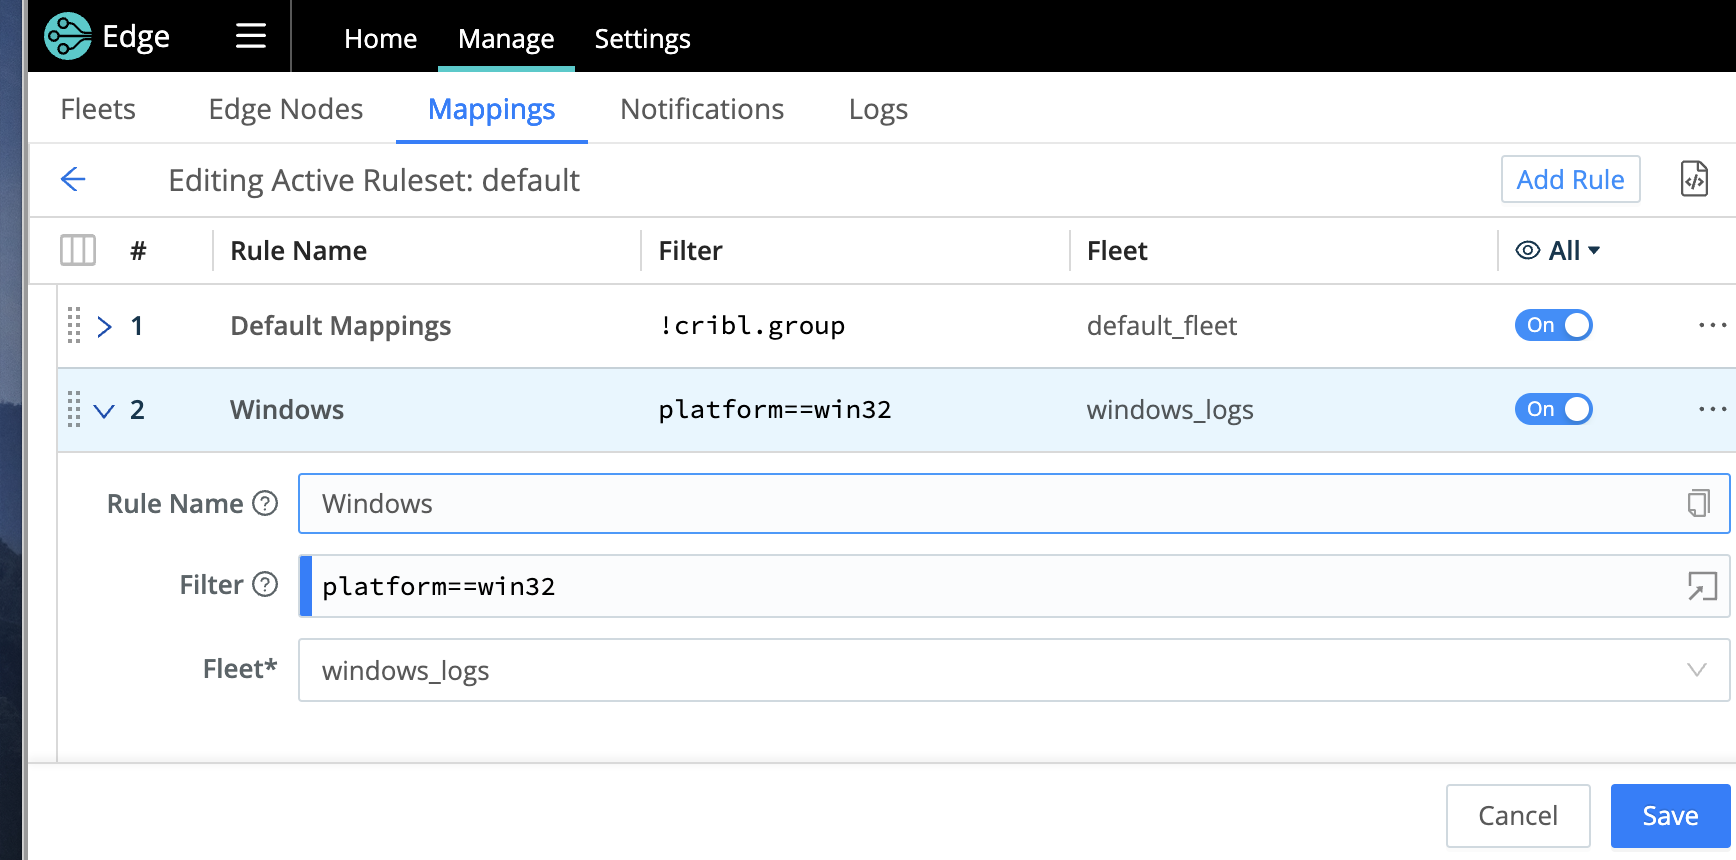
Only one Mapping Ruleset can be active at a time, although a ruleset can contain multiple rules. It’s important to keep your Fleet assignments within one ruleset. This example uses the
defaultruleset.
Make sure you reorder the rules, so the new rule is first.
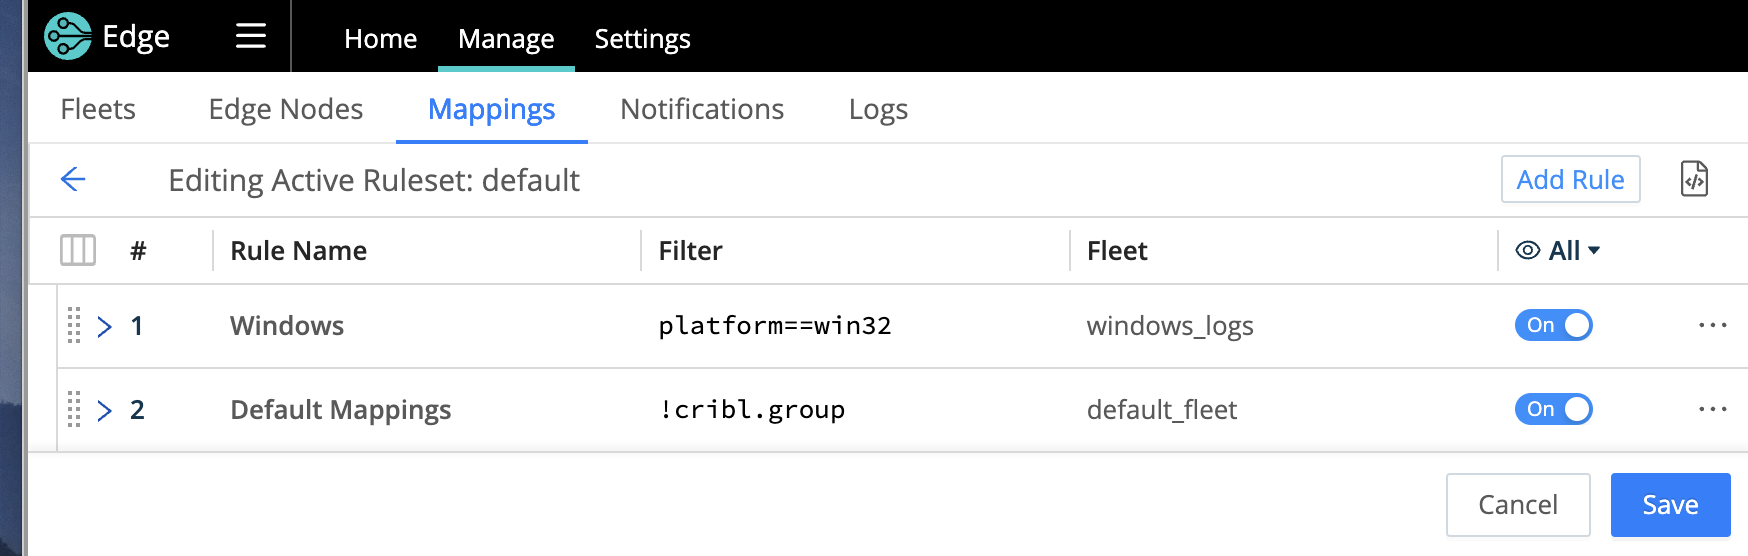
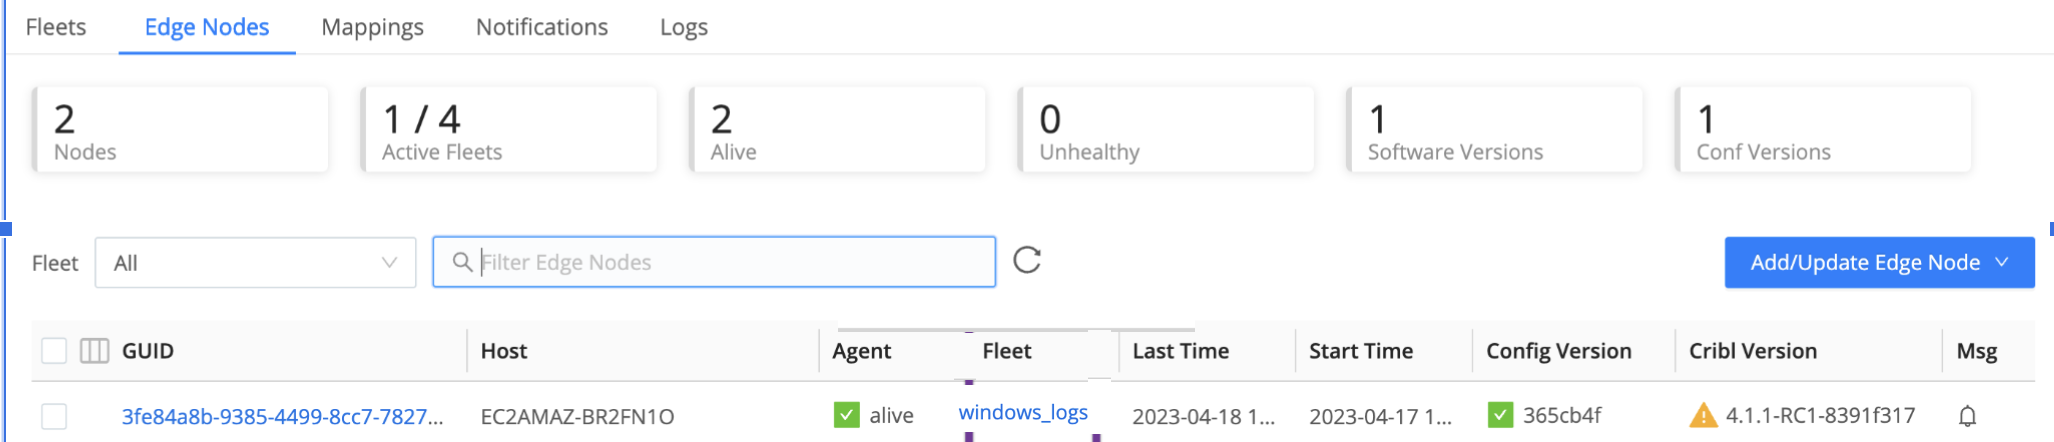
Your Windows Edge Node will now be assigned to the new SubFleet.
For details on mapping, see Mapping Edge Nodes to Fleets.
Explore Your Windows Node
When you first log in to Cribl Edge on Windows (single-instance or managed node), you’ll land on the Home tab where you can explore the metrics and log data that the Node has auto-discovered and manually discover and explore other data of interest. For details, see Exploring Cribl Edge on Windows.
From the Fleet’s Explore menu, click the System State tab to see snapshots of the host system’s current state in configurable time intervals. For details on what’s displayed, see System State.
You can specify which collectors are enabled and the polling interval, by configuring the System State Source.
Configure the Windows Event Logs Source on Cribl Edge
Next, we’ll look at how to get Windows Event Logs into Edge, and on to your chosen destination. We must first identify the logs we want, and then configure Edge’s Source to match.
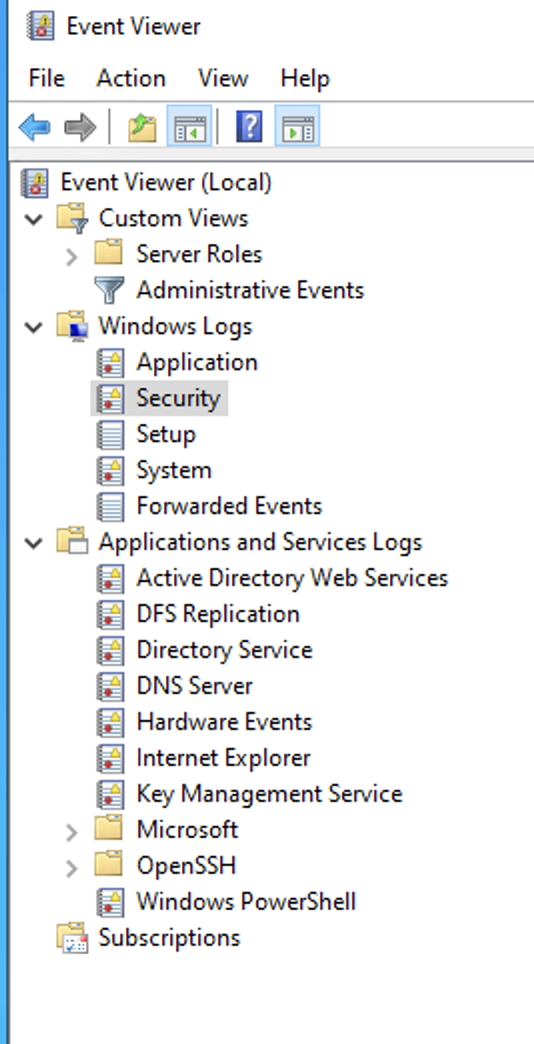
Locate Windows Event Logs in the Server
In order to configure the Windows Event Logs Source on Cribl Edge, you need to figure out which event logs you want to collect from your Windows Server.
Event logs in Windows Servers are classified into the following broad categories:
- System: Events related to the system and its components. Failure to load the boot-start driver is an example of a system-level event.
- Applications and Services: Events related to software or an application hosted on a Windows computer get logged under the application event log. For example, if a user encounters a problem in loading the app, it will be logged.
- Security: Events related to the safety of the system. The event gets recorded via the Windows auditing process. Examples include failed authentication and valid logins.
- Setup: Events occur during the installation of the Windows operating system. On domain controllers, this log will also record events related to Active Directory.
- Forwarded Events: Contains event logs forwarded from other computers in the same network.
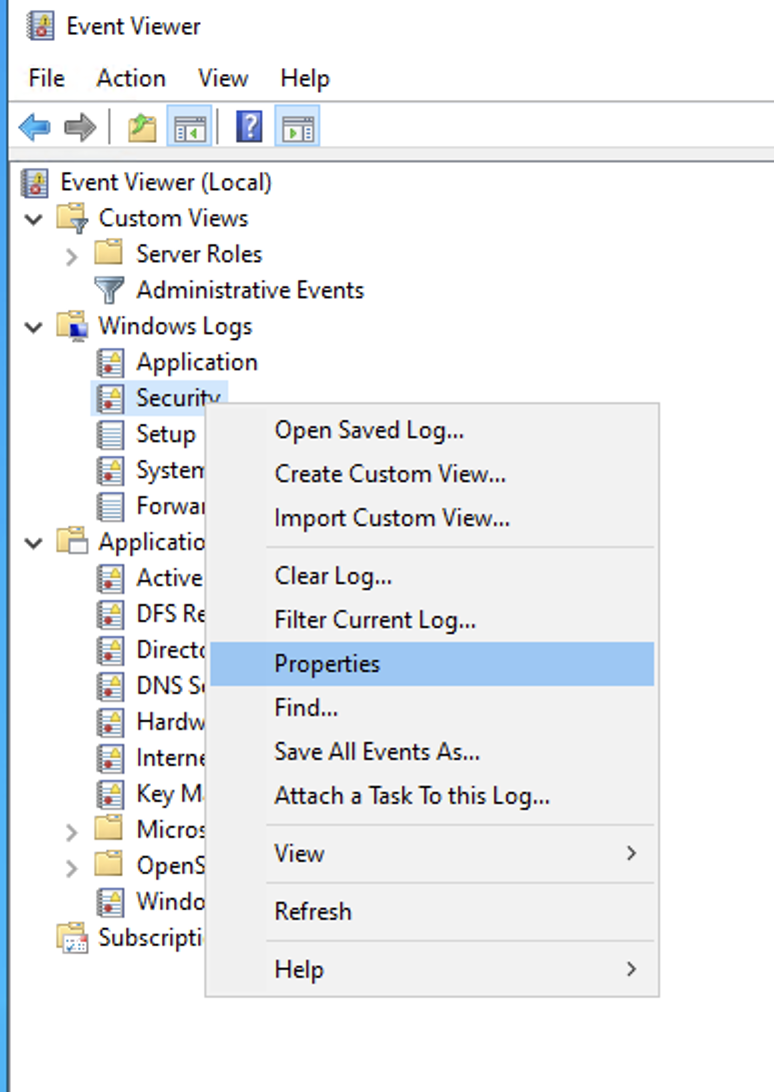
To find out what other event logs might be of interest, go to your Windows Server Event Viewer.
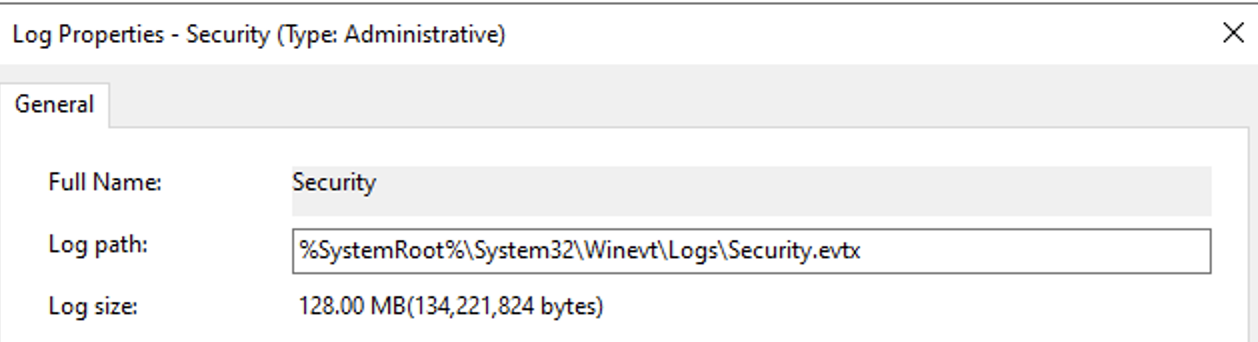
To get the accurate name of the event log, right-click and select Properties.
From the Properties modal, copy the Full Name value to your clipboard. In the next section, when you populate the Edge Windows Event Log Source’s configuration modal, you’ll paste this into that modal’s Event Logs field.
Alternatively, you can execute the following PowerShell command to list a particular log’s name. In this example, we are using a * wildcard.
powershell Get-WinEvent -ListLog Hardware*
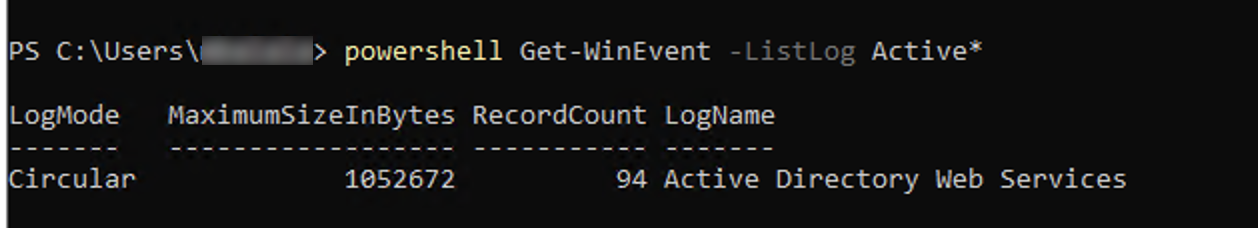
From the powershell output, the LogName field is what you would specify in the Cribl UI. In the above screenshot, for example, you would enter Active Directory Web Services in the Cribl UI.
Configure the Windows Event Logs Source
Once you have the accurate names of the event logs you want to collect, you can configure and enable the Windows Event Logs Source in Cribl Edge.
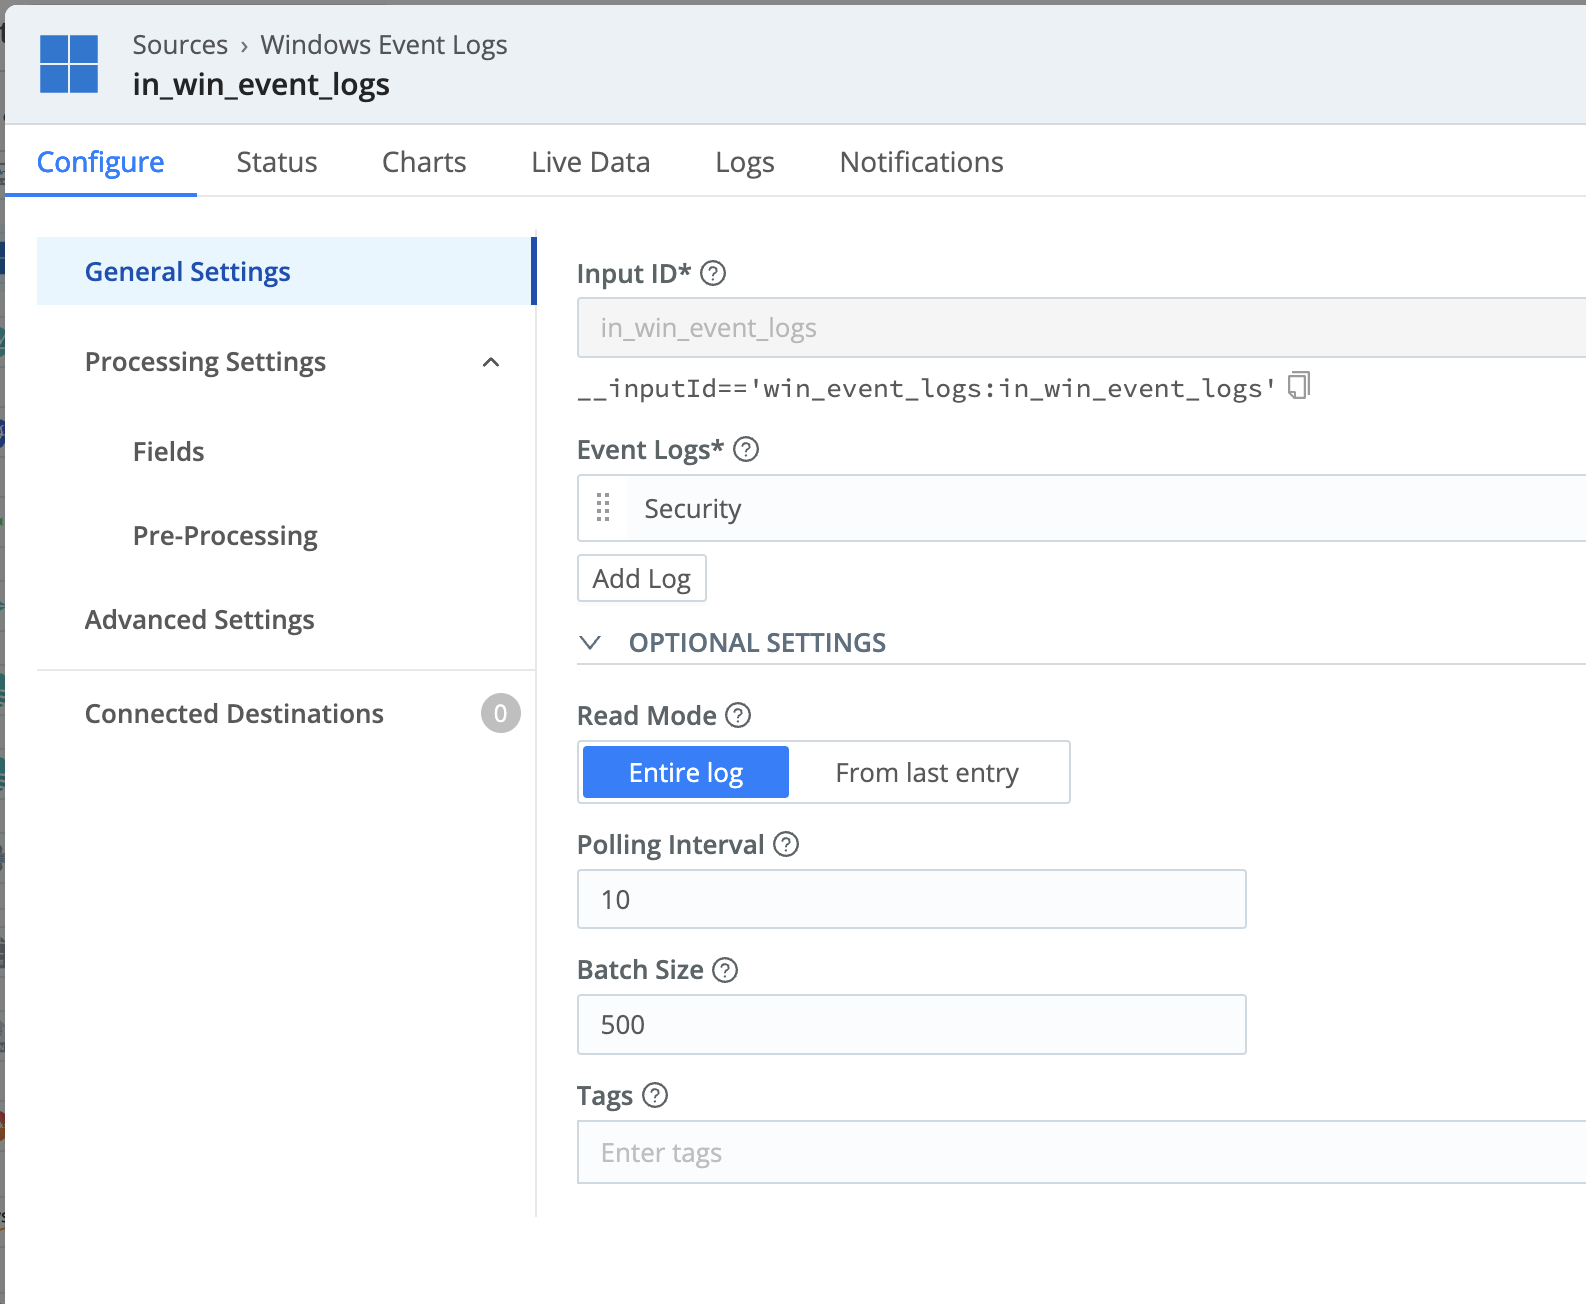
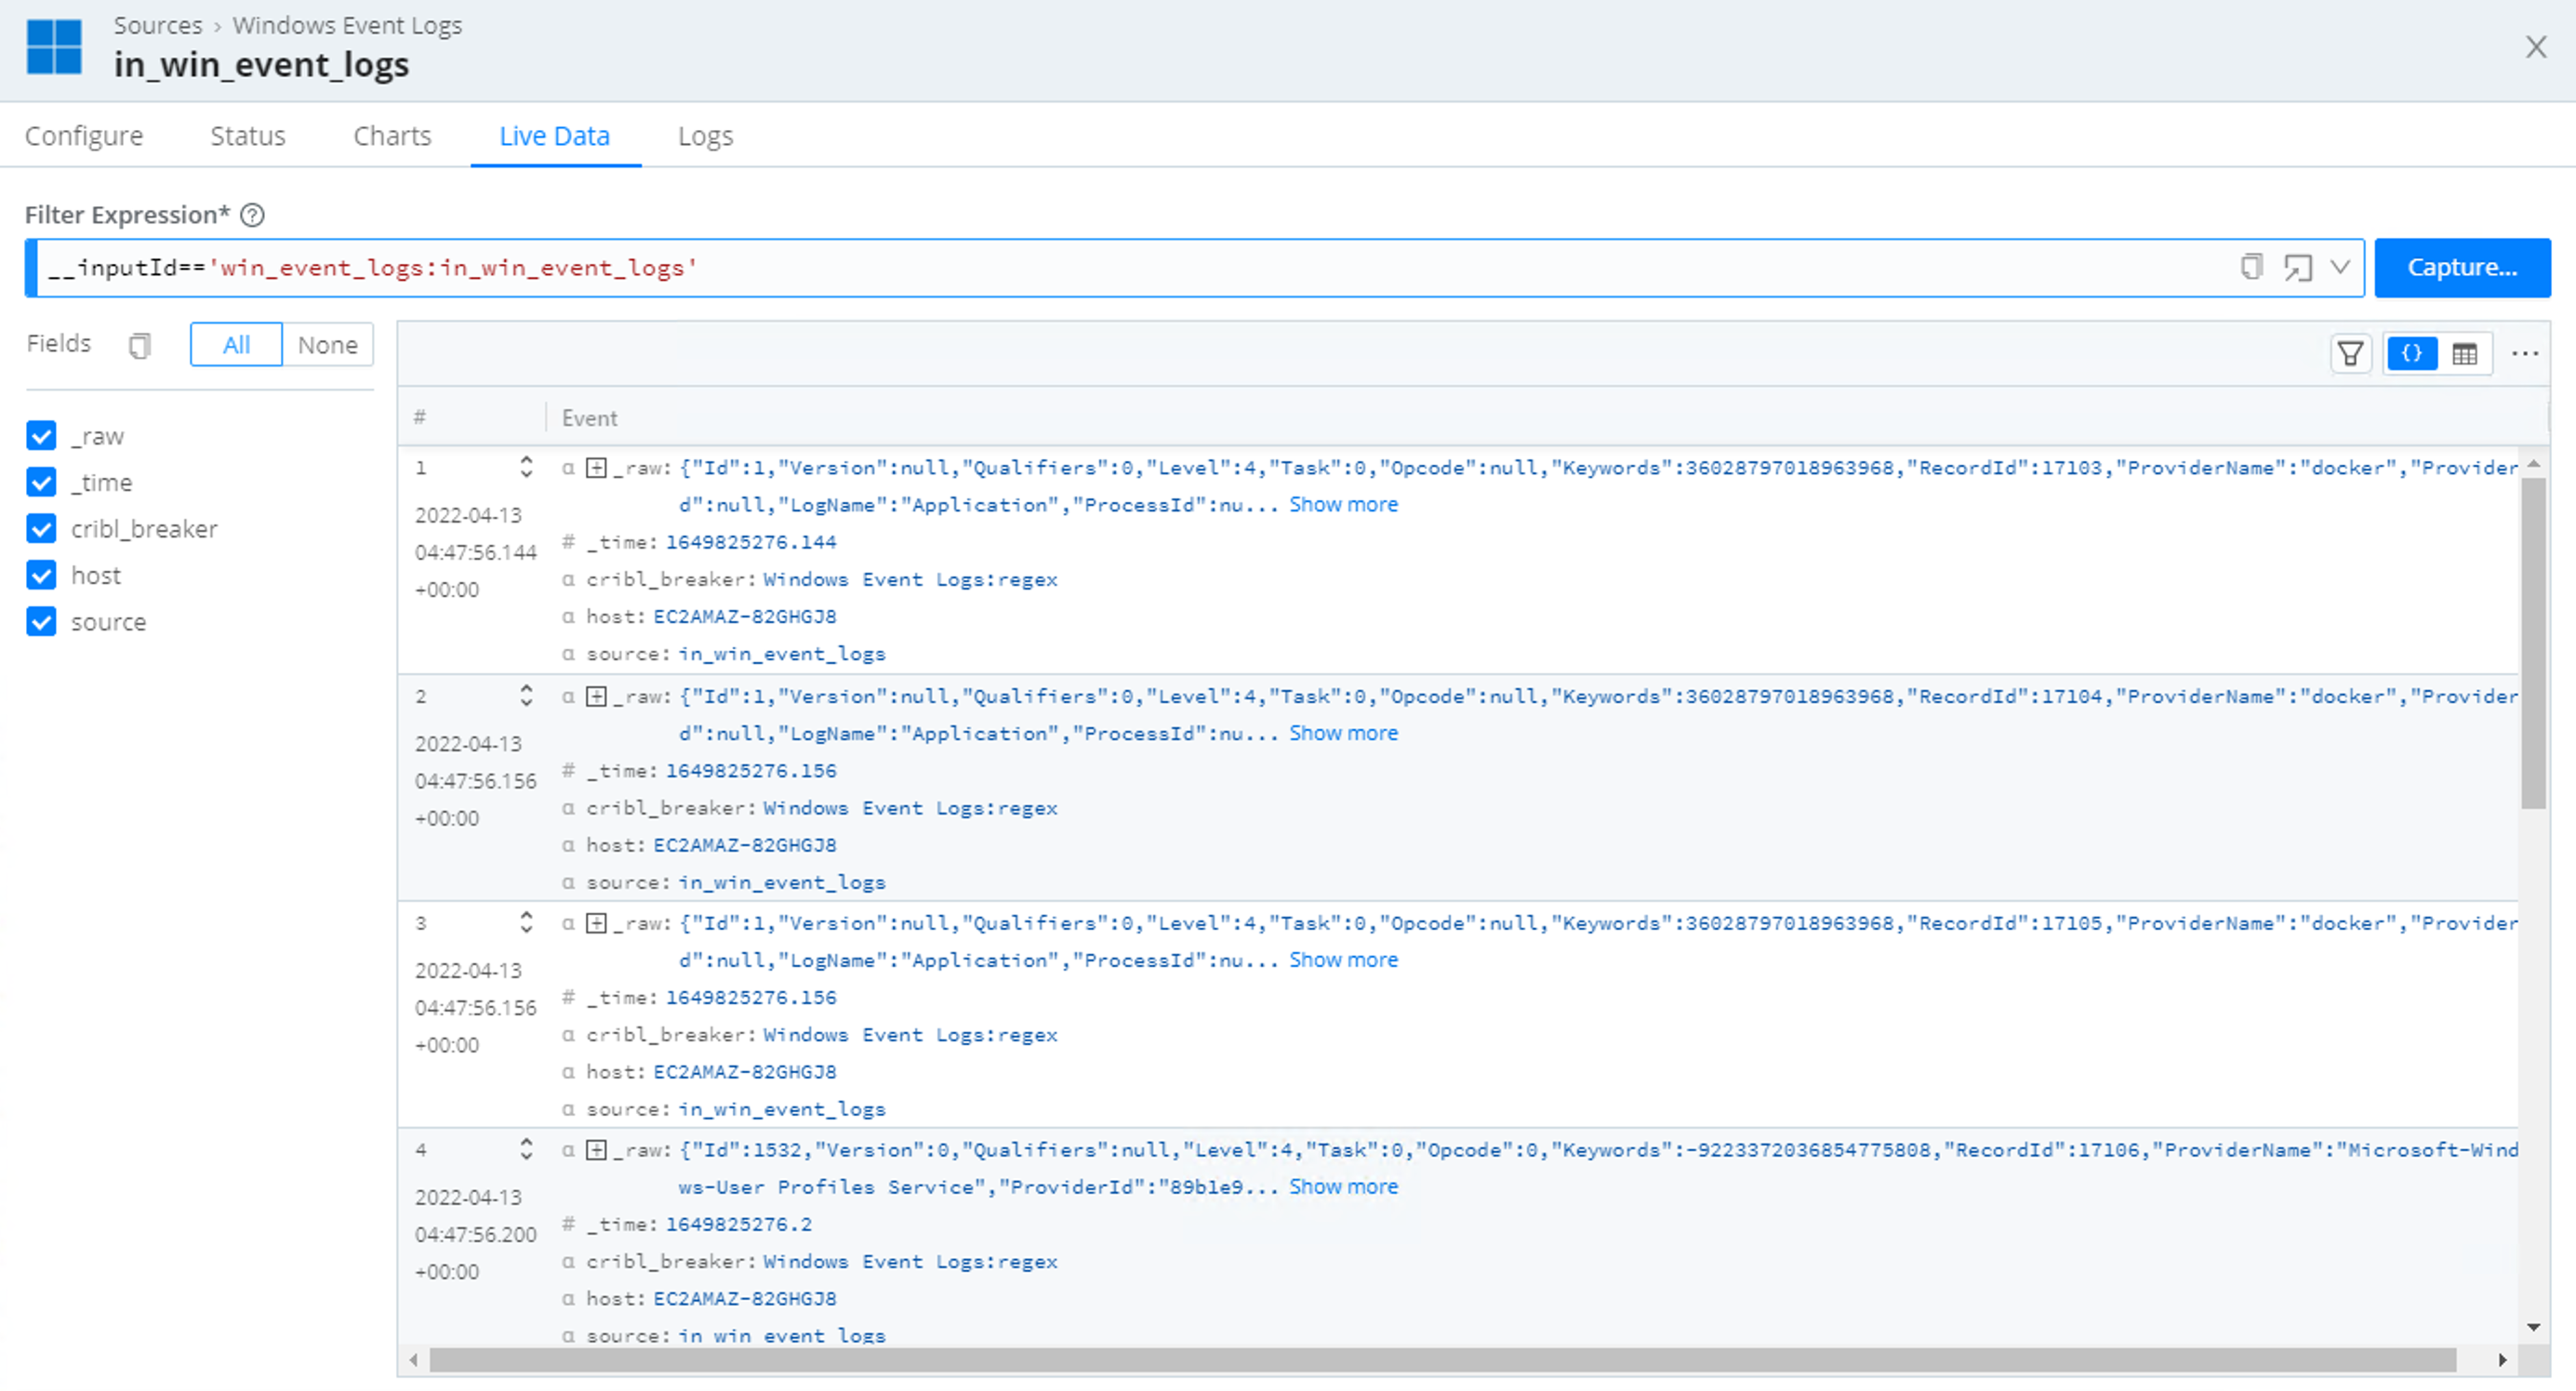
When done, Commit and Deploy your changes. Before moving on to the next step, check the Live Data tab to make sure the logs are generated.
You can now send the event logs to your visualization tool of choice or any of Cribl Edge’s supported Destinations.
Configure the Windows Metrics Source on Cribl Edge
To collect Windows metrics rather than log events, configure and enable Cribl Edge’s Windows Metrics Source.
The key requirement here is to decide on the level of granularity for the metrics you want to collect. In the Windows Metrics Source, go to the Host Metrics left tab and select its Custom button. Here, we recommend setting the following granularity options for three of the configurable types:
- CPU: Enable Per CPU metrics.
- Network: Enable Per Interface metrics.
- Disk: Enable Per Volume metrics.
On the Pre-Processing tab, select the prometheus_metrics Pipeline. This will format the metrics for export to Prometheus-compatible services like Grafana.
When done, Commit and Deploy your changes. Before moving on to the next step, check the Live Data tab to make sure the metrics are generated.
To see an example of how to connect to your Windows Metrics Source to a Grafana Cloud Destination and visualize the data in Grafana, see Monitoring your Infrastructure with Cribl Edge.
Configure the File Monitor Source on Cribl Edge
To round out this walk-through, we’ll take a quick look at enabling the File Monitor Source to gather application logs. The example configuration below monitors all files that end with variations on .log, as well as .journal files.
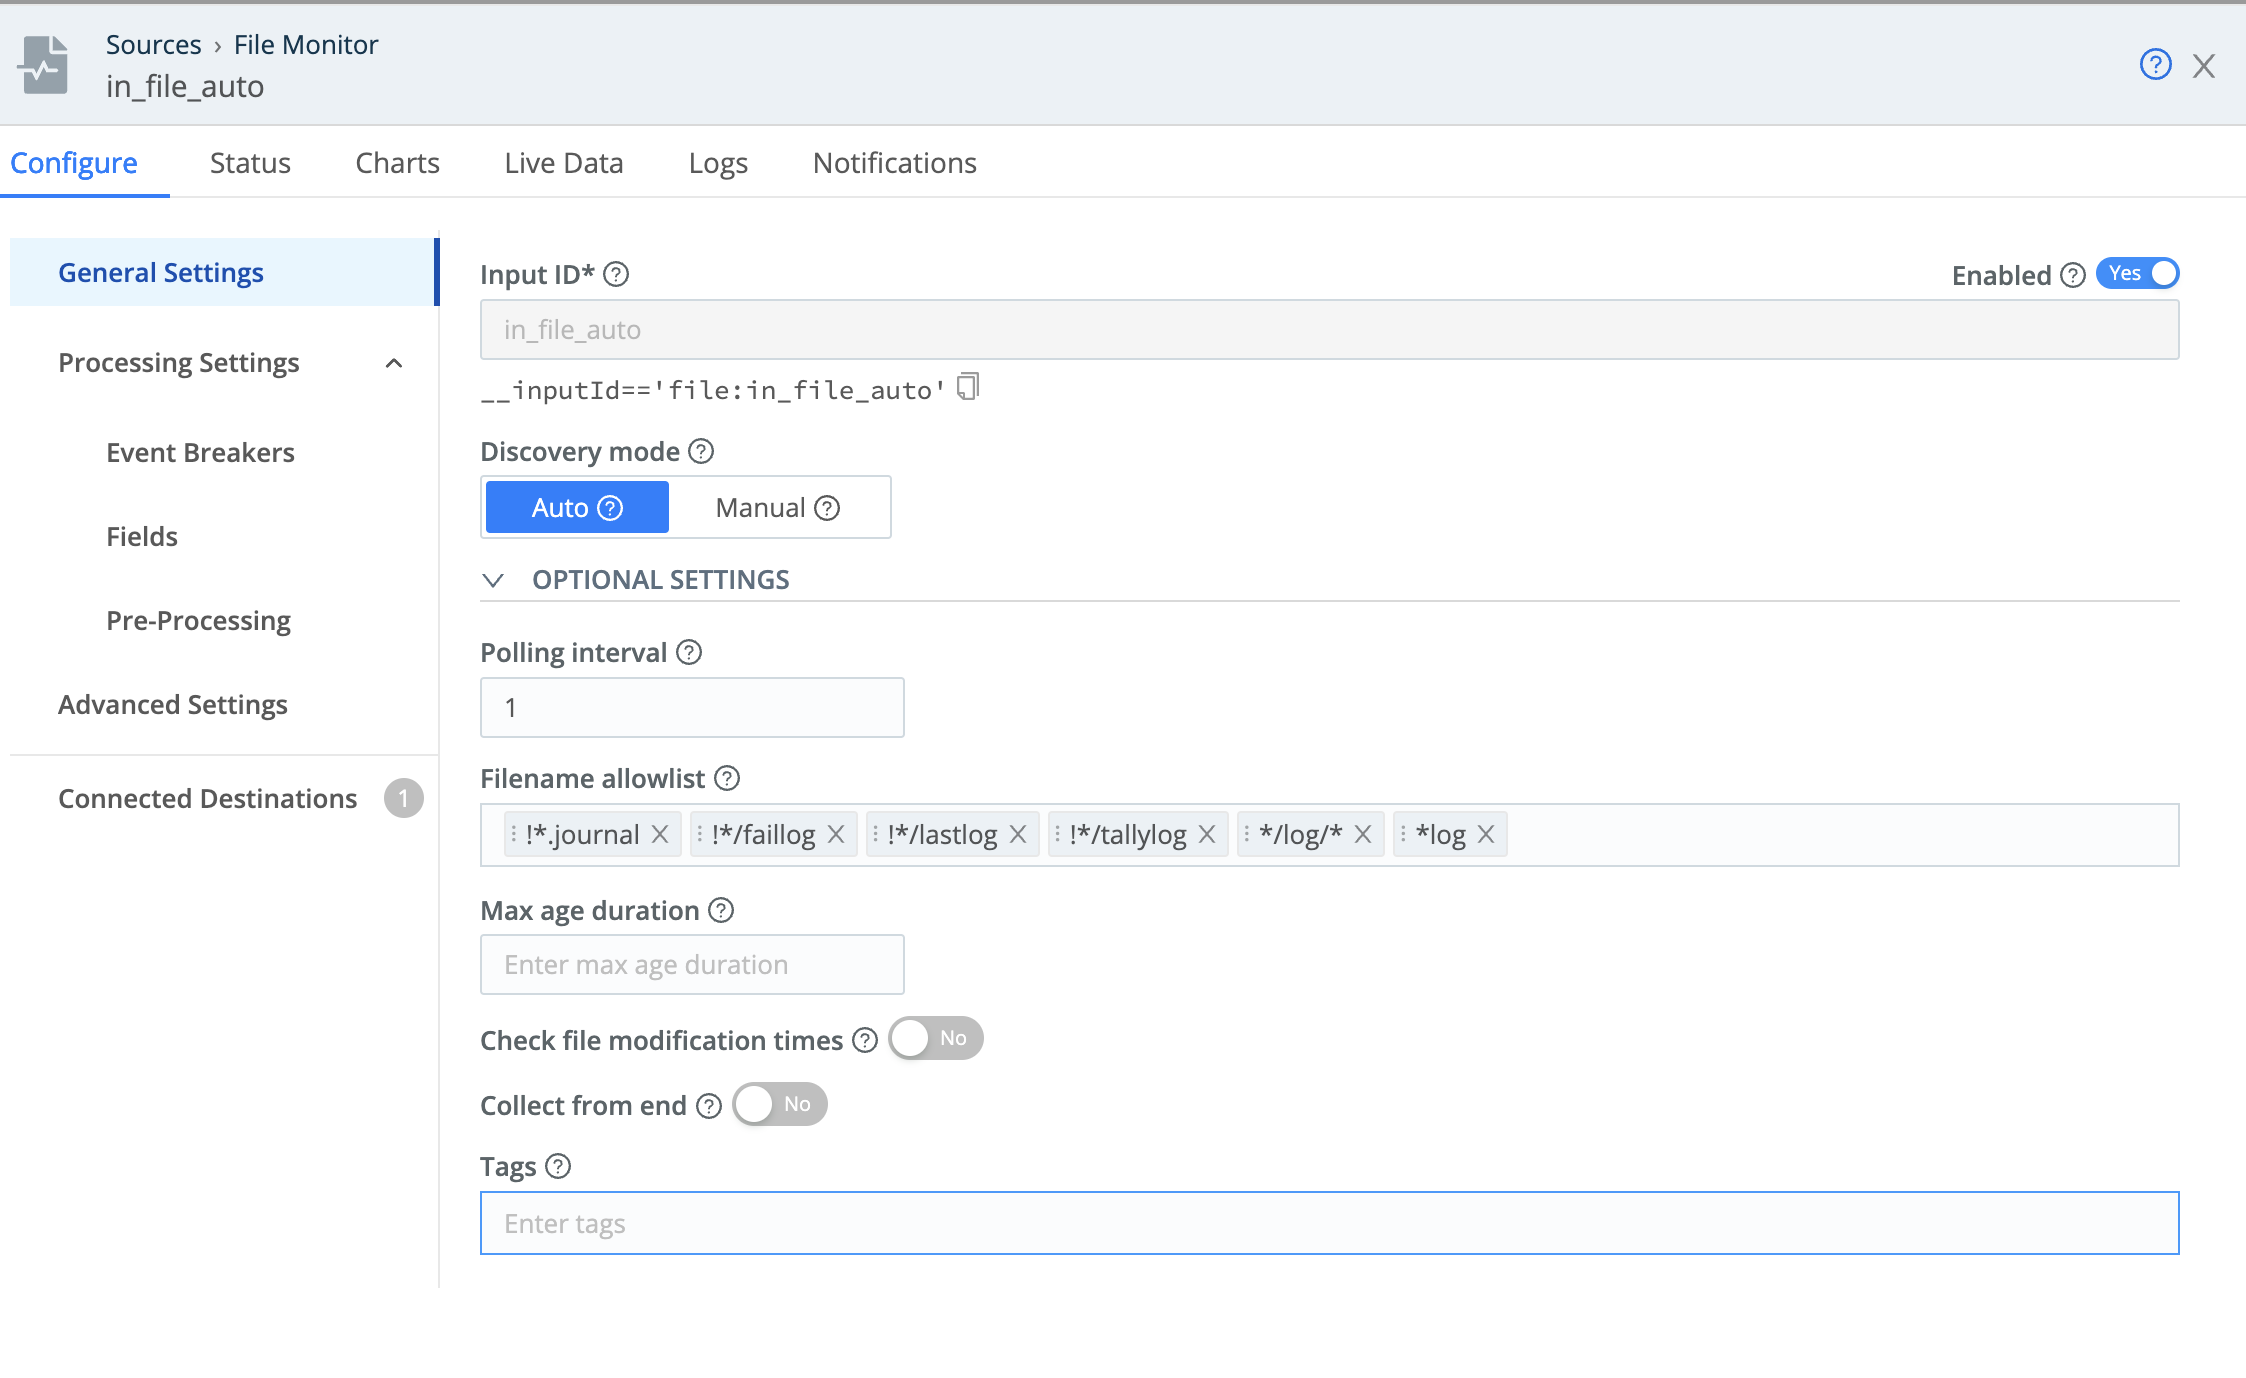
The Leader deploys with two File Monitor Sources preconfigured, respectively to operate in Auto and Manual modes. Manual mode enables you to specify a single path from which Edge will collect log files. You define this path (with no wildcards) in the Search path field shown below.
Manual mode also provides a Max depth setting where you can limit collection to a specified depth of subdirectories. To limit collection to the specified Search path only, set Max depth to 0. A value of 1 will include only the next level of subdirectories, and higher values will dig deeper.
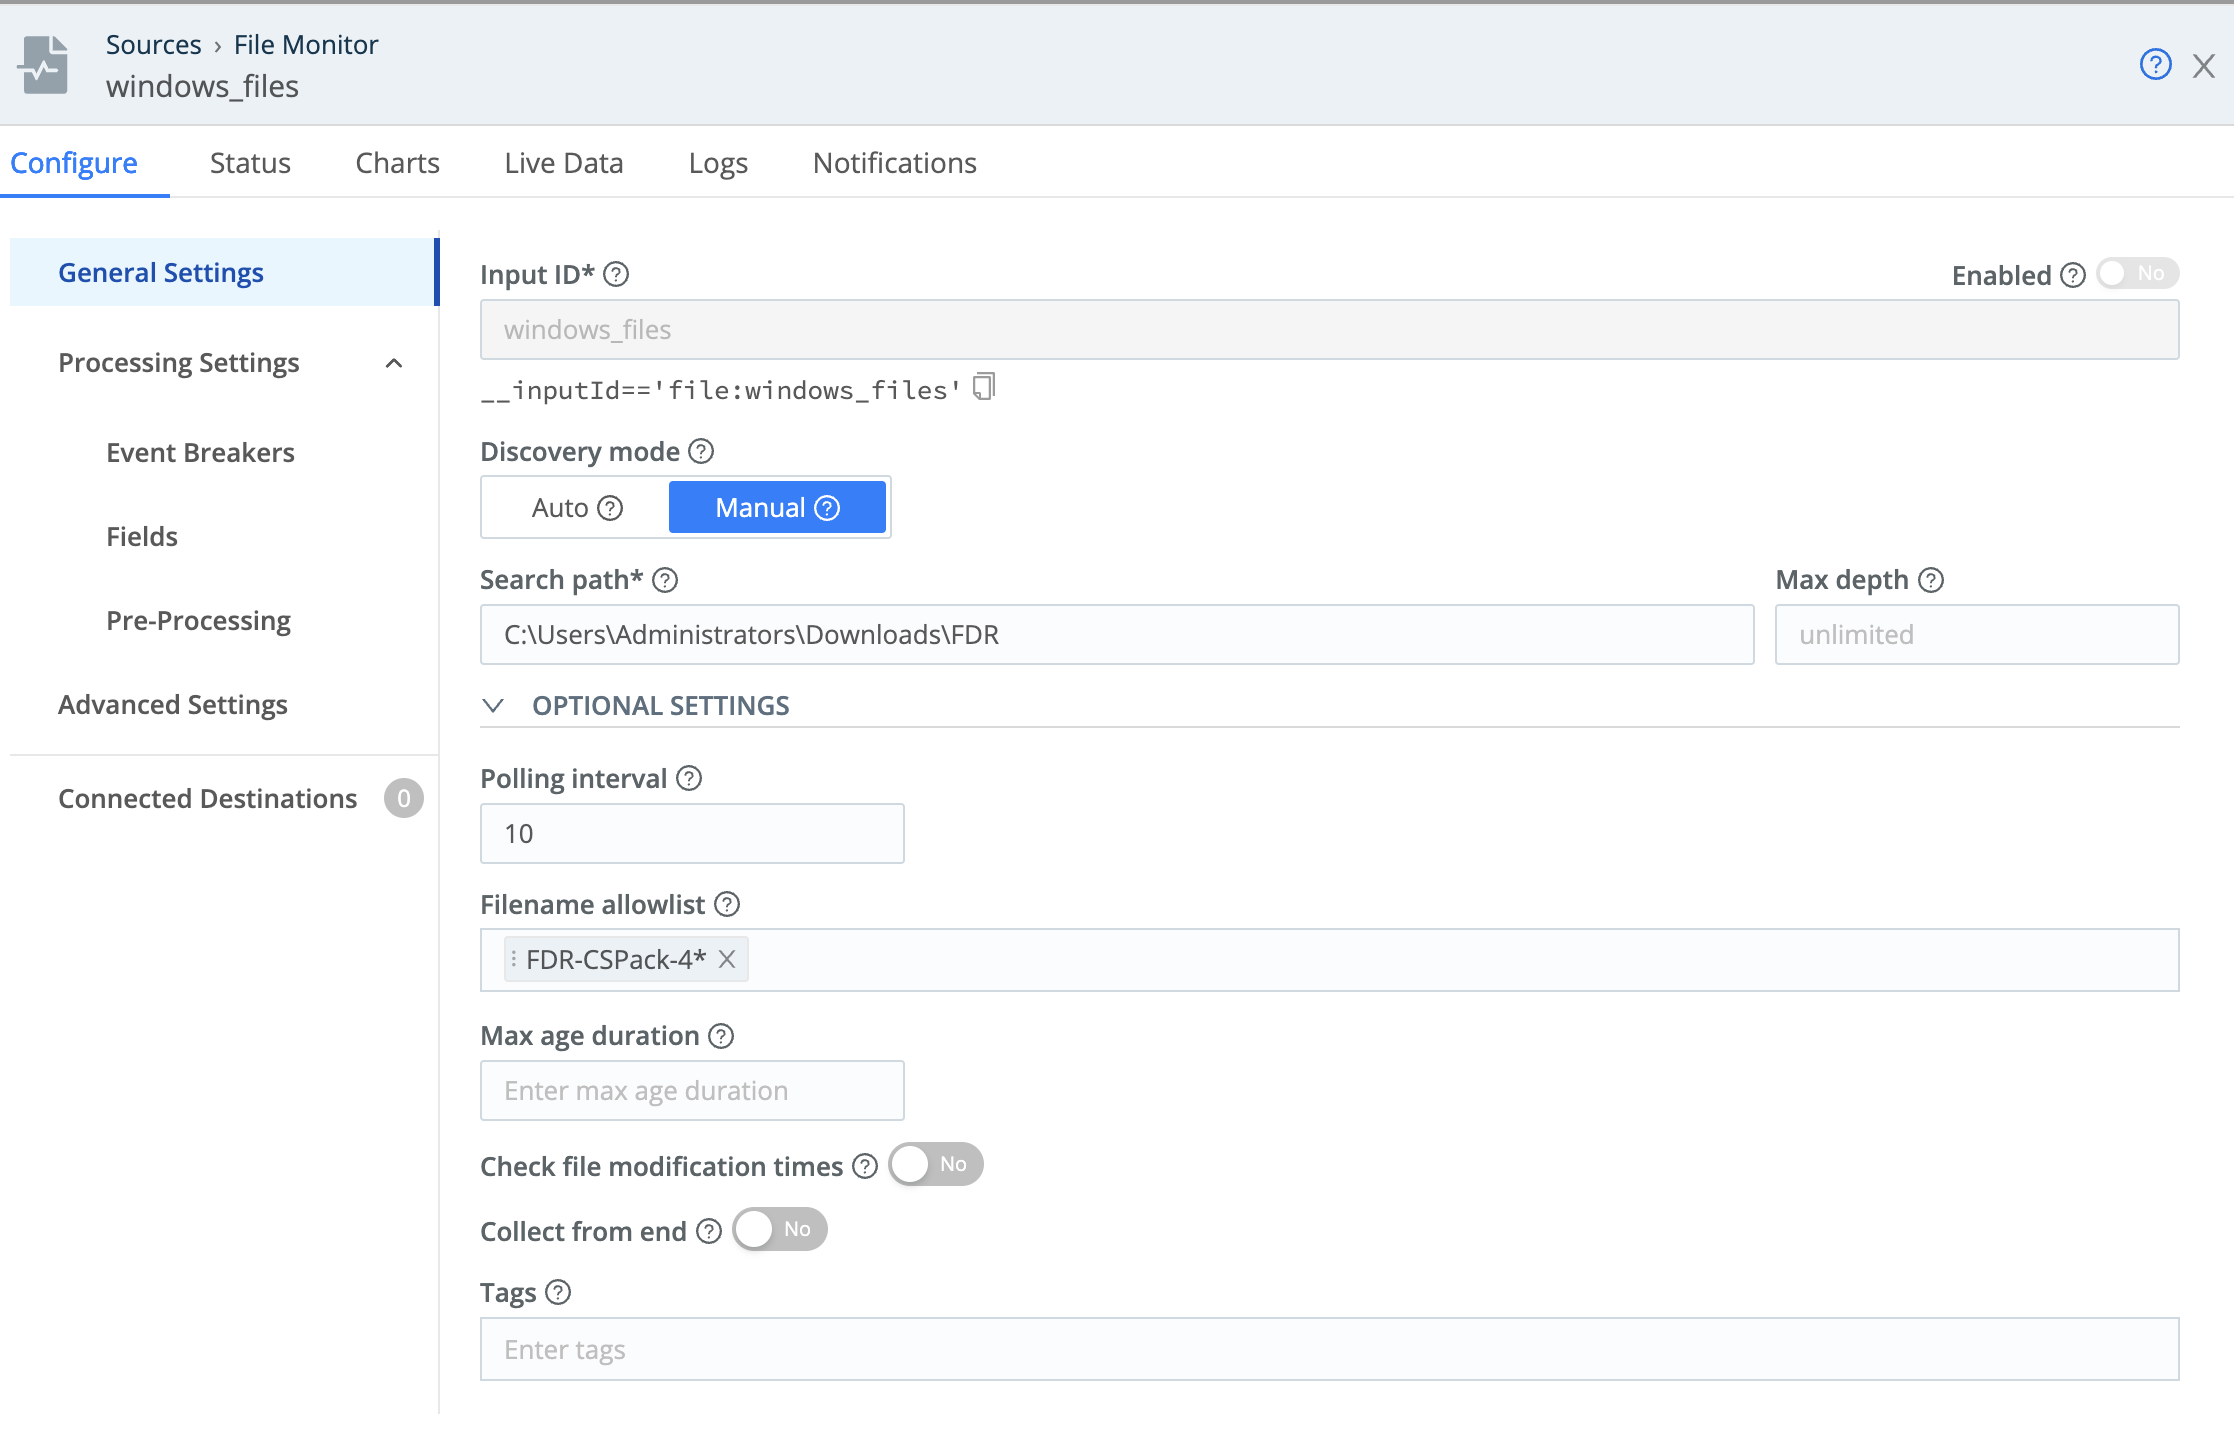
Update the Filename allowlist with the specific file to monitor; this field supports wildcards. For guidance on how to use allowlists without creating duplicates, see Using Allowlists Effectively.
Bonus Section: Executing PowerShell Commands
The Exec Source enables you to periodically execute a command and collect its stdout output. This is typically used in cases when Cribl Edge cannot accomplish collection with native Sources.
The Exec Source command is actually executed from a Windows command prompt, not from a PowerShell prompt.
The execution of PowerShell is resource-intensive and should be used with caution. On limited resource systems (e.g., domain controllers) it is best to run Exec with PowerShell carefully as the Source uses the host’s CPU.
The main thing to keep in mind when you configure Cribl’s Exec Source is that what you enter in the Command field is slightly different from a PowerShell prompt command.
| PowerShell Prompt Command | Cribl Exec Source configuration |
|---|---|
Get-Process | powershell Get-Process |
# cd c:\mydir# .\myps-script.ps1 | powershell c:\mydir\myps-script.ps1 |
You can handle a PowerShell command with parameters as follows:
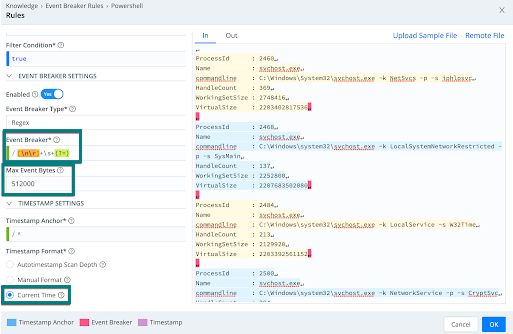
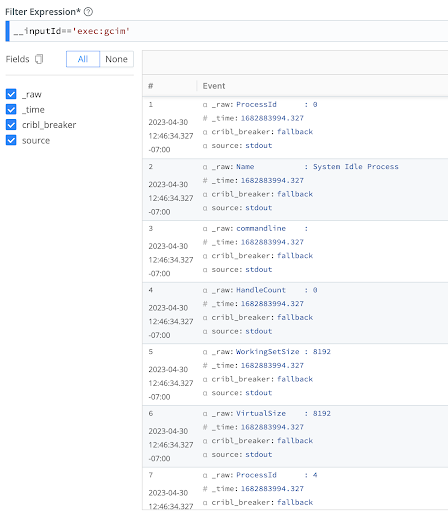
To process the PowerShell command for this script: Get-CimInstance win32_process | select ProcessId,Name, commandline,HandleCount,WorkingSetSize,VirtualSize
…enter the following into the Exec Source’s Command field:
powershell [-command] "Get-CimInstance win32_process | select ProcessId, Name, commandline, HandleCount, WorkingSetSize,VirtualSize"
(Include the -command parameter if your PowerShell version requires it.)

The output of the command without using an Event Breaker:
The output of the command with an Event Breaker: