


These docs are for Cribl Edge 4.10 and are no longer actively maintained.
See the latest version (4.17).
Sources
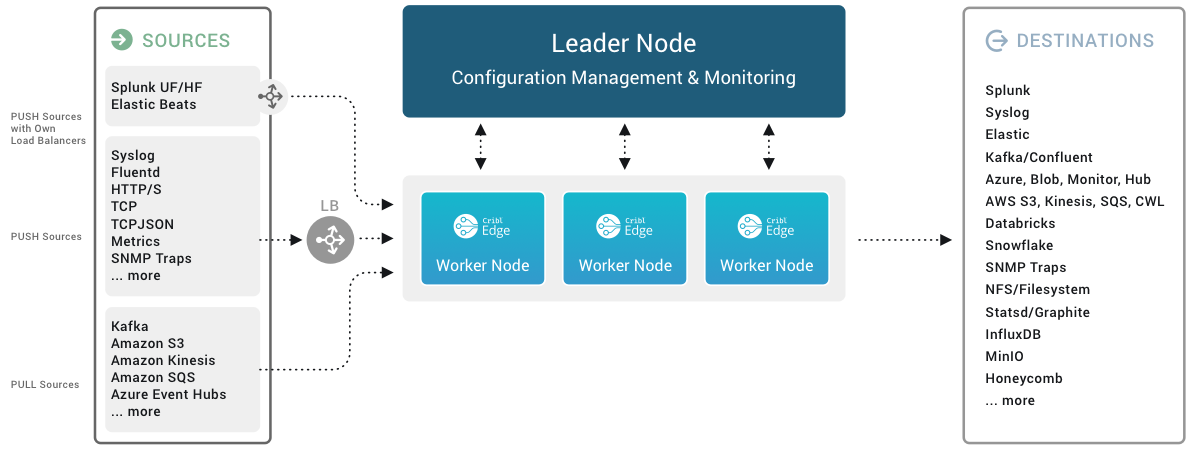
Each Cribl Edge Source is a configuration that enables Edge nodes to collect or receive observability data - logs, metrics, application data, and so on - in real time. Edge can receive continuous data input from Splunk, HTTP senders, Elastic Beats, Prometheus, TCP JSON, and many others. Sources can receive data from either IPv4 or IPv6 addresses.
Cribl Edge offers a configuration modal for each type of supported Source. However, you can add multiple instances of each Source type - with each configured to match the parameters of the corresponding sender. For example, you can have multiple File Monitors and multiple listeners for Syslog, Splunk, Elastic Beats, Prometheus, TCP JSON, and many others.
System and Internal Sources
Sources that generate data locally at the Edge Node, monitor resources, or move data among Edge Nodes and/or Stream Workers within your Cribl deployment.
- AppScope
- Cribl Internal
- Cribl HTTP
- Cribl TCP
- Datagen
- Exec
- File Monitor
- Journal Files
- Kubernetes Events
- Kubernetes Logs
- Kubernetes Metrics
- System Metrics
- System State
- Prometheus Edge Scraper
- Windows Event Logs
- Windows Metrics
Push Sources
Supported data Sources that send to Cribl Edge.
- Amazon Data Firehose
- Datadog Agent
- Elasticsearch API
- Grafana
- HTTP/S (Bulk API)
- Loki
- Metrics
- Model Driven Telemetry
- Netflow & IPFIX
- Raw HTTP/S
- OpenTelemetry (OTel)
- Prometheus Remote Write
- SNMP Trap
- Splunk HEC
- Splunk TCP
- Syslog
- TCP JSON
- TCP (Raw)
- UDP (Raw)
- Windows Event Forwarder
- Zscaler Cloud NSS
Pull Sources
Cribl Edge does not contain any Sources categorized as Pull. The contents of the Pull tab will be blank.
Configuring and Managing Sources
For each Source type, you can create multiple definitions, depending on your requirements.
To configure Sources, from the top nav, click Manage, then select a Fleet to configure. Then, you have two options:
To access the graphical QuickConnect UI, click Collect. Next, click either Add New or (if displayed) Select Existing.
To access the Routing UI, click More > Sources. On the resulting Data Sources page’s tiles or left menu, select the desired type, then click Add New.
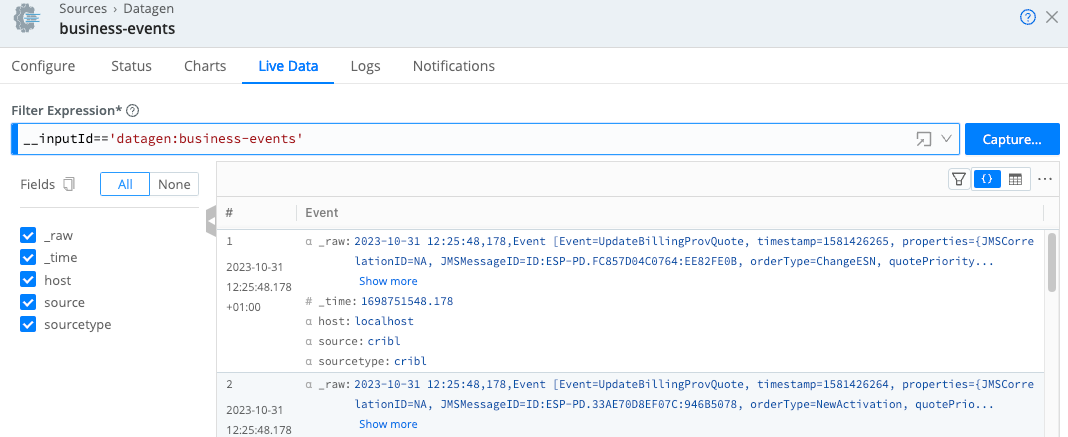
Capturing Source Data
To capture data from a single enabled Source, you can bypass the Preview pane, and instead capture directly from a Manage Sources page. Just click the Live button beside the Source you want to capture.
In order to capture live data, you must have Edge Nodes registered to the Fleet for which you’re viewing events. You can view registered Edge Nodes from the Status tab in the Source.

You can also start an immediate capture from within an enabled Source’s configuration modal, by clicking the modal’s Live Data tab.
Monitoring Source Status
You can get a quick overview of Source health status by referring to their status icons.
Additionally, each Source’s configuration modal offers two tabs for monitoring: Status and Charts.
Source Status Icons
Source status icons are available on the Data > Destinations page and for each individual Source in the list for a specific Source type.
The icons have the following meanings:
| Icon | Meaning |
|---|---|
| Healthy. Operating correctly. | |
| Warning. Experiencing issues.The Source is not functioning fully. Specific conditions will depend on the Source type. | |
| Critical. Experiencing critical issues.Drill down to the Source’s Status tab to find out the details. | |
| Disabled.The Source is configured, but not enabled. | |
| No health metrics available.This may mean that a Source is enabled, but has not been deployed yet. | |
Inactive. When using GitOps, a Source appears Inactive if its Environment field (configured under Advanced Settings) does not match the currently active environment determined by the deployed Git branch. This ensures integrations only activate in their designated environments, preventing unintended data flow or misconfiguration. |
Status Tab
The Status tab provides details about the Edge Nodes in the Fleet and their status. An icon next to each Edge Node uses color to clearly signal its health:
- : All systems go! Your Edge Node is operating normally.
- : Attention needed. There’s a potential issue with this Edge Node.
- : Stop! This Edge Node has encountered a critical error.
The way you view Edge Node statuses depends on the size of your Fleet:
Fewer than 1000 Edge Nodes: All Edge Nodes are conveniently displayed on the Status tab, along with their statuses. Use the Status checkboxes at the top to filter the list by health (healthy, warning, error).
Clicking on any Edge Node row dives deeper, providing specific details to help diagnose issues. The specific set of information provided depends on the Source type. Keep in mind that this data only reflects process
0for each Edge Node.More than 1000 Edge Nodes: With a larger Fleet, you can select a specific Edge Node from the drop-down menu (showing up to 100 Nodes). You can search by
hostnameorGUIDto find a specific Node. You can also use the Status checkboxes to filter which Edge Nodes appear in the drop-down list.
The content of the Status tab is loaded live when you open it and only displayed when all the data is ready. With a lot of busy Edge Nodes in a group, or nodes located far from the Leader, there may be a delay before you see any information.
The statistics presented are reset when the Edge Node restarts.
Charts Tab
The Charts tab presents a visualization of the most recent 10 minutes of activity on the Source. The following data is available:
- Total events in
- Average throughput (events per second)
- Total bytes in
- Average throughput (bytes per second)
This data (in contrast with the status tab) is read almost instantly and does not reset when restarting an Edge Node.
Preconfigured Sources
To accelerate your setup, Cribl Edge ships with several common Sources configured but not switched on. Open, clone (if desired), modify, and enable any of these preconfigured Sources to get started quickly.
On a Cribl.Cloud deployment, do not delete any preconfigured Sources. If you don’t plan to use them, keep them disabled.
- System Metrics - Basic Level
- File Monitor > in_file_auto - Auto Discovery Mode
- File Monitor > in_file_varlog - Manual Discovery Mode
- AppScope > in_appscope - Unix Domain Socket listener
- Cribl Internal > CriblLogs - Internal
- Cribl Internal > CriblMetrics - Internal