


These docs are for Cribl Edge 4.11 and are no longer actively maintained.
See the latest version (4.17).
Explore Cribl Edge Fleets
Learn how to access your Fleets in Cribl Edge
The Fleets page is available on certain plan/license tiers. For details, see Pricing.
Access the Fleets Page
In Cribl Edge, select Fleets from the sidebar. This view shows all of the Fleets and Subfleets you have access to in the instance or Organization.
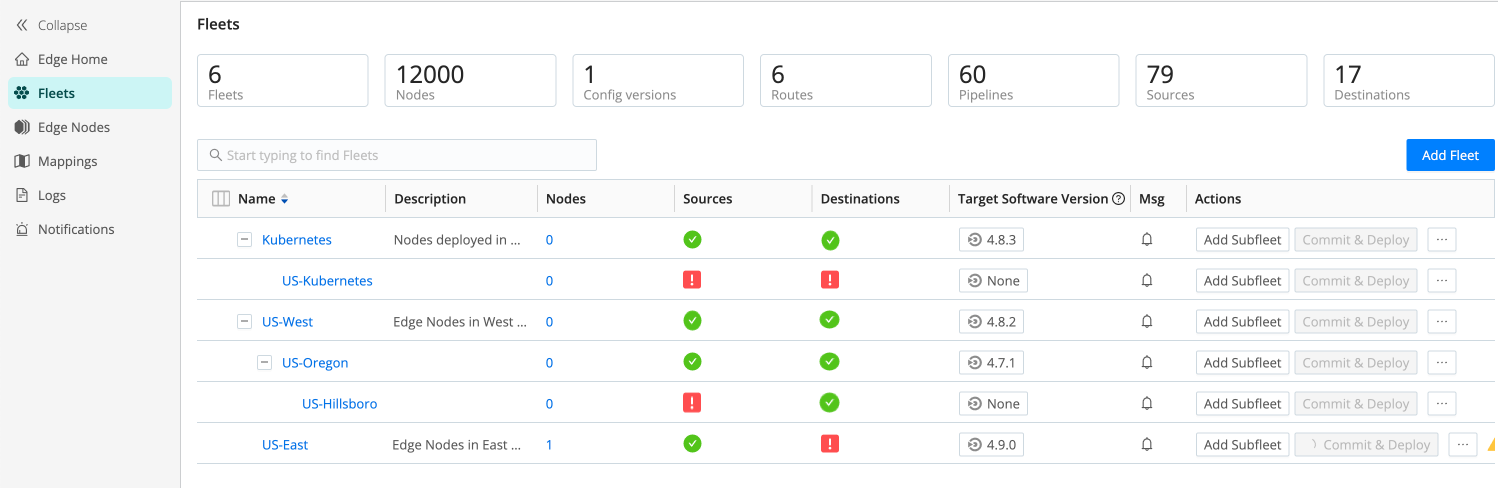
To explore more information for each of your configured Fleets, select a Fleet Name to open it.
View Edge Nodes in a Fleet
When you open a Fleet, you’ll land on the Nodes page, in List View.
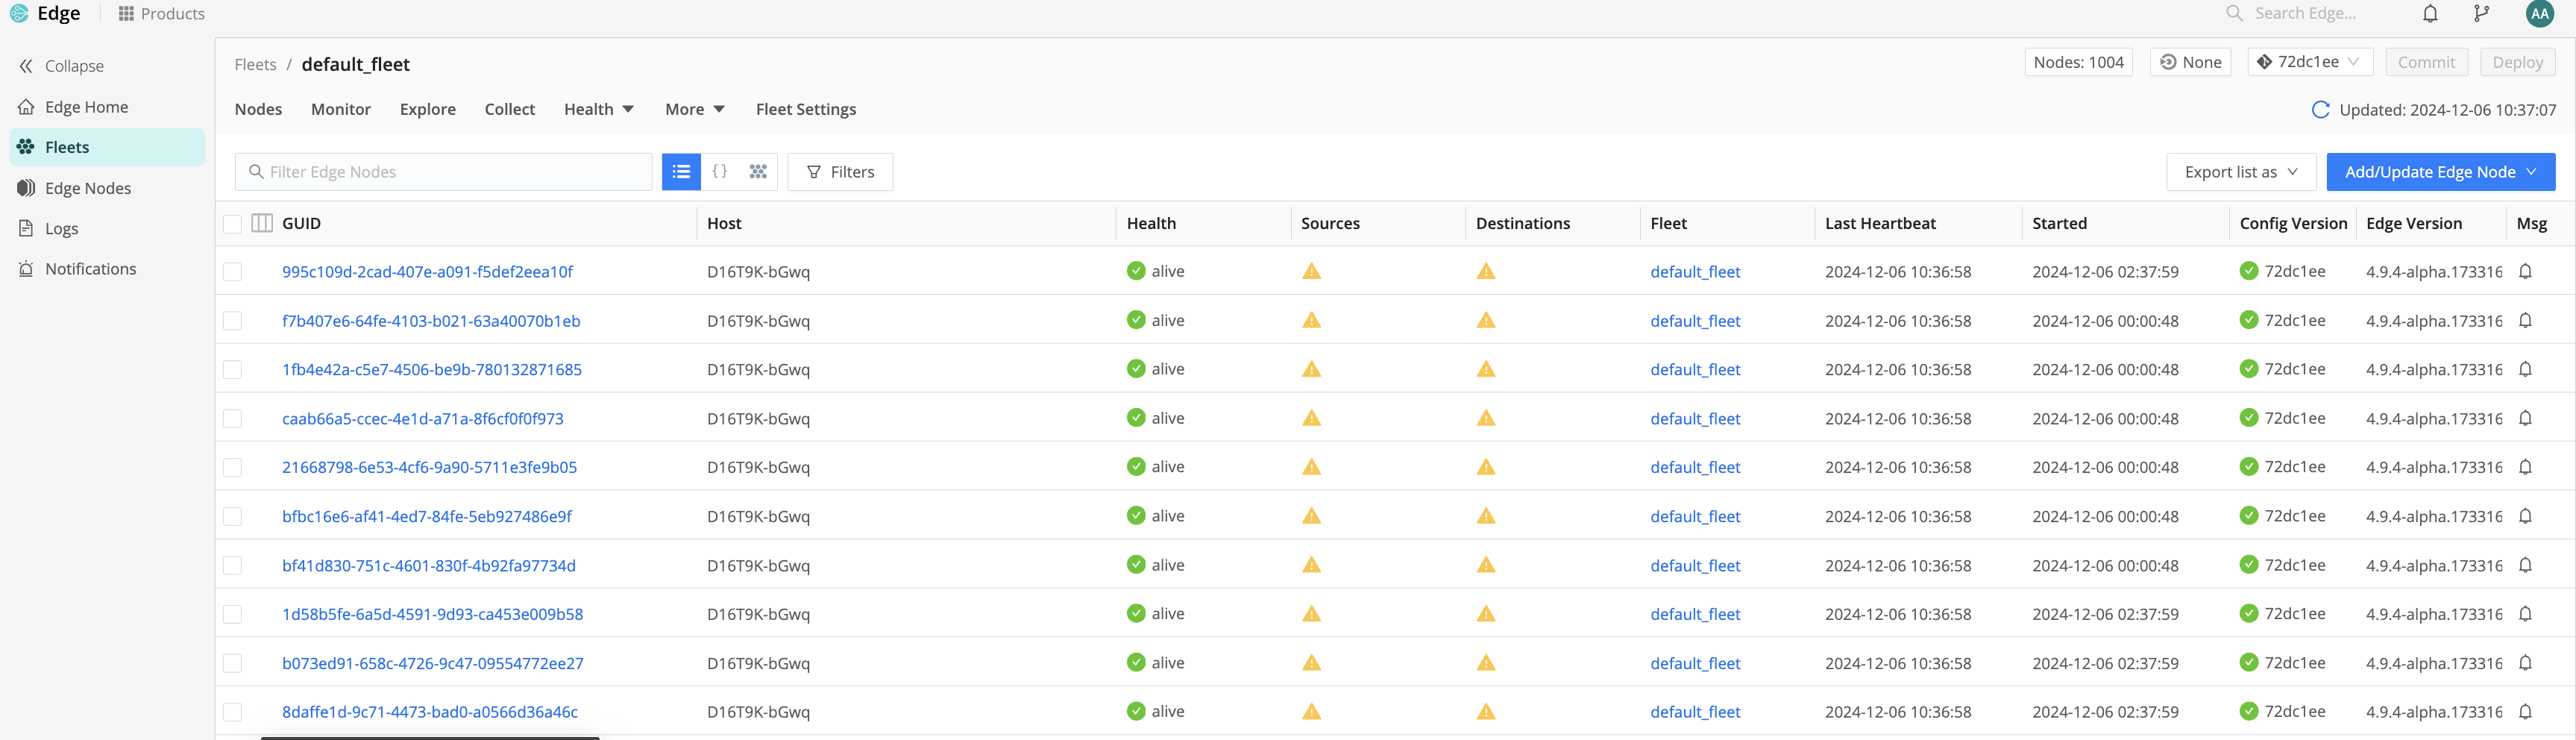
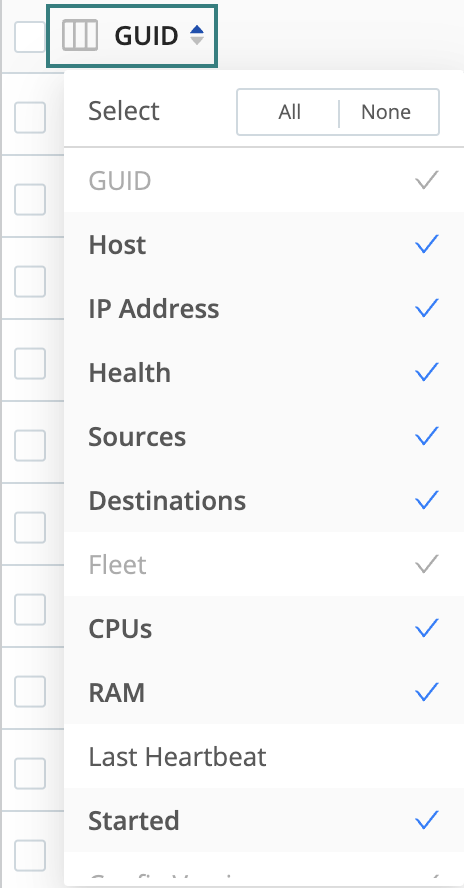
You can use the column selector to show and hide columns in this view. Select the column icon next to GUID.
A few highlights on some of the options:
| Field | Description |
|---|---|
| Health column | This column displays an icon indicating the overall health of the Edge Node. |
| Sources | Shows the individual health statuses of the Edge Node’s Sources. You can sort and filter these Sources by their health status, which helps you quickly identify Nodes that are experiencing issues with a Source. |
| Destinations | Shows the individual health statuses of the Edge Node’s Destinations. You can sort and filter these Destinations by their health status, which helps you quickly identify Nodes that are experiencing issues with a Destination. |
| Edge Version | Displays a status icon next to the version number. This icon can provide information about the upgrade status for a Node. For more information on upgrade status, read View the Status of Fleet Upgrades. |
| CPU | Shows the CPU utilization for the Edge Node. Use the column selector icon to reveal this option. |
| RAM | Displays the memory usage of the Edge Node. Use the column selector icon to reveal this option. |
The Edge Nodes list also serves as the “transporter room,” allowing you to teleport into each of the Node’s interfaces.
Understand the Health Status Icons
The Source and Destination health icons represent the following statuses:
 Green checkmark: Everything is good! All Sources and Destinations are healthy.
 Yellow warning icon: Attention needed. One or more Sources or Destinations are in a warning state.
 Red exclamation point: Critical issue! One or more Sources or Destinations have encountered an error.
 Indeterminate: No data available yet for Sources or Destinations.
Ways to View Nodes
To switch between the three Edge Node views, select the List View
![]() icon, JSON View
icon, JSON View
![]() icon, or Map View
icon, or Map View
![]() icon.
icon.
List View: A list of all the Nodes and their statuses in the Fleet.
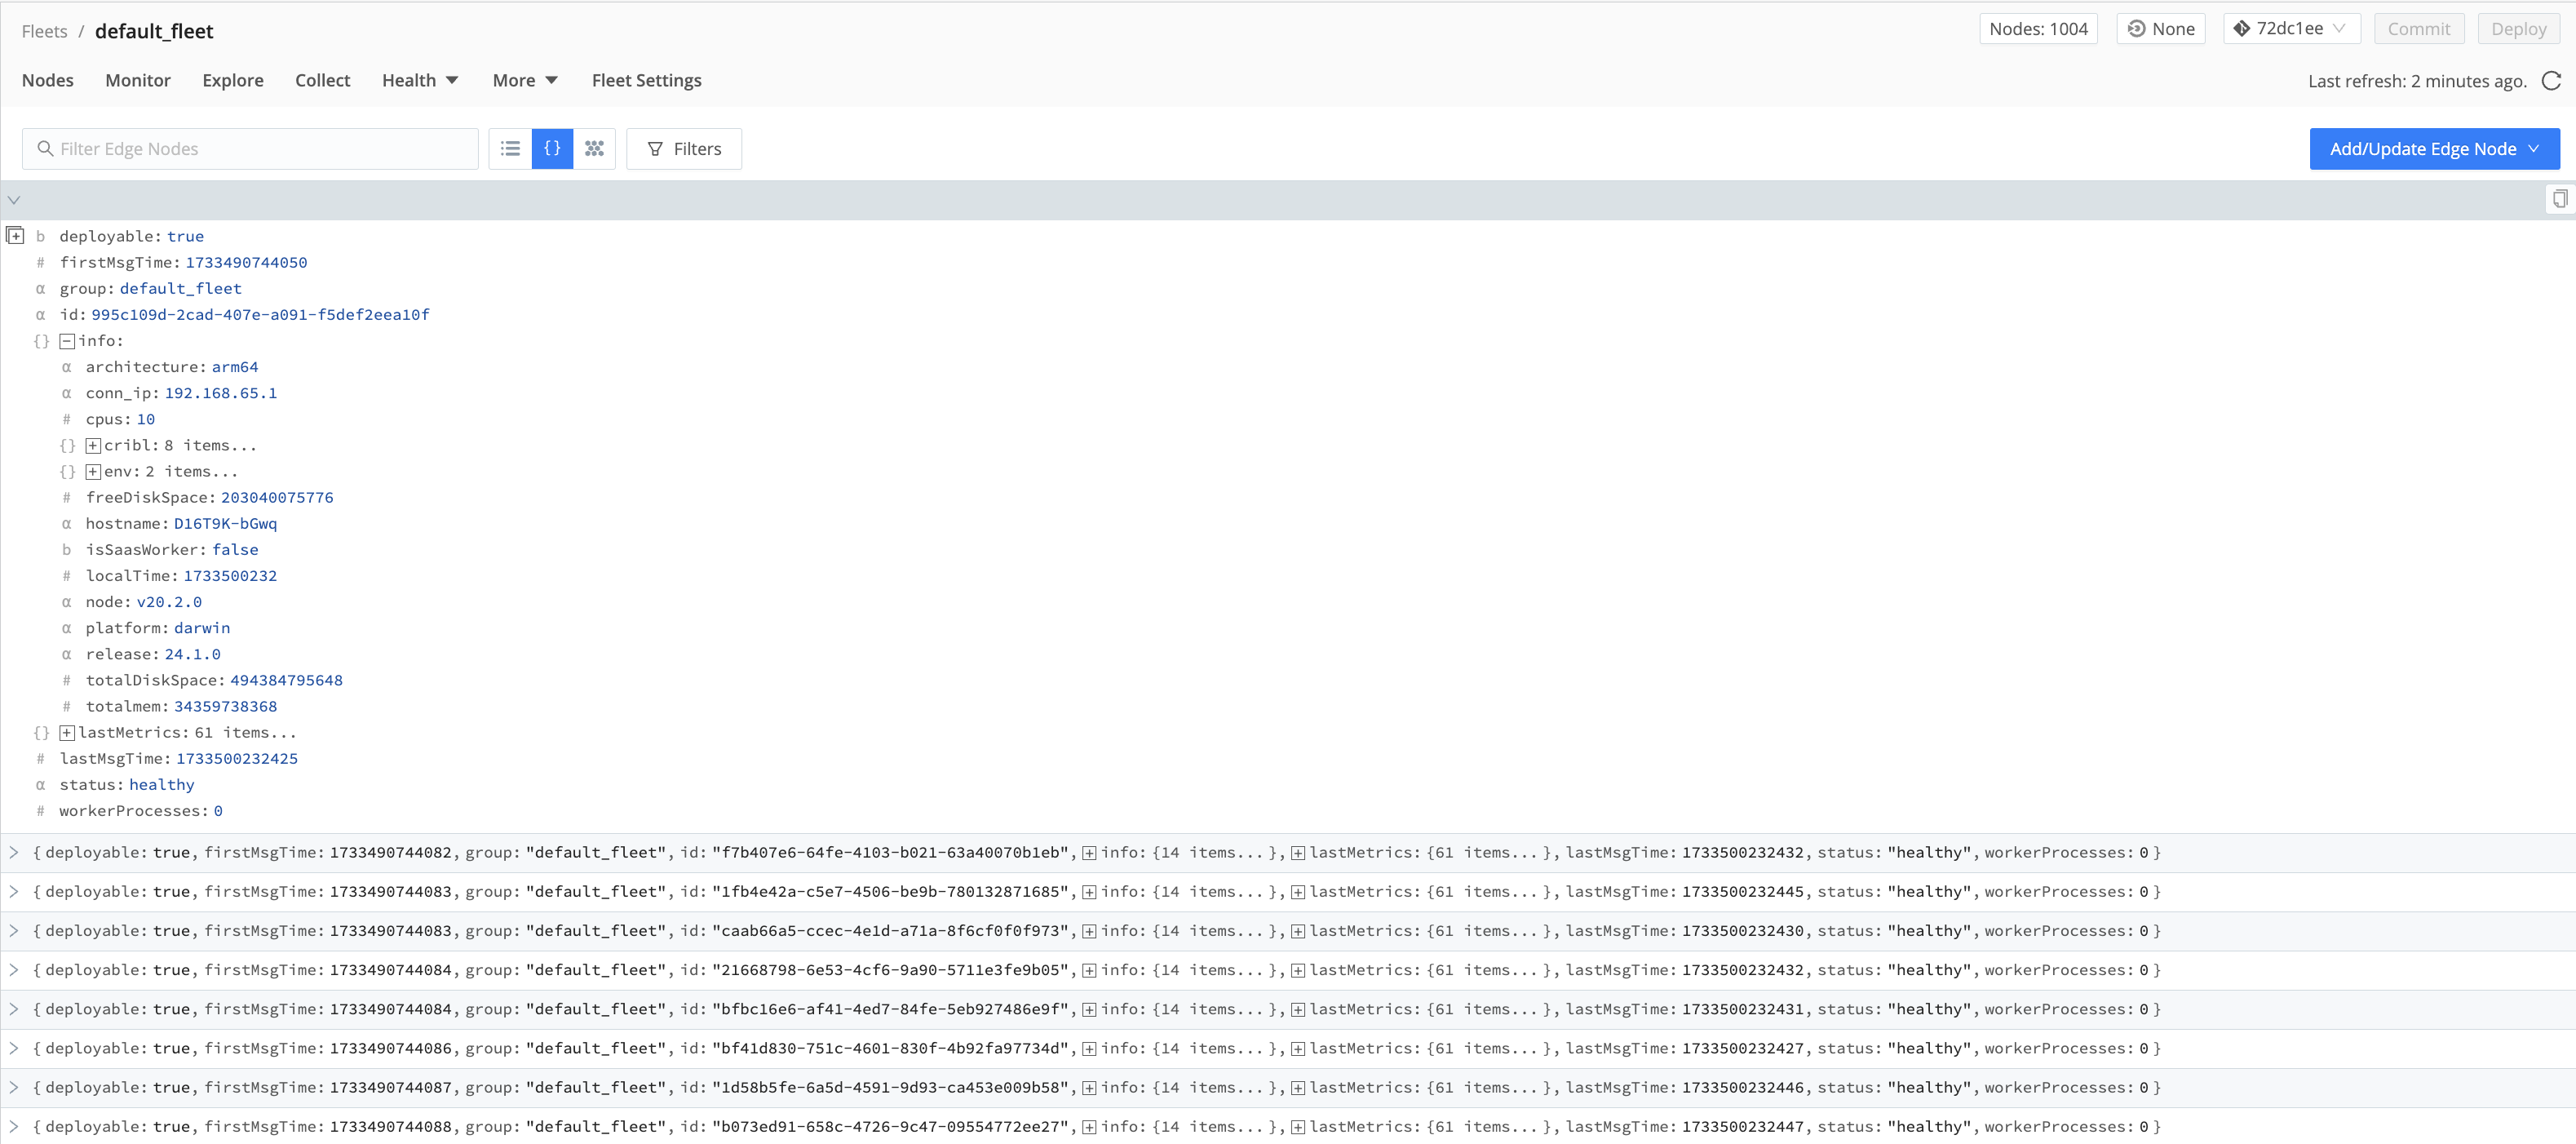
JSON View: Displays each Node and its status in the Fleet as an expandable JSON object. The JSON view provides inputs to create custom Node filters in Advanced mode. For details, see Filter Modes.
Map View: Here, a query builder allows you to display metrics from the Edge Nodes in the Fleet. You can select from different aggregations in the Chart field, different metrics in the Measure field, and the time window in the During field.
The metrics that appear in the Measure list depend on the option selected in Fleet Settings > Limits > Metrics under Metrics to send from Edge Nodes. The metrics total.in_bytes, total.in_events, total.out_bytes, and total.out_events always appear in the list; the display of any other metrics depends on what the Edge Nodes are sending to the Leader. To learn more about these metrics options, see Control Metrics.
A hexagon-based map view displays the resulting metric combination for each of your Edge Nodes. Hovering over on one of the hexagons displays the GUID and Hostname of the Edge Node.
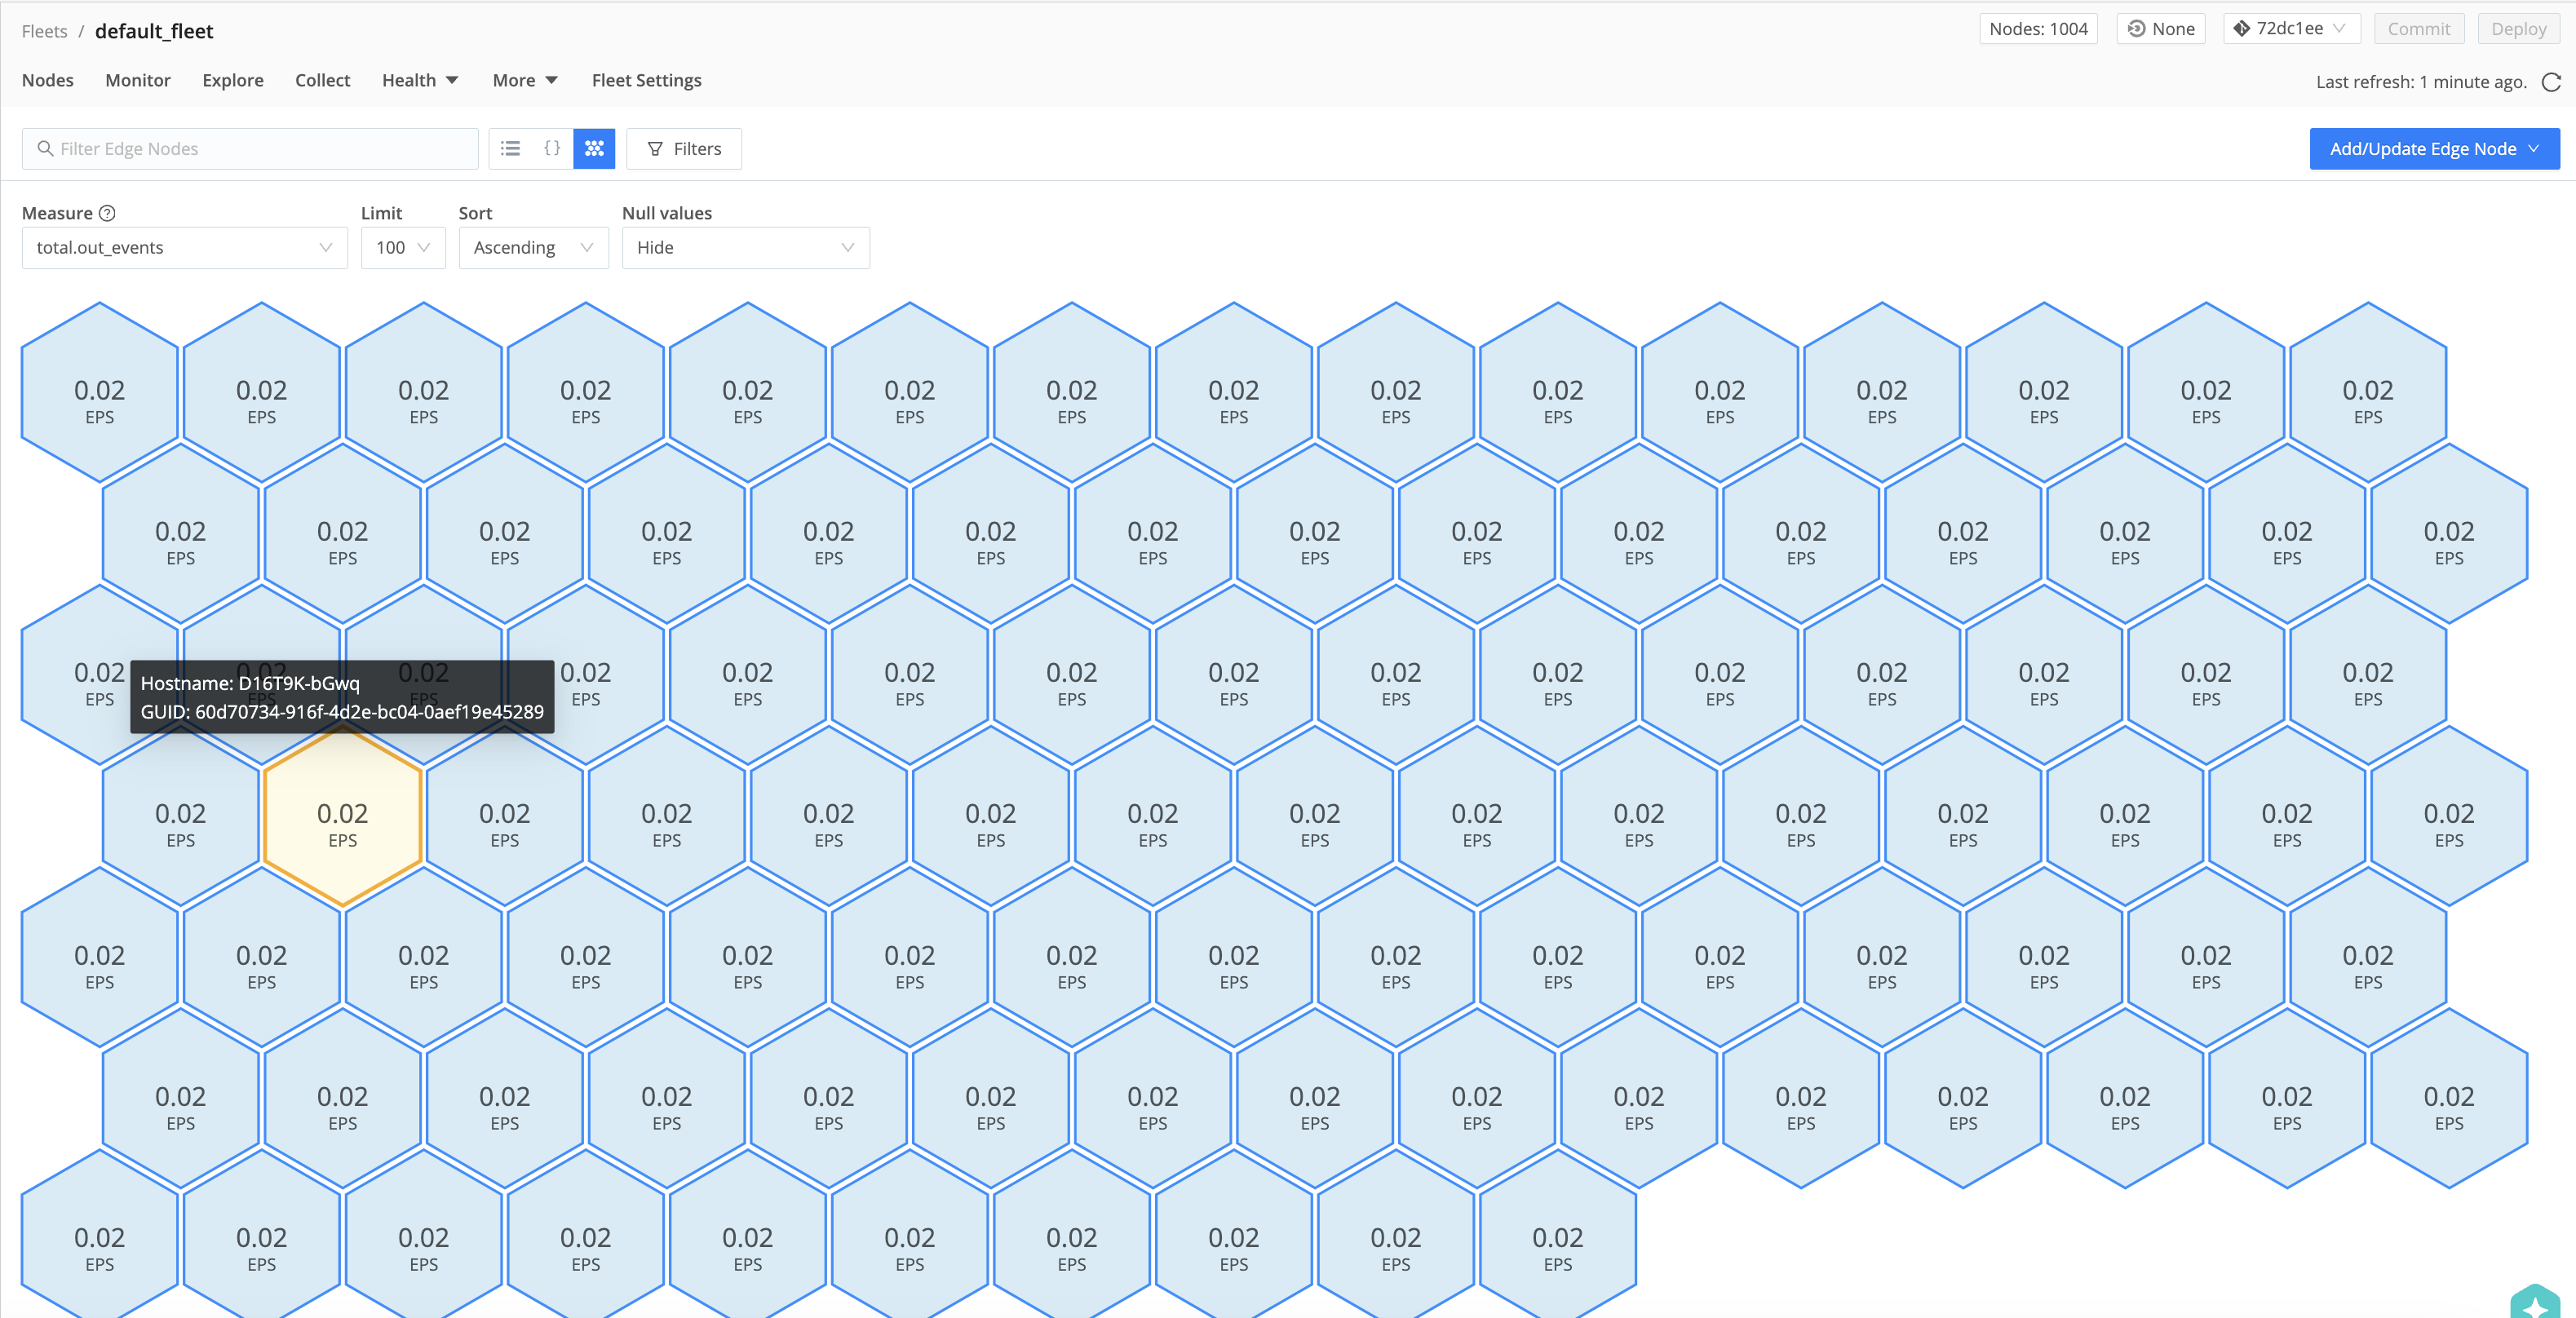
Select any of the hexagons to view the Node Info modal containing details on the Edge Node. For details on this panel, see our Tracking Data Activity for an Edge Node topic.
Teleport into an Edge Node
To teleport from the Leader into the Edge Node, you must turn on Enable teleporting to Nodes in Fleet Settings. Then, select the Edge Node link in the GUID column.
For more information on what you can do while teleported into an Edge Node, see Manage Edge Nodes.
Monitor Fleets
The Monitor tab displays information about your configured Edge Nodes. For more information about monitoring, see our topic on Monitoring Health and Metrics.
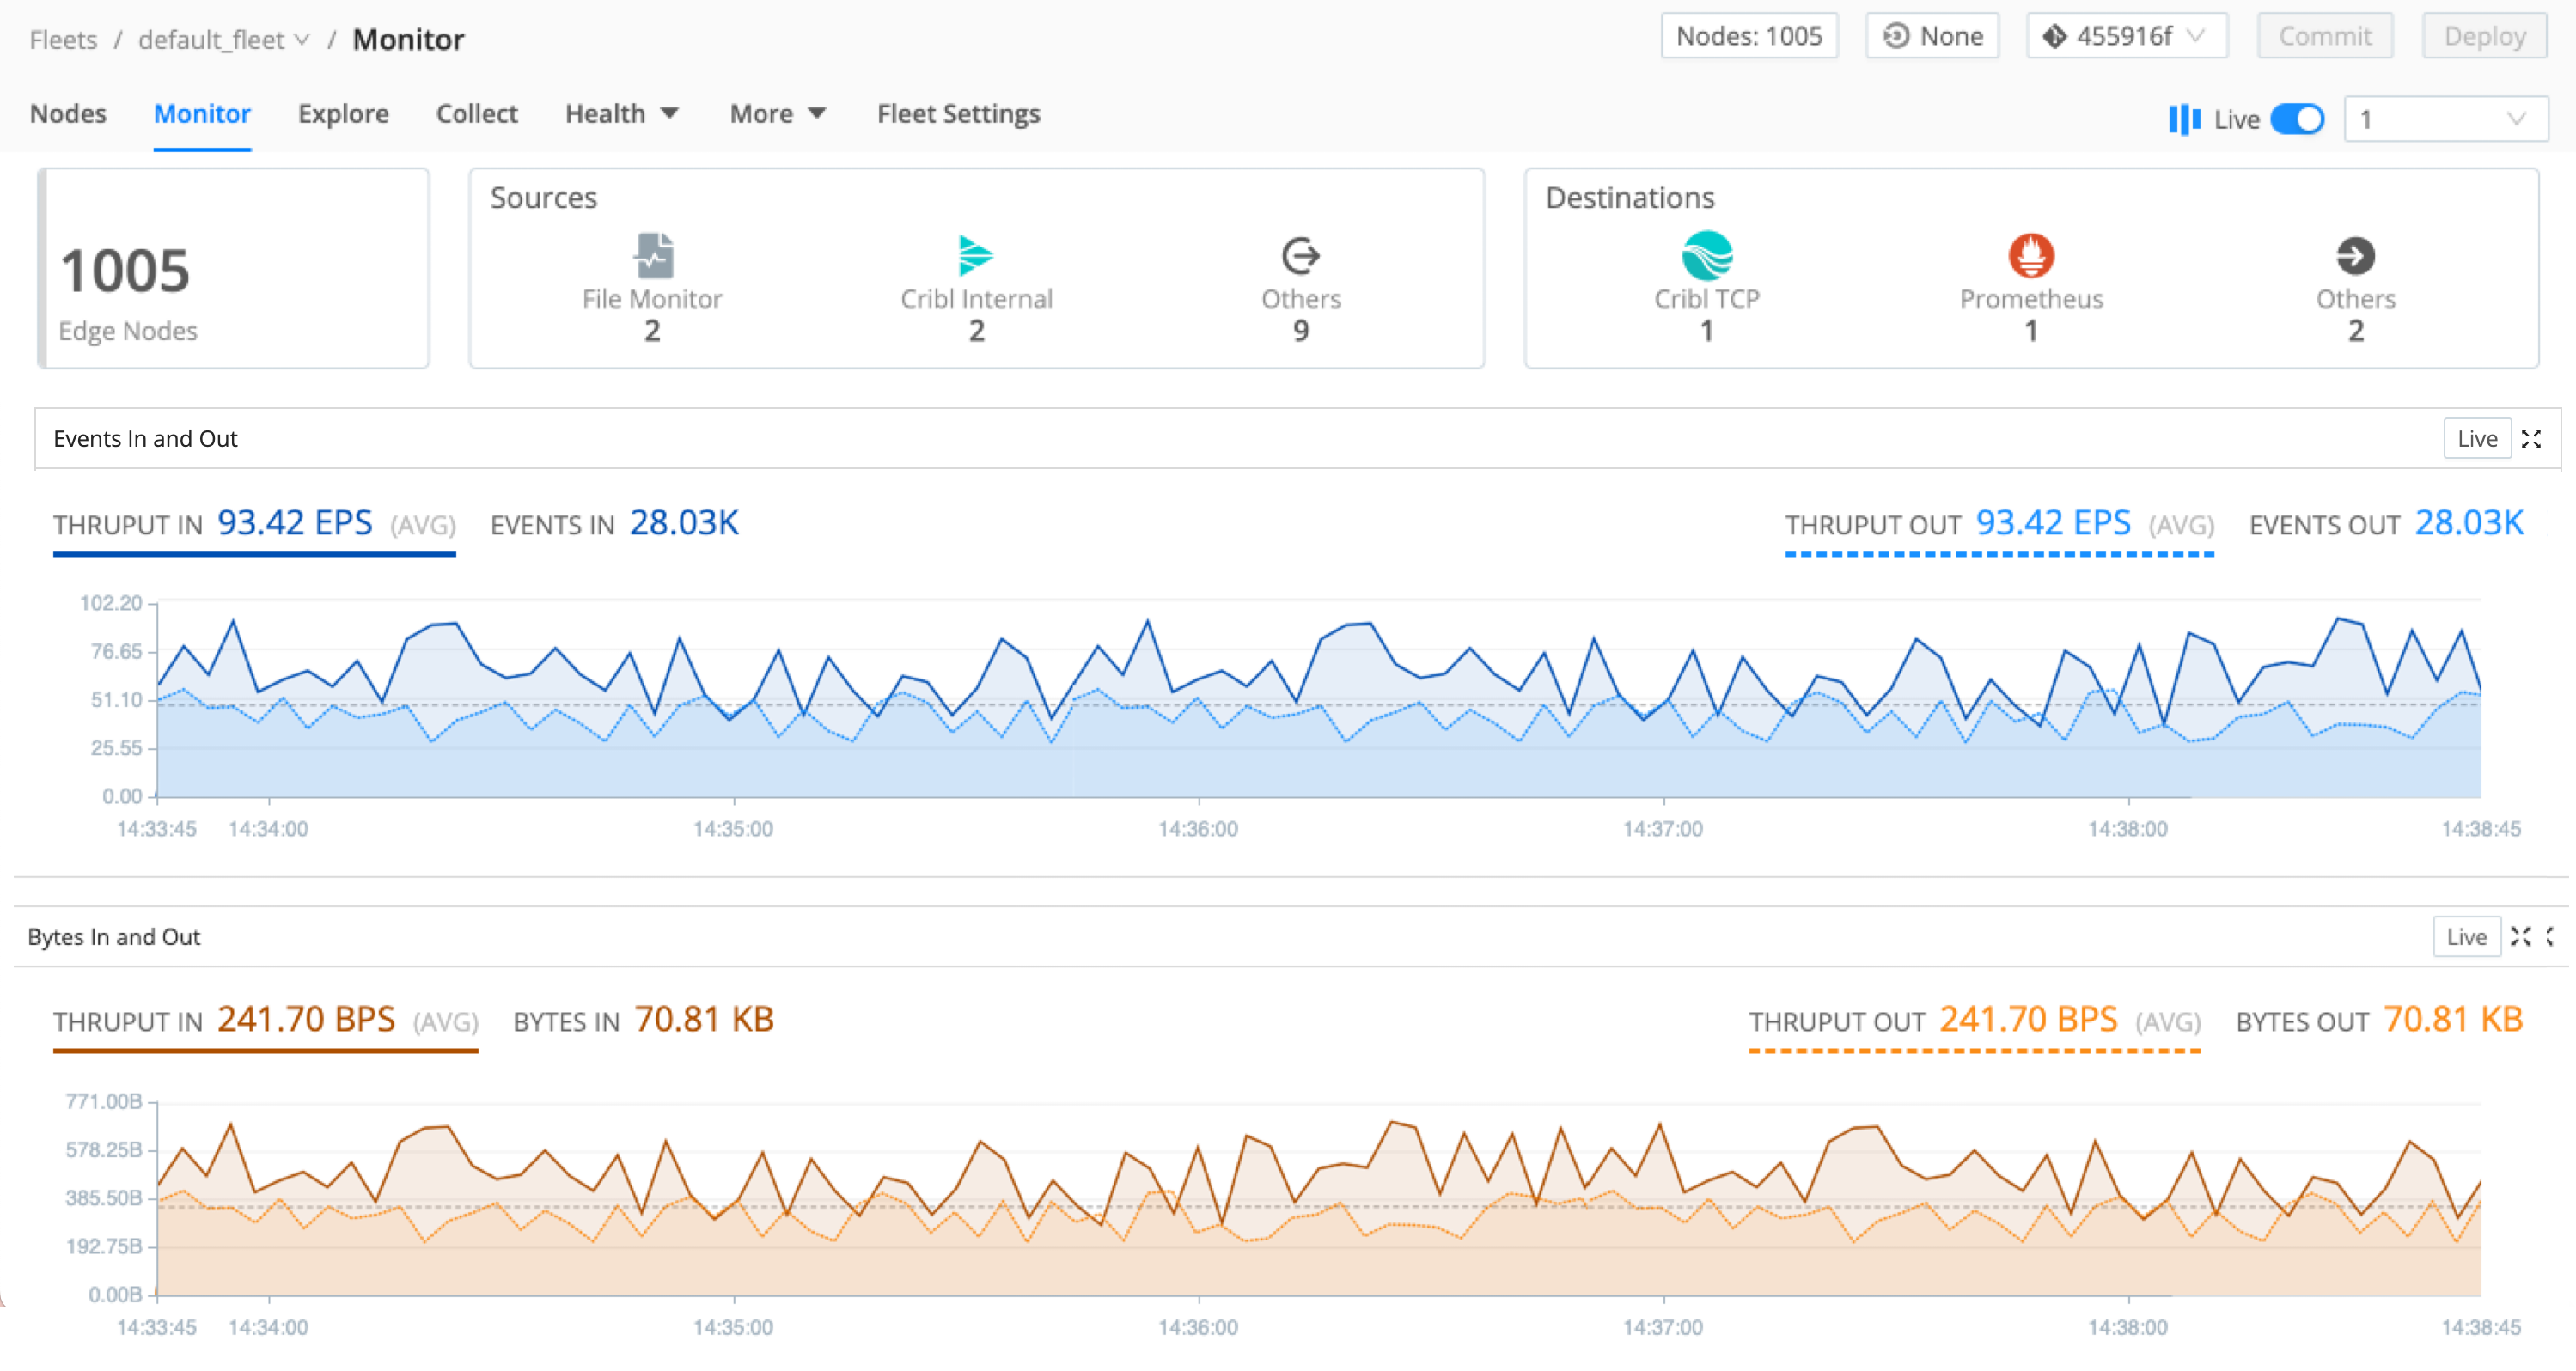
Here, view the following information:
| Name | Description |
|---|---|
| Number of Edge Nodes | The number of Edge Nodes configured in this Fleet. |
| Target Version | If you have a target version selected for the Fleet, it will appear on this button. If not, the button will show None (the default). To learn more about this feature, see Upgrading Edge Nodes via the UI. |
| Events In | Total number of Events in the last 5 minutes of data collected. You can change the display’s granularity from the default last 5 min, selecting a variety of time ranges from 1 min up to 1 day. (The latter covers the preceding 24 hours, and this maximum window is not configurable.) |
| Bytes In | The uncompressed amount of data in the last 5 minutes of data collected. You can change the display’s granularity from the default last 5 min, selecting from a variety of time ranges from 1 min up to 1 day. (The latter covers the preceding 24 hours, and this maximum window is not configurable.) |
| Sources | List of configured Sources. |
| Destinations | List of configured Destinations. |