


These docs are for Cribl Edge 4.11 and are no longer actively maintained.
See the latest version (4.17).
Kubernetes Logs Source
The Kubernetes Logs Source collects logs from containers on a Kubernetes node. Optionally, you can filter and enrich incoming logs. You must authorize this Source to access the Pods in all namespaces. For details, see RBAC for Kubernetes Logs Source.
Type: System and Internal | TLS Support: N/A | Event Breaker Support: Yes | Uses Key-Value Store
Cribl Edge supports configuring only one Kubernetes Logs Source per Edge Node and per Fleet. This Source is currently unavailable on Cribl-managed Workers in Cribl.Cloud.
Discover and Filter Kubernetes Pods to Monitor
The Kubernetes Logs Source connects to the Kubernetes API and loads the lists of Pods on the node, on a configurable Polling interval. The Source then runs the Pods through the Filter Rules to determine which ones to report on.
If no rules are configured, or if all of the rules evaluate to true, the Source generates logs for the Pod’s containers. Conversely, if any of the rules evaluate to false, the Source skips the Pod’s containers, and does not generate any logs for it.
To visualize and analyze these Kubernetes logs in more detail, consider using the Kubernetes Explorer UI in Cribl Edge. You can preview logs by navigating to the Logs view, filtering logs, and defining event breakers.
Cluster/Daemonset Best Practices
For the Kubernetes Logs Source to work as designed, Cribl recommends deploying Cribl Edge as a Daemonset. For details, see Deploying via Kubernetes.
This Source will refuse to run when it connects to the cluster API instead of to the kubelet on the local node. This happens when you run Cribl Edge outside of the cluster; or when you deploy it inside the cluster, but in a way that it can’t detect the local Pod/node. In these cases, Edge will emit an error when it initializes this Source.
Configure Cribl Edge to Collect Kubernetes Logs
- On the top bar, select Products, and then select Cribl Edge. Under Fleets, select a Fleet. Next, you have two options:
- To configure via QuickConnect, navigate to Collect. Select Add Source and select the Source you want from the list, choosing either Select Existing or Add New.
- To configure via the Routes, select More > Sources. Select the Source you want. Next, select Add Source.
- Configure the following under General Settings:
- Input ID: This is prefilled with the default value
in_kube_logs, which cannot be changed via the UI, due to the single-Source restrictions above. - Description: Optionally, enter a description.
- Input ID: This is prefilled with the default value
- Next, you can configure the following Optional Settings:
- Polling interval: How often, in seconds, to collect metrics. If not specified, defaults to
15seconds. For considerations, see Polling Interval and Log Rotation below. - Filter Rules: Optionally, specify the Kubernetes Pods that this Source should parse to generate logs. If you specify no restrictive rules here, the Source will emit all events.
- Filter expression: JavaScript expression to filter Kubernetes Pod objects. For details, see Filter Expression below.
- Enable timestamps: When toggled on, Cribl Edge prefixes a timestamp to each line of the container’s raw console output. When you enable timestamps, you must select the
kubernetes_logspre-processing Pipeline. This Pipeline removes conflicting timestamps prepended by the Source. This combination is designed for working with containers whose console output lacks proper timestamps (either because the timestamps are missing altogether or because they specify time only but not date). - Tags: Optionally, add tags that you can use to filter and group Sources in Cribl Edge’s UI. These tags aren’t added to processed events. Use a tab or hard return between (arbitrary) tag names.
- Polling interval: How often, in seconds, to collect metrics. If not specified, defaults to
- Optionally, configure any Processing, Disk Spooling, and Advanced settings, or Connected Destinations outlined in the sections below.
- Select Save, then Commit & Deploy.
The Kubernetes Logs Source only collects logs from running containers, which means it can miss logs from short-lived containers or those that exit before they start running.
Polling Interval and Log Rotation
The Kubernetes Logs Source polls the kubelet on the local node. This operation is lightweight and has minimal performance impact. However, the polling interval is crucial for capturing all log data, especially when dealing with high log volumes and frequent log rotations.
During each poll, the Source not only discovers new Pods, but also checks existing log streams for stalls, which can occur due to container runtime log rotations. If a log rotation happens more than once between polls, one or more rotated log files will be missed, resulting in log loss.
To prevent log loss, set the Polling interval value to shorter than the log rotation time. For example, given a 10 second rotation interval, a polling interval closer to 5 seconds, would be more appropriate. This is because if two rotations occur within a single polling window, log data can be lost.
While Kubernetes 1.29 mitigates log rotation issues, polling intervals still matter. Long intervals can cause missed logs, especially from short-lived containers that start and stop between polls. Consider adjusting the containerLogMaxSize setting to prevent excessive log rotations by Kubernetes itself. This can help reduce the frequency of rotations and lessen the chance of missing logs due to polling intervals.
Filter Expression
Filters are based on the Kubernetes Pod Object definition, and evaluated from top to bottom. The first expression evaluating to false excludes the Pod from collection. The default filter is !metadata.namespace.startsWith('kube-'), which ignores Pods in the kube-* namespace.
Other Filter expressions examples include:
Collect logs from Pods on a specific Node -
spec.nodeName == 'node1'Ignore all DaemonSets -
metadata.ownerReferences[0].kind != 'DaemonSet'Ignore Pods with specific Container names -
spec.containers[0].name != 'edge'Description: Optional description of the rule.
Pods are either included or excluded entirely based on the Filter Rules.
Processing Settings
Event Breakers
This section defines event breaking rulesets that will be applied, in order, on the /raw endpoint.
Event Breaker rulesets: A list of event breaking rulesets that will be applied to the input data stream before the data is sent through the Routes. Defaults to System Default Rule.
Event Breaker buffer timeout: How long (in milliseconds) the Event Breaker will wait for new data to be sent to a specific channel, before flushing out the data stream, as-is, to the Routes. Minimum 10 ms, default 10000 (10 sec.), maximum 43200000 (12 hours).
Fields
In this section, you can define new fields or modify existing ones using JavaScript expressions, similar to the Eval function.
- The Name specifies the field name, which can either be a new field (unique within the event) or an existing field name to modify its value.
- The Value is a JavaScript expression (enclosed in quotes or backticks) to compute the field’s value (can be a constant). Select this field’s advanced mode icon (far right) if you’d like to open a modal where you can work with sample data and iterate on results.
This flexibility means you can:
- Add new fields to enrich the event.
- Modify existing fields by overwriting their values.
- Compute logic or transformations using JavaScript expressions.
Pre-Processing
Select a Pipeline (or Pack) from the drop-down to process this Source’s data. Required to configure this Source via Data Routes; optional to configure via Collect/QuickConnect.
Disk Spooling
Enable disk spooling to search for spooled Kubernetes logs directly from Edge Nodes, without needing to forward specific logs to a Destination for storage first.
Data buckets are partitioned into subdirectories for Pods and containers, but it will be faster to search for your data by Pods.
Enable disk spooling: Determine whether or not to save Kubernetes logs to disk. When set to Yes, the configuration fields below become available.
Bucket time span: The amount of time that data is held in each bucket before
it’s written to disk. The default is 10 minutes (10m). Kubernetes logs
are high-volume, so consider the time span you enter here (as a long time span
could cause the disk to fill up quickly).
Data size limit: This is the maximum amount of disk space that spooled data is allowed to consume. Once data reaches this amount, Edge will delete data starting with the oldest buckets.
Data age limit: The duration of time for which Cribl Edge will retain data.
Edge will delete data that exceeds the max age entered in this field. Example
values are 2h, 4d. The default value is 24 hours (24h).
Compression: The codec that Edge uses to compress the data. The default is
gzip.
Cribl Edge will write events to the default location:
$CRIBL_SPOOL_DIR/in/kube_logs/{inputId}/{timeBucket}/{namespace}/{pod}/{container}
By default, By default, $CRIBL_SPOOL_DIR points to $CRIBL_HOME/state/spool.
To change the base spool path, use the CRIBL_SPOOL_DIR environment variable.
Advanced Settings
Environment: If you’re using GitOps, optionally use this field to specify a single Git branch on which to enable this configuration. If empty, the config will be enabled everywhere.
Enable load balancing: To handle high volumes of Kubernetes logs, enable load balancing. This improves the events per second (EPS) ingest rate, and is helpful when you need to ingest more Kubernetes logs EPS than a single Worker Process can handle.
When you enable this toggle, you should also increase the number of Worker Processes in Fleet Settings. The number of Worker Processes for load balancing depends on your Kubernetes log ingest volume. To ingest 40k EPS, try starting with two or four Worker Processes, then increase if needed.
Connected Destinations
Select Send to Routes to enable conditional routing, filtering, and cloning of this Source’s data via the Routing table.
Select QuickConnect to send this Source’s data to one or more Destinations via independent, direct connections.
Internal Fields
Cribl Edge uses a set of internal fields to assist in forwarding data to a Destination.
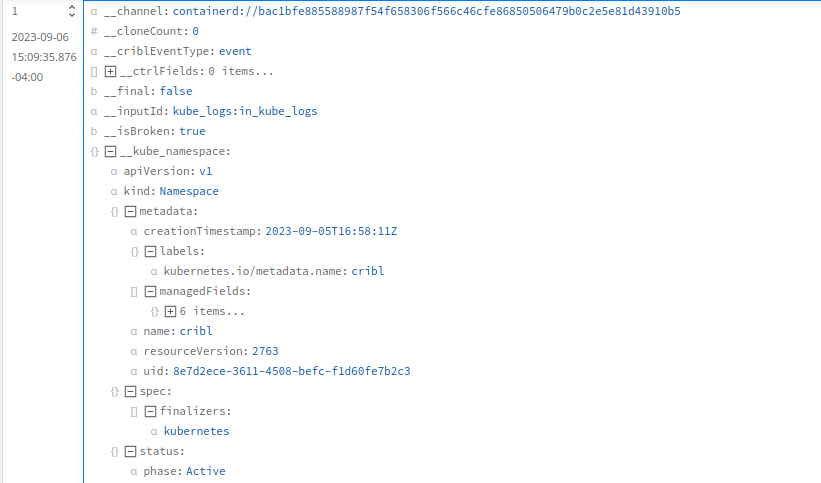
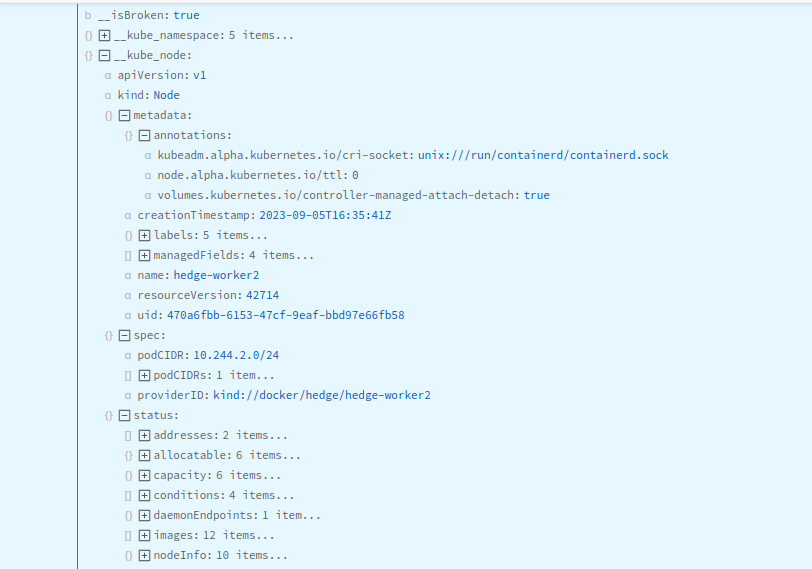
These are the full objects from the Kubernetes API, showing the namespace, node, and Pod where the log originated:
__channel__extractedTime__final__isBroken__kube_namespace__kube_node__kube_pod__raw__source_raw_time
For details, see Objects in Kubernetes.
Key-Value Store
The Kubernetes Logs Source uses key-value store for container information. Container IDs are used as.
Sample Log Event
The following screenshots show the __kube objects corresponding to a sample log event.
Namespace Metadata
Node Metadata
Pod Metadata