


These docs are for Cribl Edge 4.11 and are no longer actively maintained.
See the latest version (4.17).
Windows Metrics Source
Cribl Edge collects metrics from Windows hosts on which it runs, and can populate some standard metrics dashboards right out of the box. This Source produces events compatible with the Prometheus Windows Exporter to send out system, CPU, memory, network, and disk metrics. For metrics details, see Windows System Metrics Details.
Type: System and Internal | TLS Support: N/A | Event Breaker Support: No
Edge Nodes support Windows Metrics only when running on Windows. (To collect metrics from Linux hosts, use the System Metrics Source.) Edge Leaders support configuring only one Windows Metrics Source per Fleet.
Configure Cribl Edge/Windows to Collect System Metrics
- On the top bar, select Products, and then select Cribl Edge. Under Fleets, select a Fleet. Next, you have two options:
- To configure via QuickConnect, navigate to Routing > QuickConnect (Stream) or Collect (Edge). Select Add Source and select the Source you want from the list, choosing either Select Existing.
- To configure via the Routes, select Data > Sources (Stream) or More > Sources (Edge). Select the Source you want. Next, select Add Source.
- Configure the following under General Settings:
- Input ID: This is prefilled with the default value
in_windows_metrics, which cannot be changed via the UI, due to the single-Source restriction above. - Description: Optionally, enter a description.
- Input ID: This is prefilled with the default value
- Next, you can configure the following Optional Settings:
- Polling interval: How often, in seconds, to collect metrics. Defaults to
10seconds. - Tags: Optionally, add tags that you can use for filtering and grouping in the Cribl Edge UI. Use a tab or hard return between (arbitrary) tag names. These tags aren’t added to processed events.
- Polling interval: How often, in seconds, to collect metrics. Defaults to
- Optionally, you can adjust the Host Metrics, Process Metrics, Processing and Advanced settings, or Connected Destinations outlined in the sections below.
- Select Save, then Commit & Deploy.
Host Metrics
Use the buttons to select a level of detail:
- Basic enables minimal metrics, averaged or aggregated. This is the minimum configuration needed to support the Cribl Edge landing page.
- All enables full, detailed metrics for individual CPUs, interfaces, etc.
- Custom displays submenus and buttons from which you can choose a level of detail (Basic, All, Custom, or Disabled) for each specific type of event.
- Disabled generates no metrics.
The meanings of All and Disabled are self-evident. Basic and Custom have different meanings depending on event type - see the following subsections.
System
Basic level captures load averages, uptime, and CPU count.
Custom level toggles Detailed metrics on or off. These are Windows-specific metrics including OS information, system uptime, CPU architecture, etc.
CPU
Basic level captures active, user, system, idle, and iowait percentages over all CPUs.
Custom level toggles the following on or off: Per CPU metrics, Detailed metrics (i.e., metrics for all CPU states), and CPU time metrics (i.e., raw, monotonic CPU time counters).
Memory
Basic level captures captures total, used, available, swap_free, and swap_total.
Custom level toggles Detailed metrics on or off. (These are metrics for all memory states.)
Network
Basic level captures bytes, packets, errors, and connections over all interfaces.
Custom level exposes the following:
- The Interface filter, which specifies which network interfaces to include or exclude. (An empty filter will include all metrics.)
- Per interface metrics, which toggle on or off.
- Detailed metrics, which toggle on or off. If on, the Protocol metrics toggle appears, allowing you to choose whether to generate metrics for ICMP, ICMPMsg, IP, TCP, UDP, and UDPLite.
Disk
Basic level captures disk usage (%), bytes read and written, and read and write operations, over all mounted disks.
Custom level exposes the following:
- The Volume filter, specifying which Windows volumes to include or exclude. Supports wildcards and
!(not) operators. An empty filter will include all volumes. - Per volume metrics, which toggle on or off.
- Detailed metrics, which toggle on or off.
Process Metrics
With Process Metrics enabled, Cribl Edge captures process-specific metrics from Windows servers and reports them as events. This allows you to monitor specific processes on Cribl.Cloud instances. You can generate events for any process object.
To collect a process metrics event, create a Process Set and add a filter expression. Processes that match the filter are returned as individual events. See Collecting Metrics. Process Sets are separate from aggregate and host-wide metrics.
Process-specific metrics are not affected by the Host Metrics detail setting.
You can control the collection method for Process Metrics using a configuration option in the Fleet Settings > Limits > Other section. This setting allows you to choose between using PowerShell cmdlets or the more efficient native module. Be aware that when using PowerShell cmdlets, environment variables displayed in the Explore > Processes tab for Windows processes might be inaccurate. For details, see Other Limits.
Adding a Process Set
To add a Process Set:
- Open the Windows Metrics Source and access the Configure tab.
- Click the Process Metrics menu, then Add process set.
- Configure the details:
- Set name: The name for this process set.
- Filter expression: The JavaScript expression that will filter the processes.
- Include children: When toggled to “Yes”, the processes that match the filter include metrics for child processes.
Filtering Processes
You can filter processes using the field names and values from each process object.
Tip
To see all processes currently running on an Edge Node, click Explore in the submenu and open the Processes Tab.
Example Filters
Here’s an example filter and the results it could return.
This filter will retrieve processes with the name explorer:
processName === 'explorer'
Note that the strict equality (===) operator in the above expression forces
case sensitivity in the filter.
The Filter expression field expects a specific syntax in order to apply the filter to the processes. These expressions evaluate to either
trueorfalse. See Build Custom Logic to Route and Process Your Data: Filter Expressions for more information.
Collecting Metrics
Once you have at least one Process Set created and saved, Cribl Edge will begin collecting process metrics at the interval defined in the Polling interval field (General Settings menu).
To view the status of the Collector and total events collected, click the Status tab in the Windows Metrics Source.
To view a live capture of individual metrics gathered from processes that match
the Process Set, click the Live Data tab. The Process Set that owns each
metric is represented by the __process_set internal field.
Supported Processes
To view the complete table of supported Windows process metrics, their descriptions, types, and dimensions, see Process-Specific Metrics.
Using Advanced Mode
To test your filter expression against a sample input, click the Advanced mode button within the Filter expression field. The Filter expression modal will open.
Here, you can paste in your filter expression, select a sample JSON input from the drop-down (or enter your own directly in the Sample input field), and select a specific event to test against.
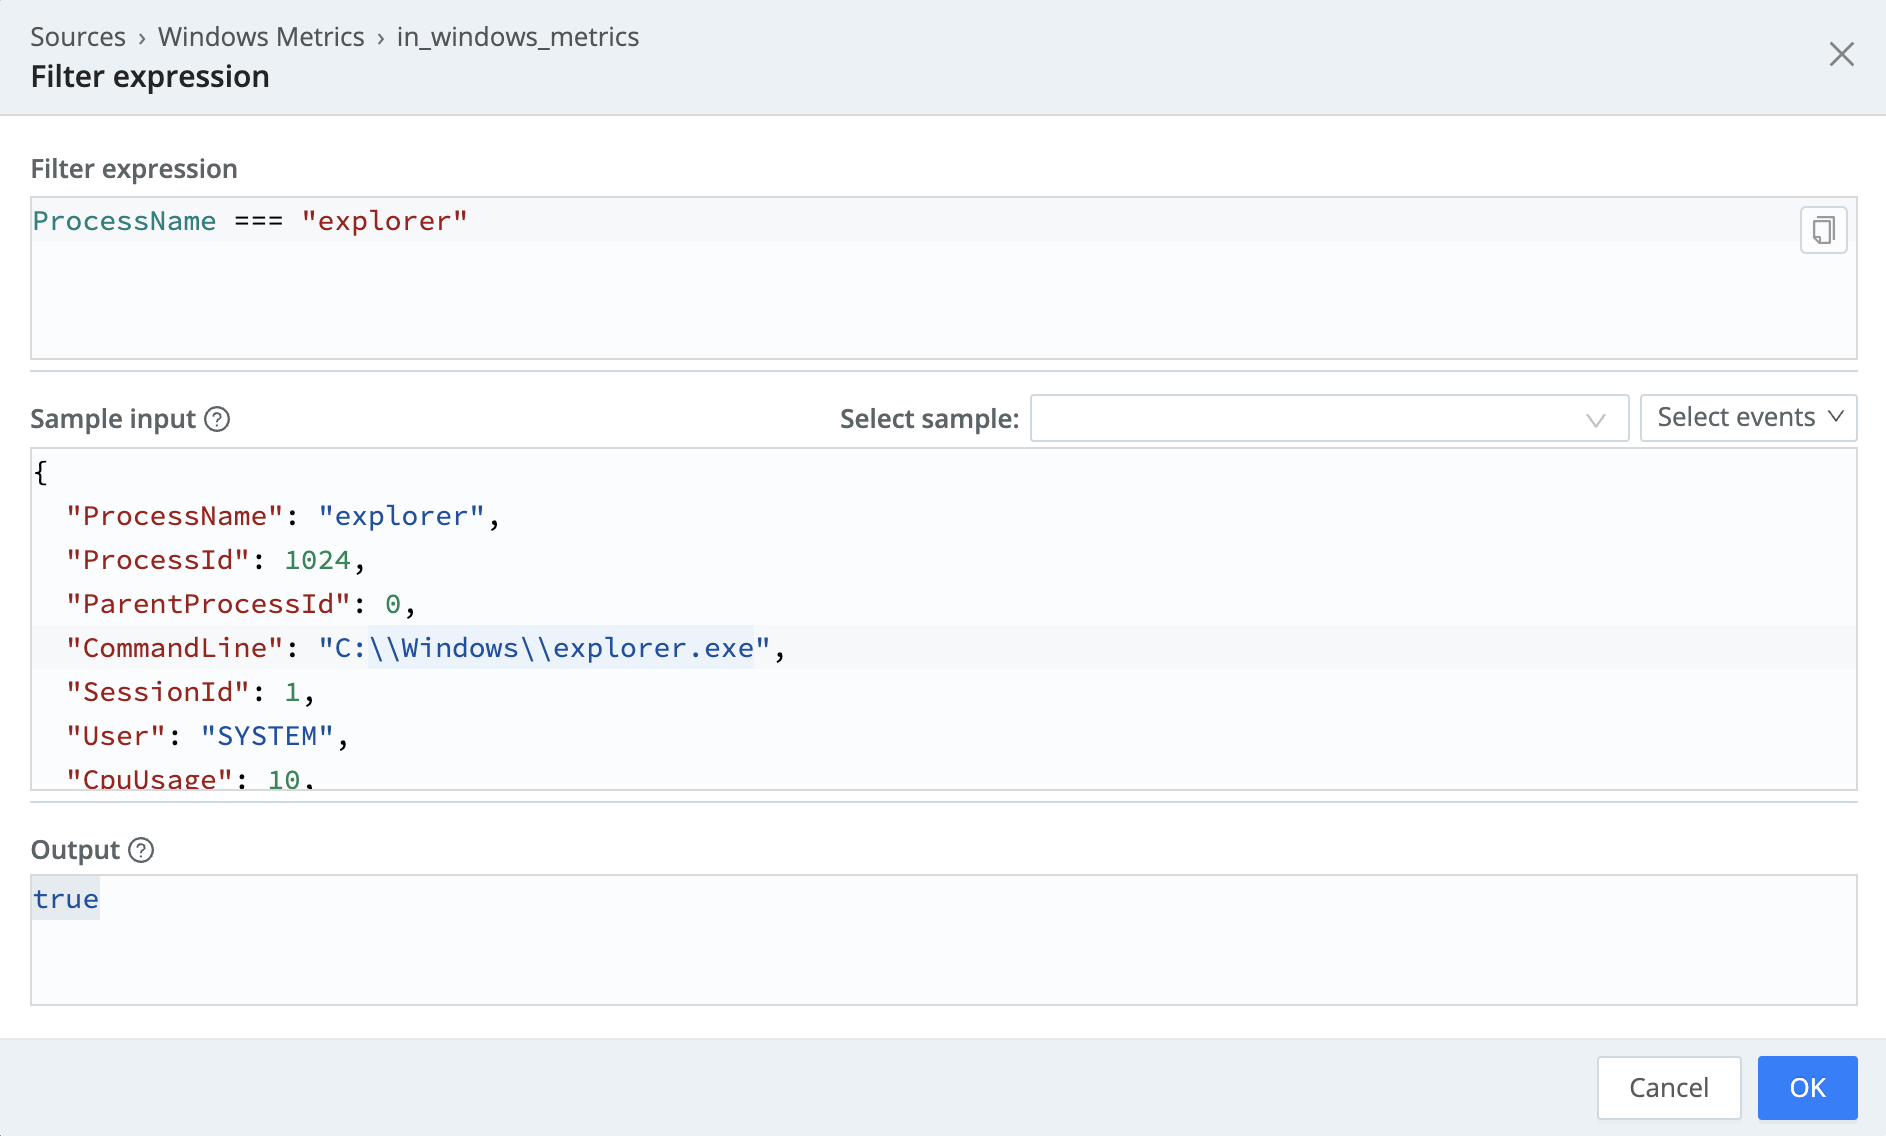
The Output will show you if the filter expression returns any matching processes, based on the filter expressions and JSON input.
Processing Settings
Fields
In this section, you can define new fields or modify existing ones using JavaScript expressions, similar to the Eval function.
- The Name specifies the field name, which can either be a new field (unique within the event) or an existing field name to modify its value.
- The Value is a JavaScript expression (enclosed in quotes or backticks) to compute the field’s value (can be a constant). Select this field’s advanced mode icon (far right) if you’d like to open a modal where you can work with sample data and iterate on results.
This flexibility means you can:
- Add new fields to enrich the event.
- Modify existing fields by overwriting their values.
- Compute logic or transformations using JavaScript expressions.
Pre-Processing
Select a Pipeline (or Pack) from the drop-down to process this Source’s data. Required to configure this Source via Data Routes; optional to configure via Collect/QuickConnect.
Disk Spooling
Enable disk persistence: Whether to save metrics to disk. When toggled on, exposes this section’s remaining fields.
Bucket time span: The amount of time that data is held in each bucket before it’s written to disk. The default is 10 minutes (10m).
Max data size: Maximum disk space the persistent metrics can consume. Once reached, Cribl Edge will delete older data. Example values: 420 MB, 4 GB. Default value: 100 MB.
Max data age: How long to retain data. Once reached, Cribl Edge will delete older data. Example values: 2h, 4d. Default value: 24h (24 hours).
Compression: Optionally compress the data before sending. Defaults to gzip compression. Select none to send uncompressed data.
Path location: Path to write metrics to. Default value is $CRIBL_HOME/state/windows_metrics.
Advanced Settings
Use Windows Tools: Toggled off by default.
If toggled off, the Windows Metrics Source interacts directly with the Windows Management Instrumentation (WMI) API, resulting in faster metrics collection.
If toggled on, the Windows Metrics Source will collect events using
PS cmdlets.
Environment: If you’re using GitOps, optionally use this field to specify a single Git branch on which to enable this configuration. If empty, the config will be enabled everywhere.
Connected Destinations
Select Send to Routes to enable conditional routing, filtering, and cloning of this Source’s data via the Routing table.
Select QuickConnect to send this Source’s data to one or more Destinations via independent, direct connections.