These docs are for Cribl Edge 4.4 and are no longer actively maintained.
See the latest version (4.17).
Kubernetes Observability Using Cribl Edge
Capturing observability data is difficult in Kubernetes environments. Kubernetes deployments can scale up to thousands of nodes, making monitoring challenging. In addition, tracking and troubleshooting infrastructure performance is challenging due to its dynamic nature.
In this guide, we will show you how to address these problems by:
- Deploying Cribl Edge via Kubernetes using the Cribl Helm Chart, including creating Kubernetes-specific Fleets and > Fleet settings.
- Setting environment variables for your Kubernetes environment to work.
- Configuring the Kubernetes Sources, Destinations, and Pipelines to connect them.
- Visualizing the data in Grafana using some pre-built dashboards.
- Learning about “better practices” and recommendations for deploying Cribl Edge on your Kubernetes clusters.
While some open-source tools can address these needs, they may be cumbersome to deploy and manage for sprawling microservices environments. Getting Kubernetes data into analytics platforms is challenging due to its volume, lack of standard formatting, and ephemeral nature.
In addition to addressing these issues, Cribl Edge brings Cribl Stream’s processing power for deployment on servers. With the ability to collect, process, and forward data with low resource overhead, Cribl Edge is designed for sprawling environments such as Kubernetes. With Cribl Edge, you can capture Pod logs and Control Plane events, generate Kube State Metrics (KSM), scrape data from Prometheus endpoints, and send the data to your downstream systems.
Deploy Cribl Edge via Kubernetes
In this section we’ll cover:
- Configuring Fleets and Fleet Settings
- Installing Using Helm
- Setting Environment Variables for your Kubernetes Deployment
Configuring Fleets & Fleet Settings on Cribl Edge
Before we deploy the Edge Node, let’s configure a Fleet. Fleets and their corresponding Subfleets allow you to author and manage configuration settings for a particular set of Edge Nodes.
We recommend configuring a separate Fleet to manage your Kubernetes environment. It is easier to deploy or upgrade Kubernetes Edge Nodes using our Helm Charts when they are all in one Fleet. For best practices on configuring Fleets, see Fleet Design and Hierarchy.
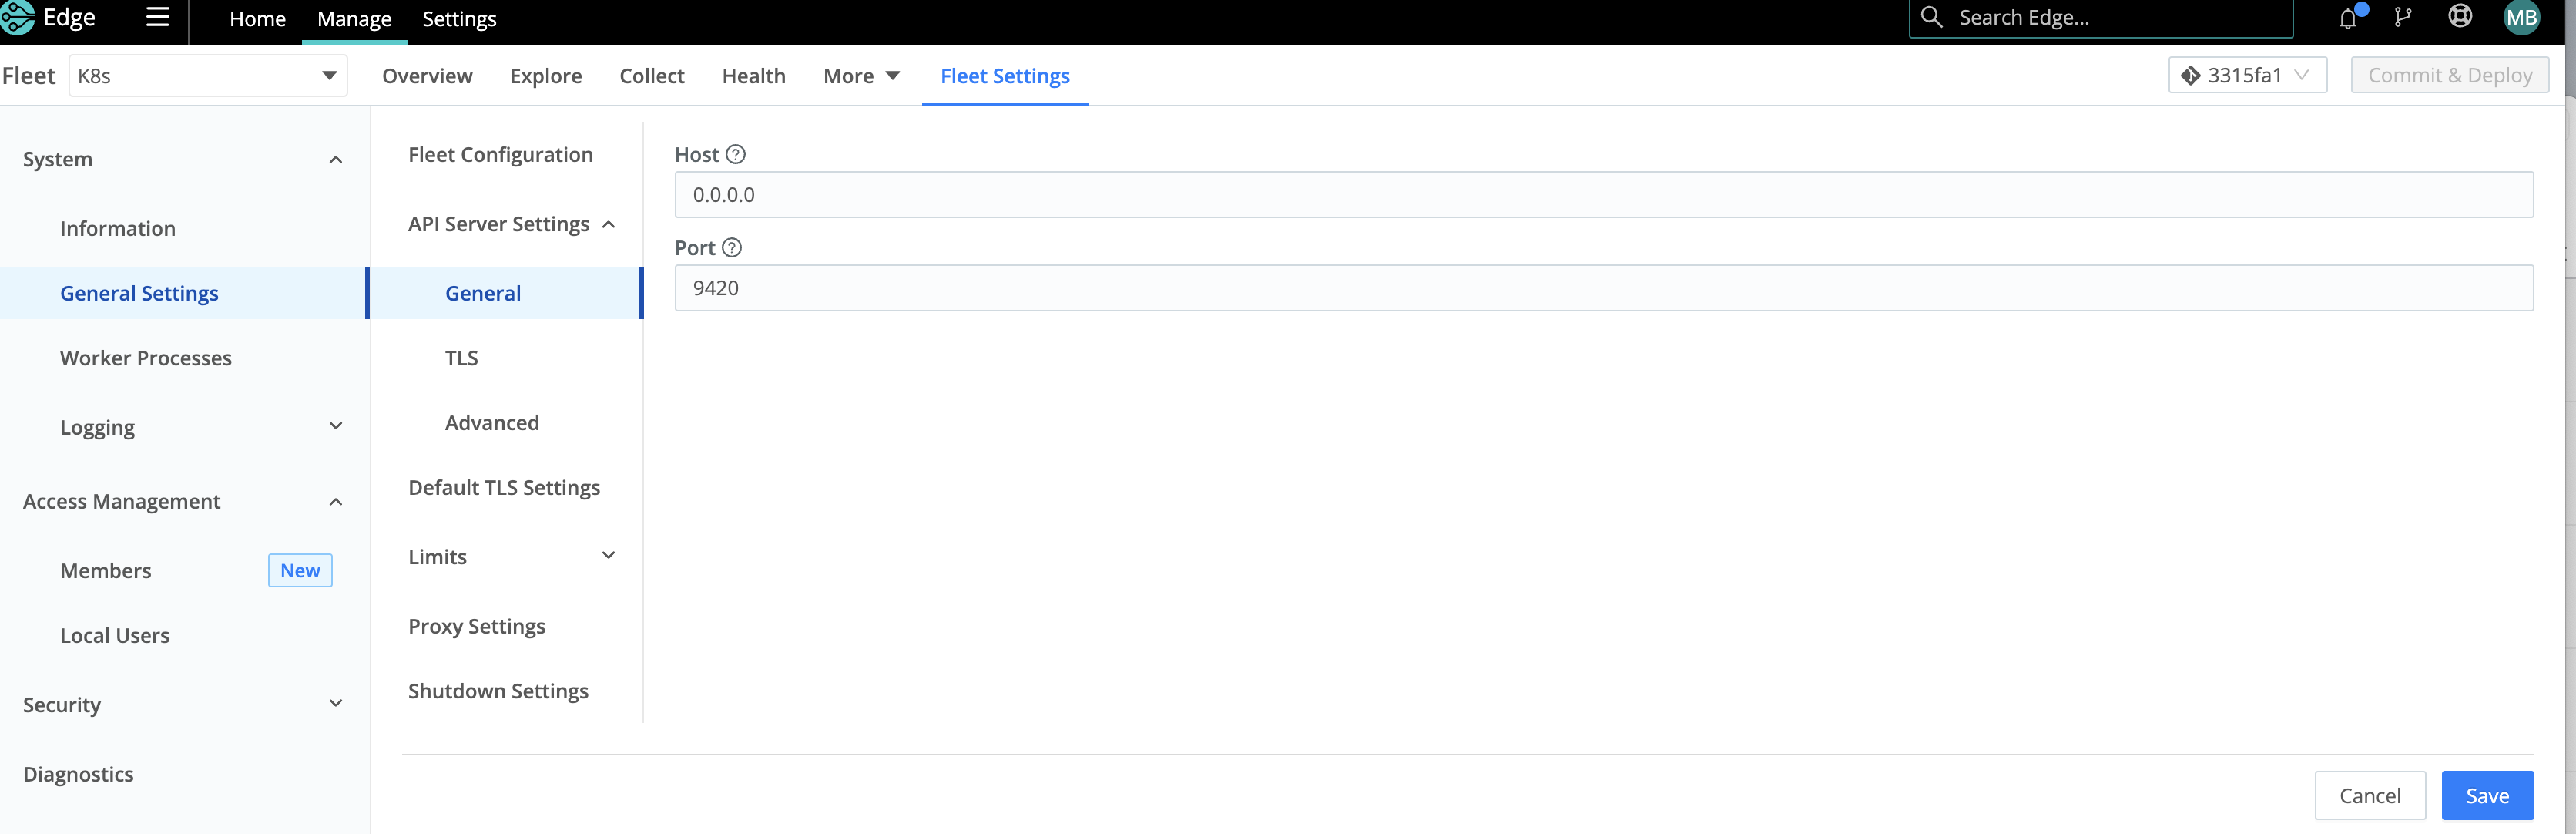
Once you have configured your Fleet, you must adjust the API Server settings in Fleet Settings to bind to all IPs in the container - this is done by changing API Server configuration from 127.0.0.1 (Loopback Interface) to 0.0.0.0. Kubernetes health checks will fail if this step is not performed prior to pushing config bundles to Edge agents. For details, see Health Checks.
To change the Fleet Settings:
- Navigate to Manage in the Cribl Edge UI.
- Select the Kubernetes-specific Fleet.
- Click Fleet Settings in the submenu.
- Navigate to System > General Settings > API Server Settings > General.
- Change the Host value from
127.0.0.1to0.0.0.0. - Click Save.
Use the Bootstrap Script to install the Helm Chart
We recommend deploying the Cribl Edge agent in your Kubernetes cluster using our Helm charts. These charts provide the minimum configuration required to install Cribl Edge correctly.
Our deployment has been tested across multiple Kubernetes platforms on several cloud service providers. The Cribl Helm Charts provide a fast, repeatable, and consistent way of deploying and upgrading an entire Kubernetes environment.
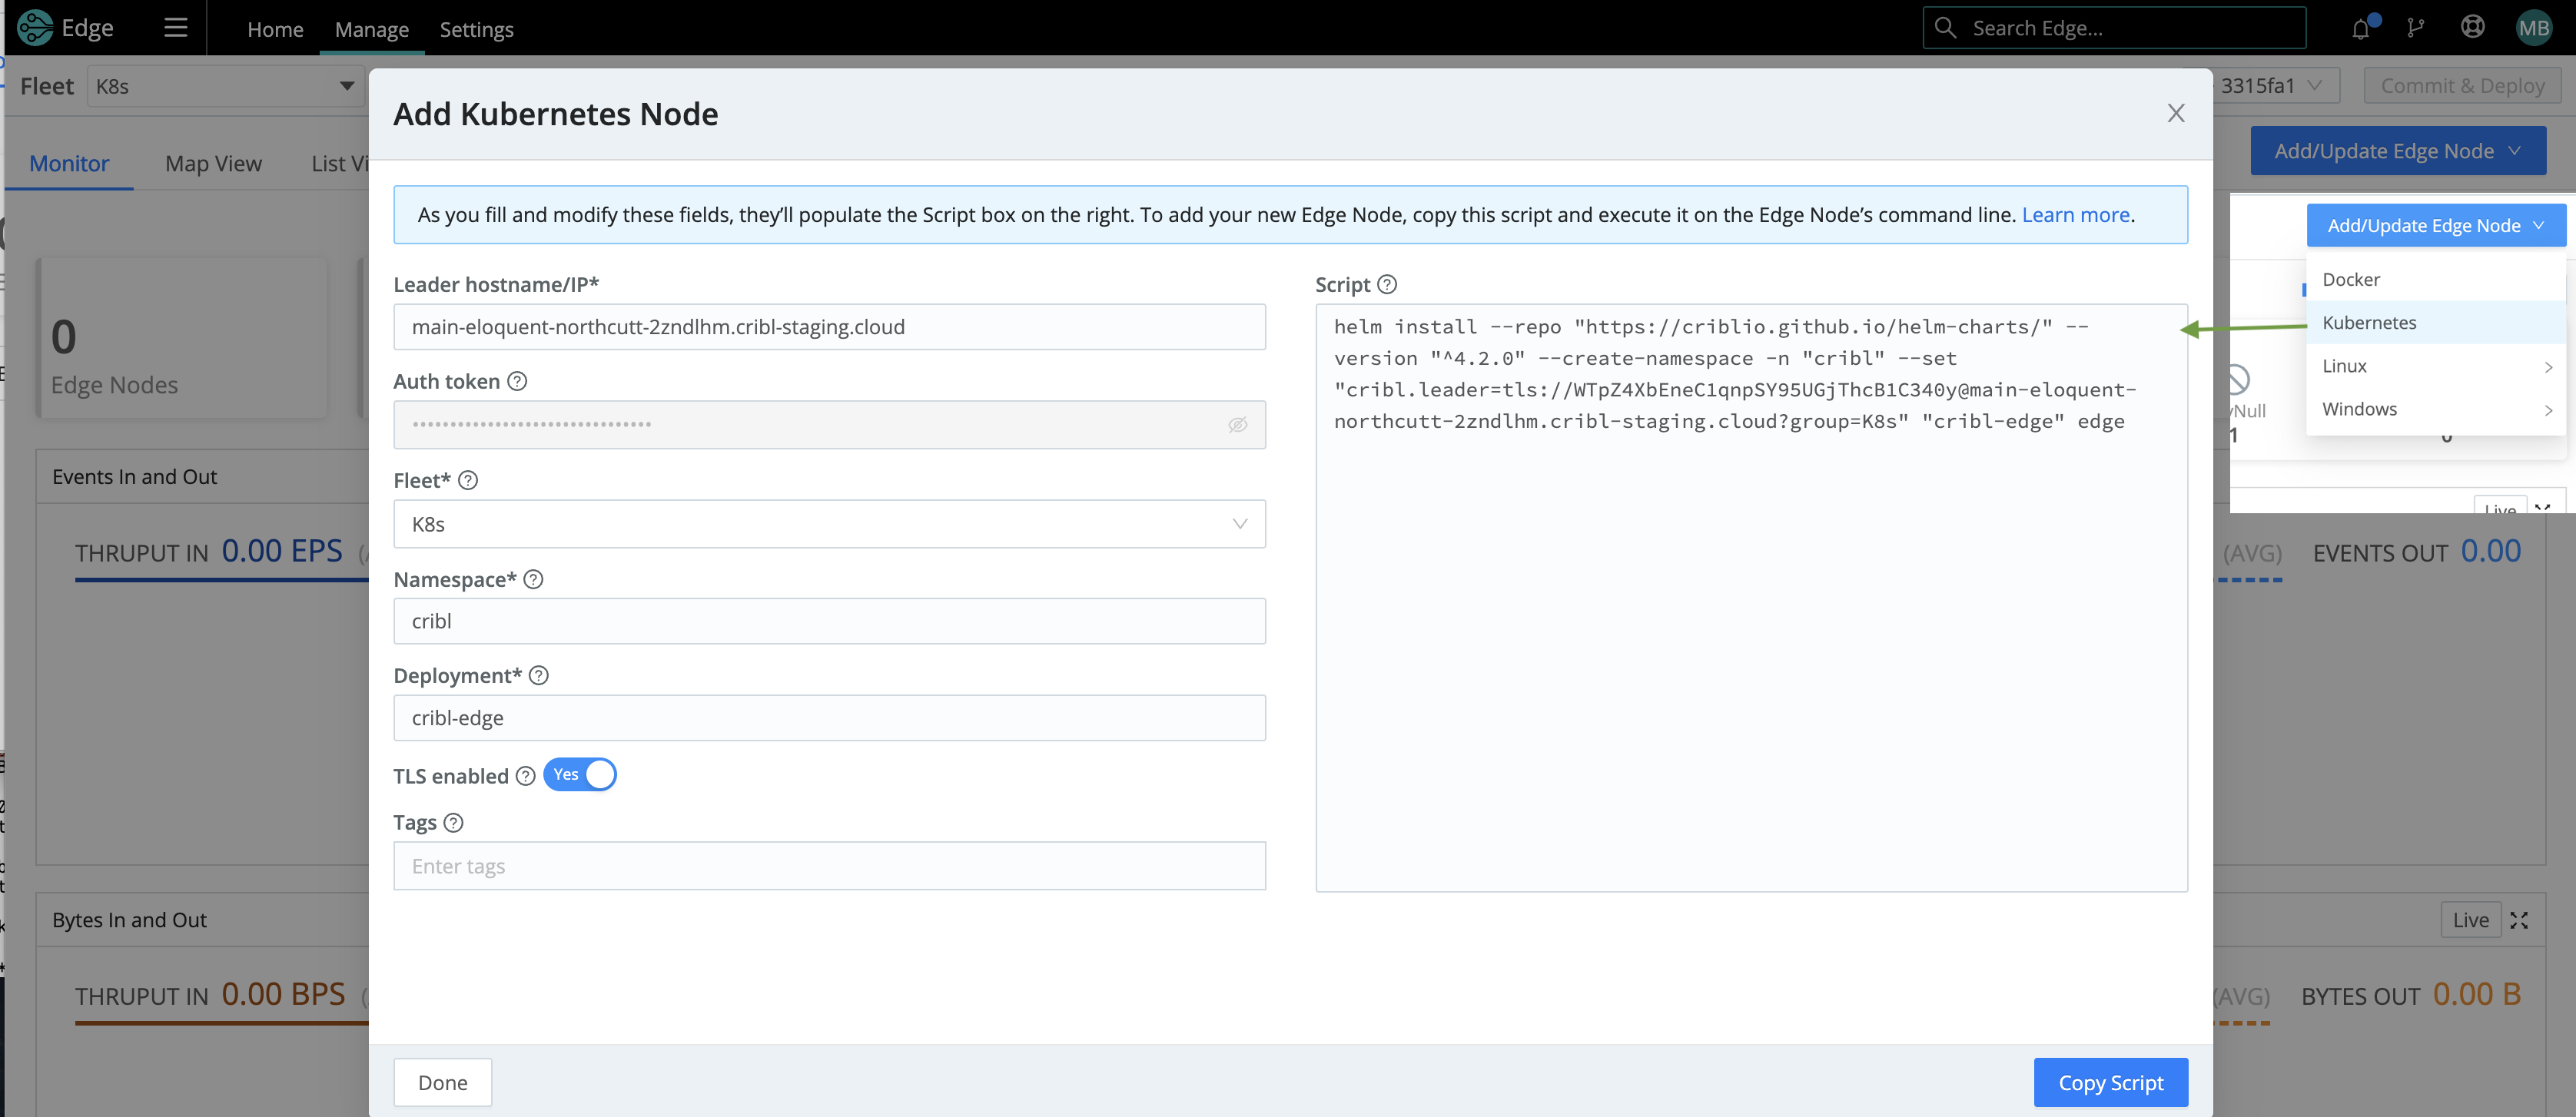
Next, bootstrap a new Edge Node on your Kubernetes Fleet using the Helm Script found in the UI. Copy/paste the bootstrap script for adding a Kubernetes node.
Below is a composite screenshot of adding an Edge Node via Kubernetes.
See Deploying via Kubernetes for details on installing Cribl Edge.
Environment Variables and Metadata
You can customize environment variables and metadata to modify (respectively) your Edge Nodes’ deployment and reporting.
Environment Variables
You can use the following environment variables to configure Cribl Edge via Kubernetes:
CRIBL_SERVICEACCOUNT_PATH- by default, set to:/var/run/secrets/kubernetes.io/serviceaccount.CRIBL_K8S_POD- the name of the Kubernetes Pod in which Cribl Edge is deployed.KUBECONFIG- set this for local testing.CRIBL_K8S_FOOTGUN- set totrueto enable resource-intensive, potentially risky modes of the Kubernetes Metrics and Kubernetes Logs Sources.CRIBL_K8S_TLS_REJECT_UNAUTHORIZED- set to0to disable certification validation when connecting to the Kubernetes APIs. When you disable this environment variable, all Kubernetes features (including Metadata, Metrics, Logs, and AppScope metadata) will tolerate invalid TLS certificates (i.e., expired, self-signed, etc.) when connecting to the Kubernetes APIs.
For details on other environment variables you can set for your Kubernetes deployment, see Environment Variables.
Metadata
You can customize the type of metadata collected at Fleet Settings > Limits > Metadata.
In Edge mode, all the Event metadata Sources are enabled by default. Leave the kube metadata set to allowed (by default).
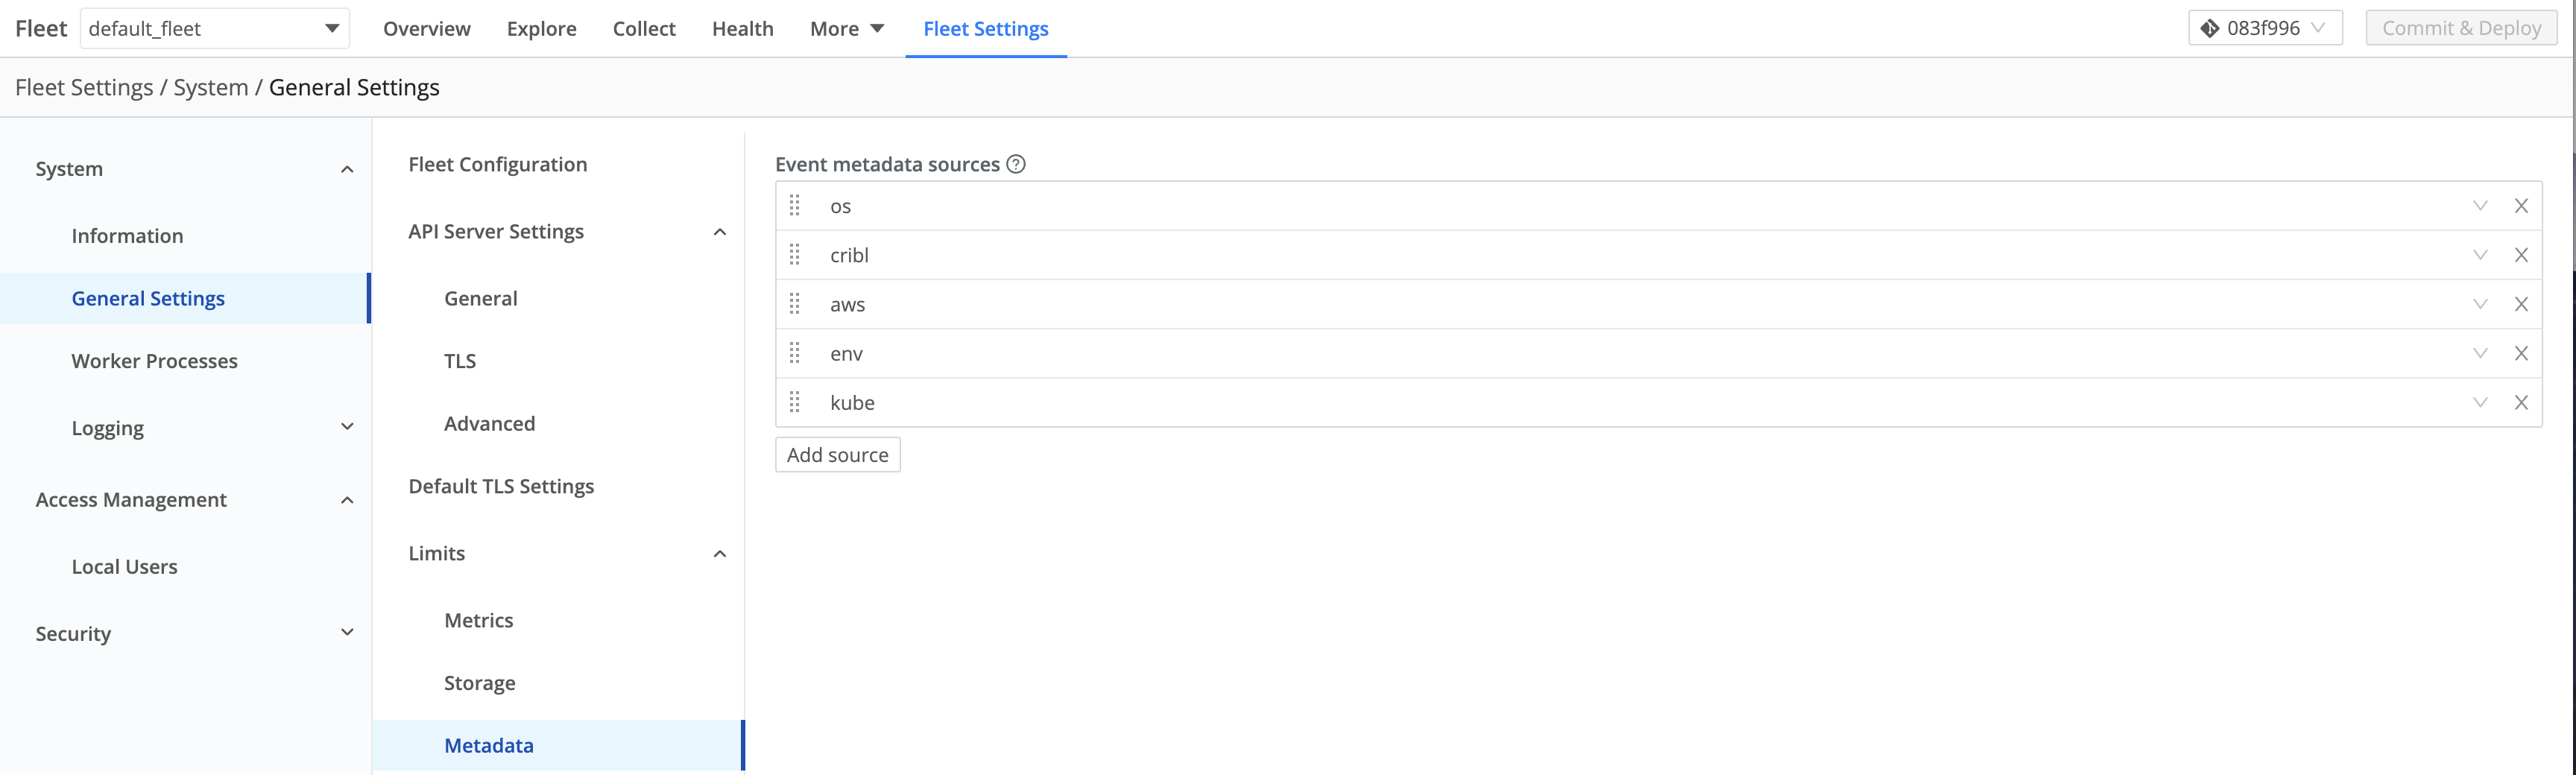
The kube metadata ( __metadata.kube property) reports details on a Kubernetes environment, including the node, Pod, and container.
For the __metadata.kube property to report details on a Kubernetes environment, some level of Kube API access is required if you want to use this metadata property.
KUBE_K8S_POD, an environment variable in the Cribl Helm Chart, is set by default to the name of the Pod where Cribl Edge is running by default. This adds the __metadata.kube property with information to report on the Nodes and Pods.
Configuring the Kubernetes Sources
For the Kubernetes Sources to work as designed, Cribl recommends deploying Cribl Edge as a Daemonset.
Kubernetes Logs Source
The Kubernetes Logs Source connects to the Kubernetes API and loads the lists of Pods on the node, on a configurable Polling interval.
Set the polling interval based on the expected start and stop intervals of pods in your environment. Higher volume log sources may require a faster polling interval to avoid rotating logs faster than we can collect them.
For example, if the container emits 1 MBps and rotates logs at 10 MB, the polling interval must be less than 10s, to prevent hitting the 10 MB rotation threshold twice in 10 seconds.
The Source then runs the Pods through the Filter Rules to determine which ones to report on. For example:
- Ignores Pods in the
kube-*namespace - !metadata.namespace.startsWith(‘kube-’) - Ignore all DaemonSets - metadata.ownerReferences[0].kind != ‘DaemonSet’
- Ignore Pods with specific Container names - spec.containers[0].name != ’edge'
Configure the Kubernetes Logs Source to collect the Standard output (stdout) and Standard error (stderr) log streams from each Pod deployed inside the cluster.
Optionally, you can filter and enrich incoming logs.
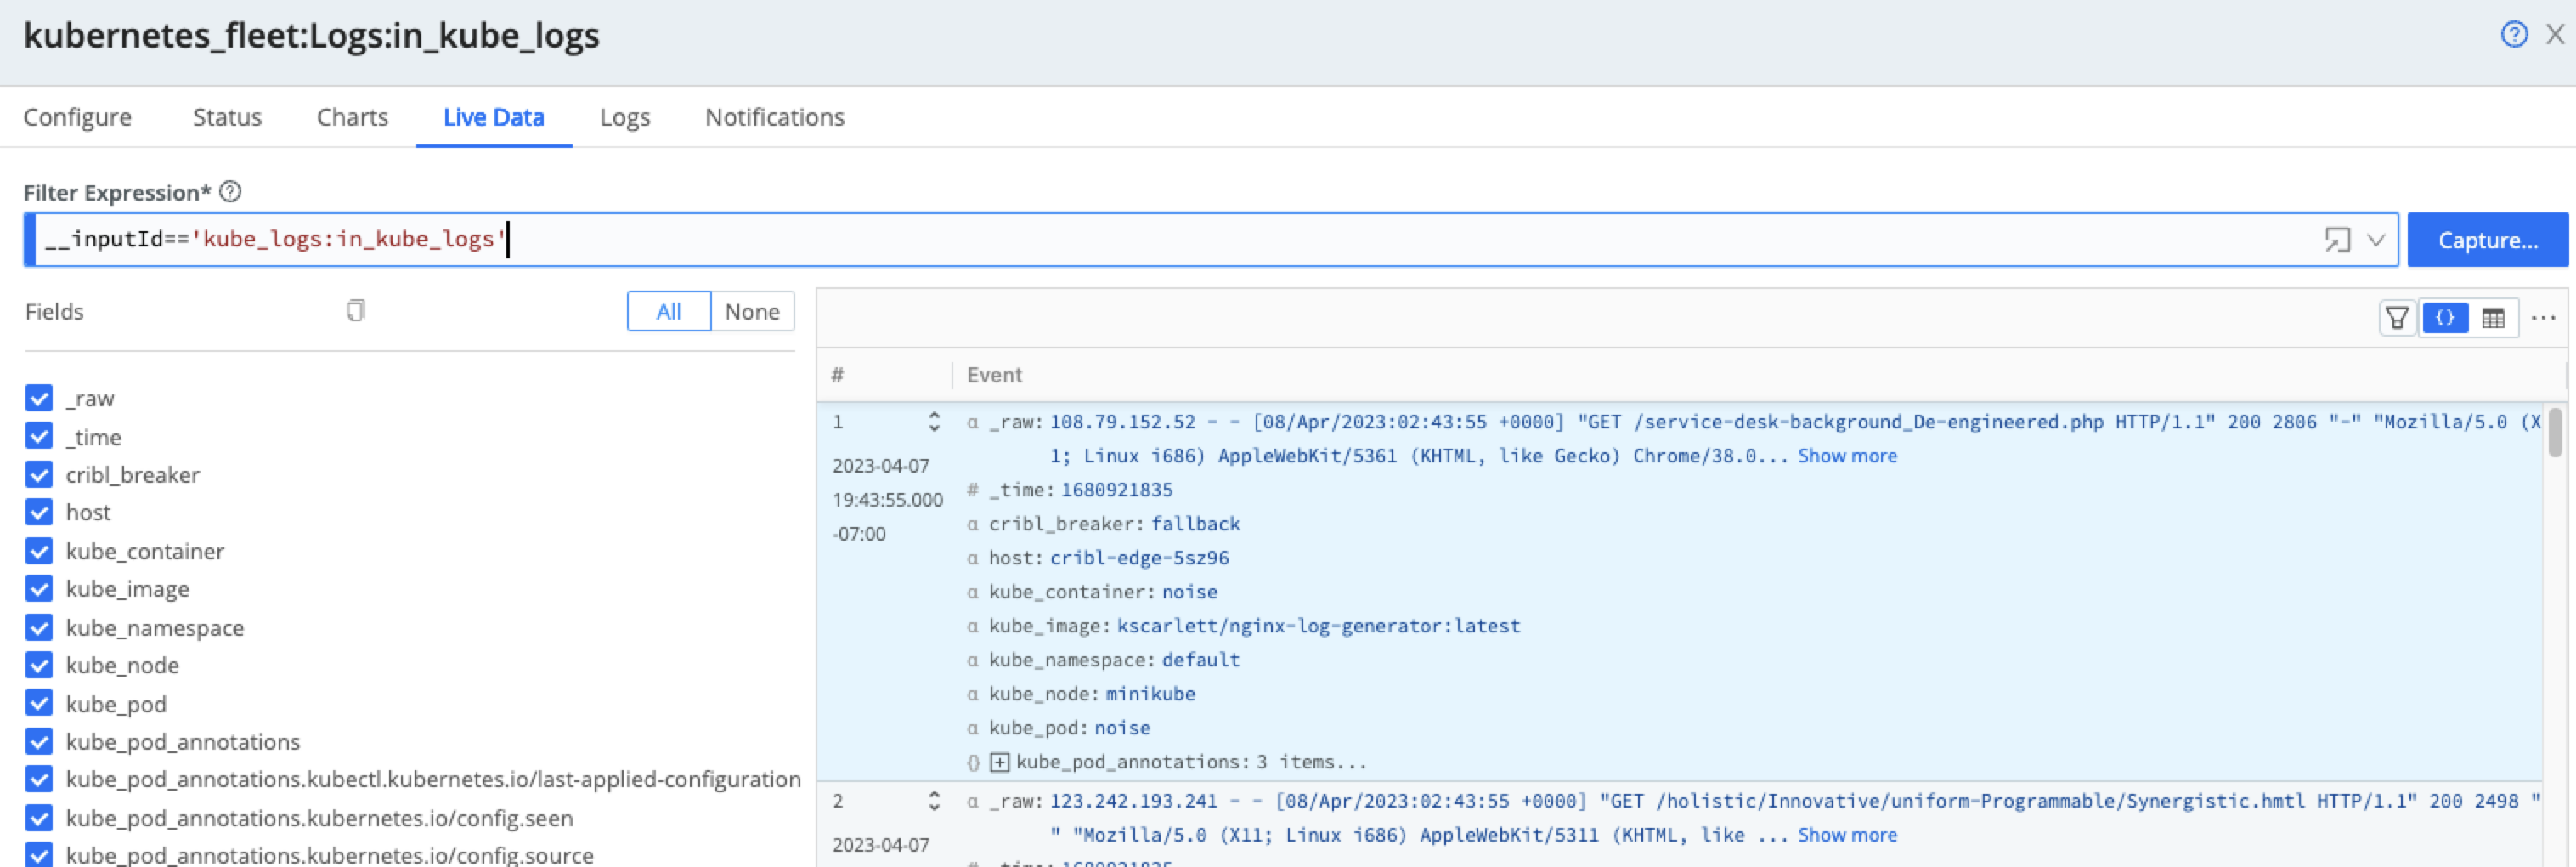
Below the Capture button, click the ellipsis (three dots or ...) and then enable the Show Internal Fields toggle to explore the __metadata fields forwarded from the Cribl Edge Nodes.These metadata fields show information about the Pod, Node, and Cribl environment where they were collected.

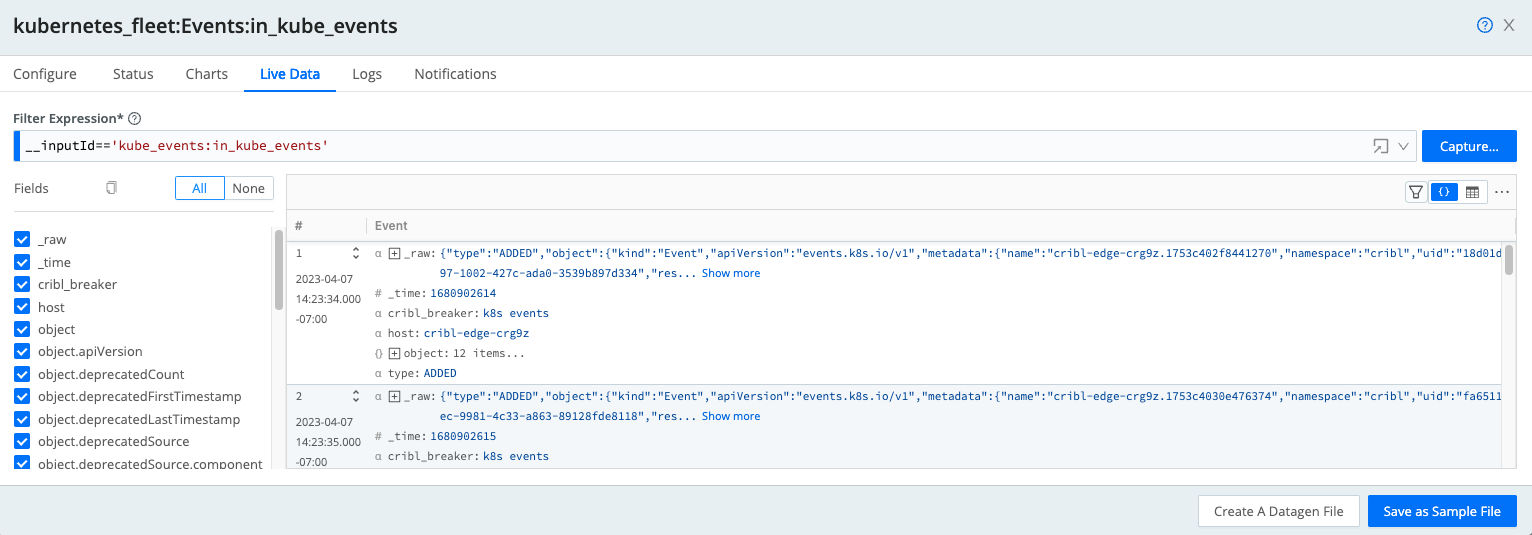
Kubernetes Events Source
Configure the Kubernetes Events Source to monitor state changes (such as Pod starts and jobs that fail to start) occurring on the Kubernetes cluster regarding workloads.
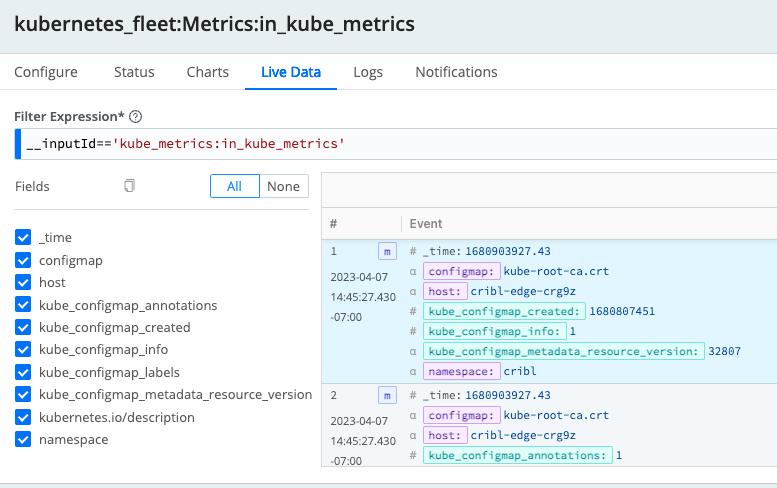
Kubernetes Metrics Source
Configure the Kubernetes Metrics Source to generate metrics periodically based on the status and configuration of a Kubernetes cluster and its Nodes, Pods, and containers.
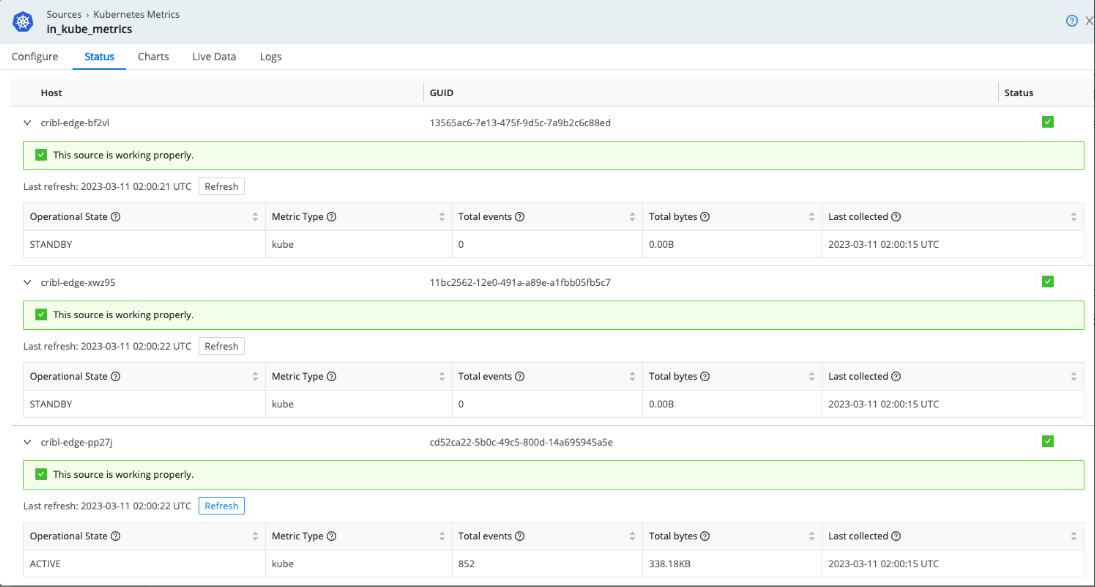
To avoid collecting the same metrics from multiple nodes, the Kubernetes Metrics Source uses an election method to collect metrics from only one node. The election happens every 5 minutes on all of the nodes, and the oldest node in the cluster wins.
To check the Source’s operational state, go to Status and expand the host details. The Operational State column shows either an Active or Standby state. Active indicates the Source is running or won the election. Standby means it’s waiting to be re-elected and not currently running.
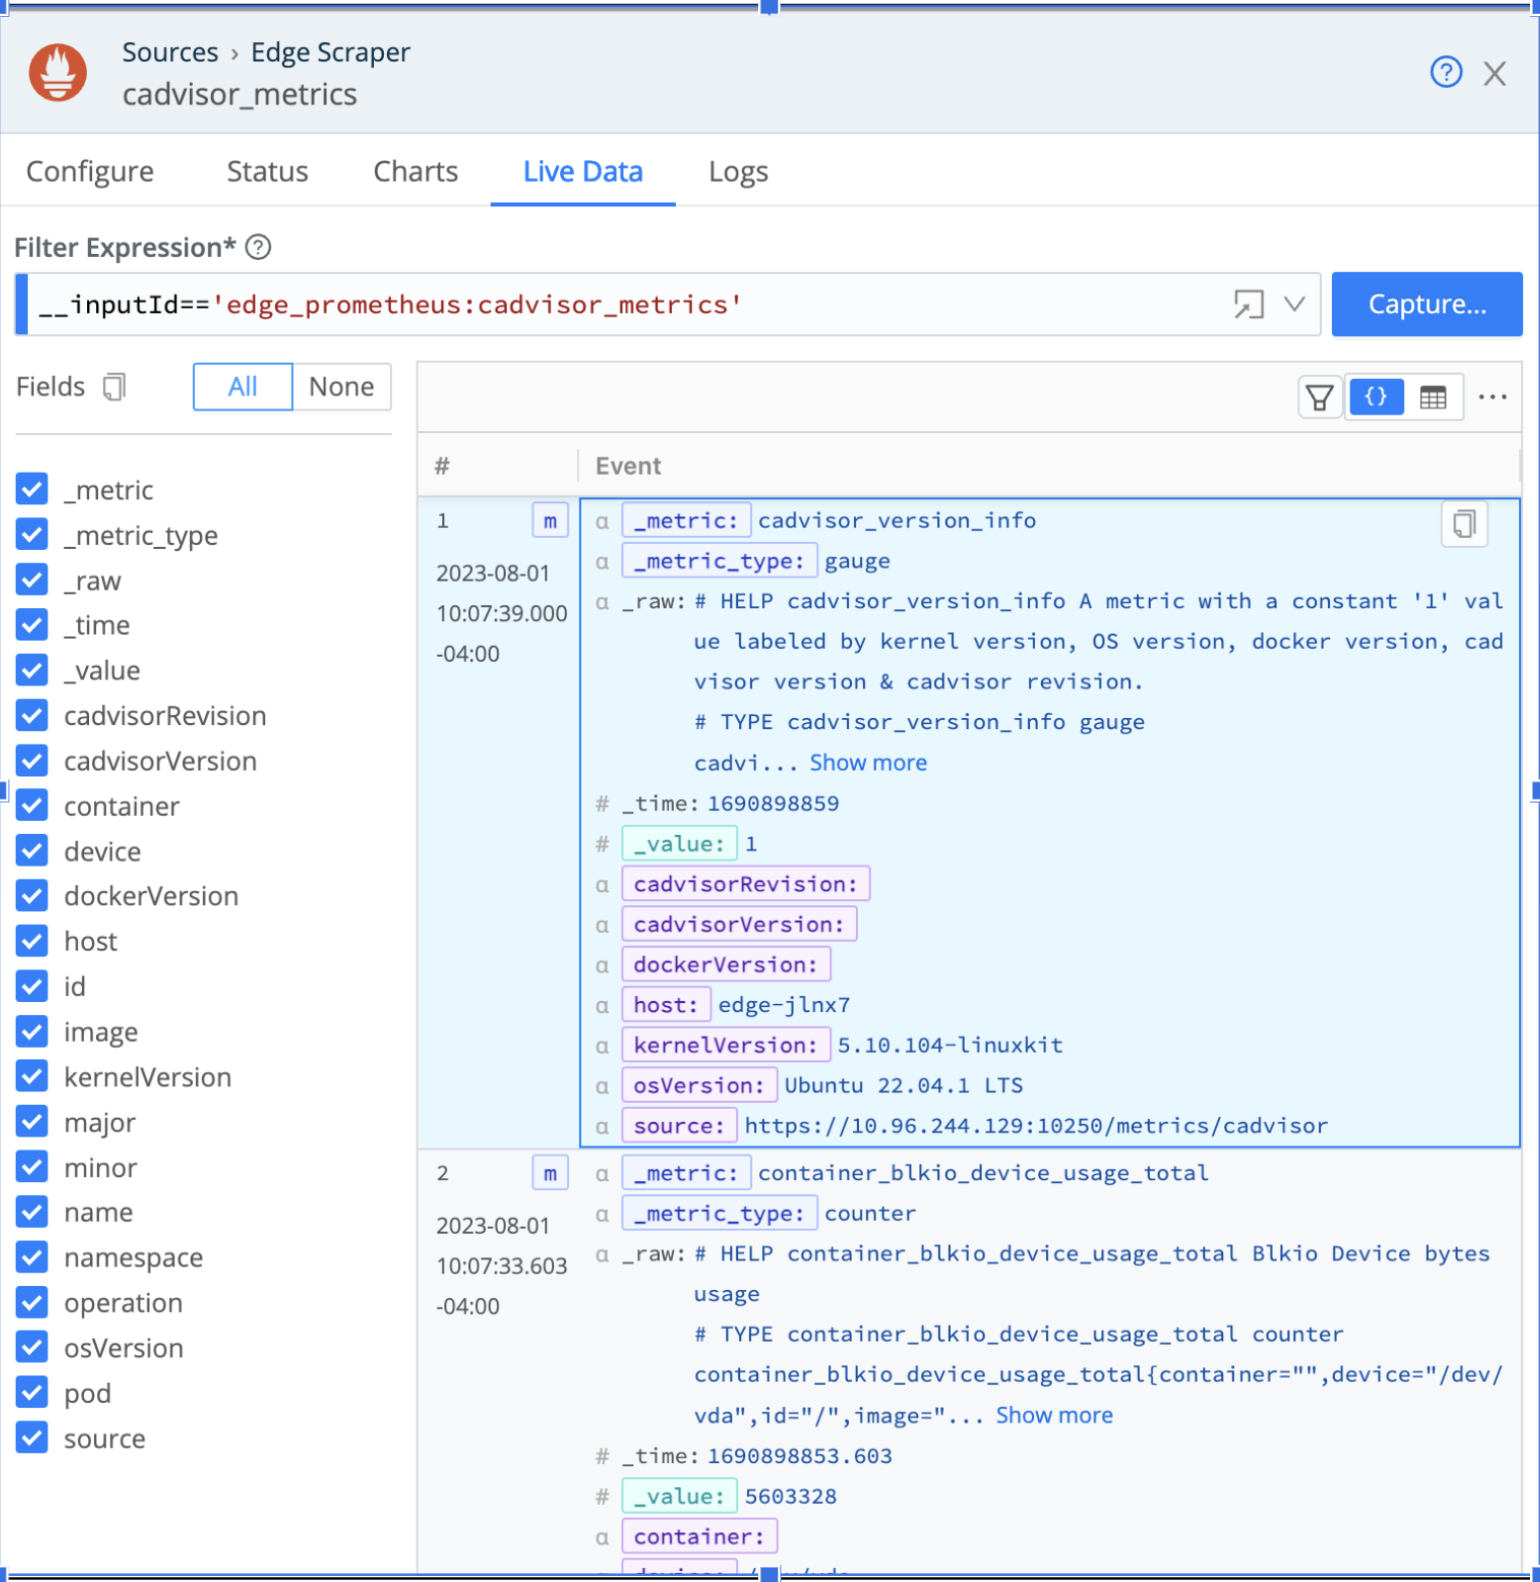
Prometheus Edge Scraper
You can also configure the Prometheus Edge Scraper to collect metrics from Pods and Nodes (as well as other Prometheus targets).
To collect Kubernetes metrics, Cribl Edge uses the /metrics and /metrics/cadvisor endpoints on the kubelet. This information gives us a really good idea of what’s going on on each Node and Pod. In addition, this Source supports Disk Spooling and allows Cribl Search to query the metrics.
Using the Prometheus Edge Scraper, you can discover and collect metrics in Kubernetes Clusters dynamically. There are two Kubernetes-specific modes of operation:
- Node: When configured to scrape Nodes, each Cribl Edge Node (Pod) will scrape from the configured port on every deployed Node in the DaemonSet. Use this to scrape endpoints on the Kubelet and other node-local interfaces.
- Pods: When configured for Pod scraping, a single Edge Node will be elected to scrape the metrics from the discovered endpoints.
Configuring Your Destinations
For this example, we’re going to use Prometheus and Loki for receiving metrics, logs, and events from Cribl Edge.
Loki stores log contents unindexed, relying on labels and timestamps that are indexed to form event streams. The method is similar to how data would be stored in a bucket or index on other systems.
Configure the Loki Destination to send log events to Grafana’s Loki log aggregation system.
Similarly, Prometheus uses names, labels (dimensions), and numerical values. You can then create dashboards to visualize the change in data points over time using these time series.
Configure the Prometheus Destination to forward the Kubernetes Metrics to a Grafana dashboard (for our purposes).
Configuring the Pipelines
We will create two Pipelines to process the data as it routes to the configured Destinations.
Connecting Logs and Events
As previously mentioned, Loki stores logs based on labels. This is a great way to organize your stored data so that retrieval is easier when looking for specific log entries. Configure a Pipeline with an Eval Function to add the labels to the __labels field.
By default, no labels are defined for the Loki Destination. Because Loki requires at least one label, Cribl will automatically add a default label source with the value cribl_${__inputId}.
Once you create a Pipeline, add an Eval Function with the following config in the Evaluate Fields section:
| Name | Value Expression |
|---|---|
__labels | {} |
__labels.namespace | kube_namespace |
__labels.pod | kube_pod |
__labels.container | kube_container |
Next, go to Manage > Collect to attach the Kubernetes Logs Source to the Loki Destination, using the configured Pipeline as the connection.
You can connect the Kubernetes Events Source directly to your configured Loki Destination with the default Passthru Pipeline connection.
Connecting Metrics
You can modify the default prometheus_metrics1 Pipeline to change a few metadata fields and use it to connect to the Prometheus Destination.
In the prometheus_metrics1 Pipeline, expand the Eval Function with the following config in the Evaluate Fields section:
| Name | Value Expression |
|---|---|
job | job || ‘cribl’ |
instance | __metadata.kube.node.metadata.name || host |
Next, go to Manage > Collect to attach the Kubernetes Metrics Source (or Prometheus Edge Scraper) to the Prometheus Destination, using the prometheus_metrics1 Pipeline as the connection.
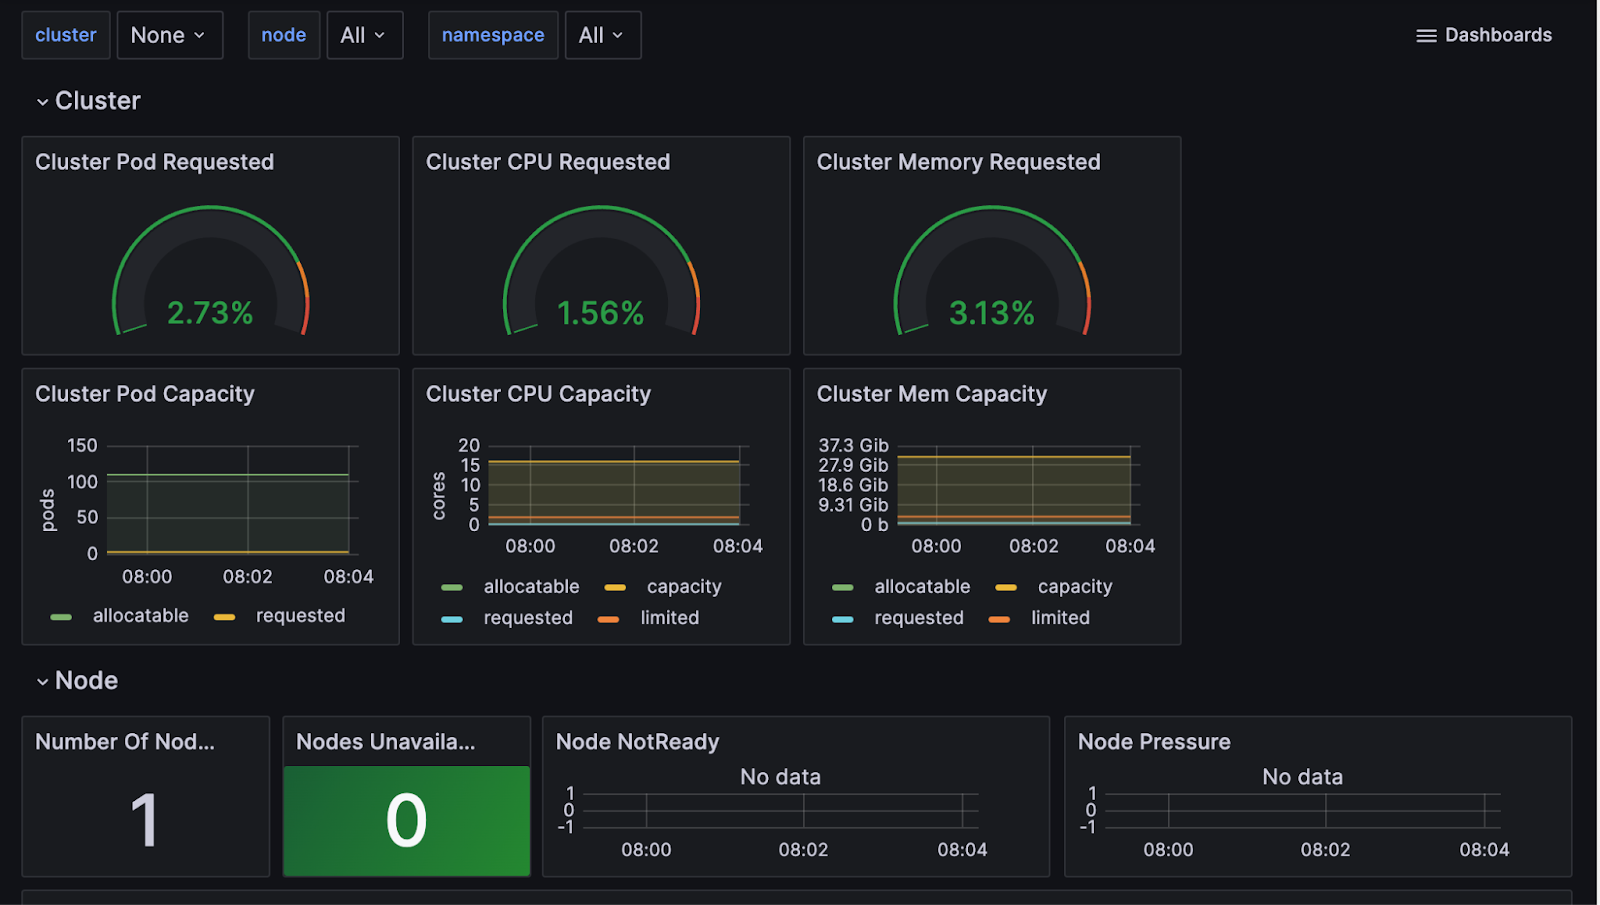
Visualize the Data in Grafana
Navigate to your Grafana Cloud instance, and select Explore on the left panel to review the Node metrics. Selecting metrics and running the query will produce a chart and table of metric events that can be added to new or existing dashboards for analysis.
If you are missing some expected metrics, you might need to adjust the variables in your Grafana Cloud instance. For details, see Grafana’s Variables topic.
Use Grafana’s Filter option to browse the dashboards for your Prometheus data and Loki Logs. Below is a sample dashboard.