


These docs are for Cribl Edge 4.6 and are no longer actively maintained.
See the latest version (4.17).
Exploring Cribl Edge on Linux
The Cribl Edge UI offers a centralized view to manage, configure, and version-control your Edge Nodes. It also endows you with teleport-to-the-edge superpowers for locally previewing and validating your configurations. Here’s a quick tour of the Cribl Edge UI in distributed mode.
Accessing Cribl Edge
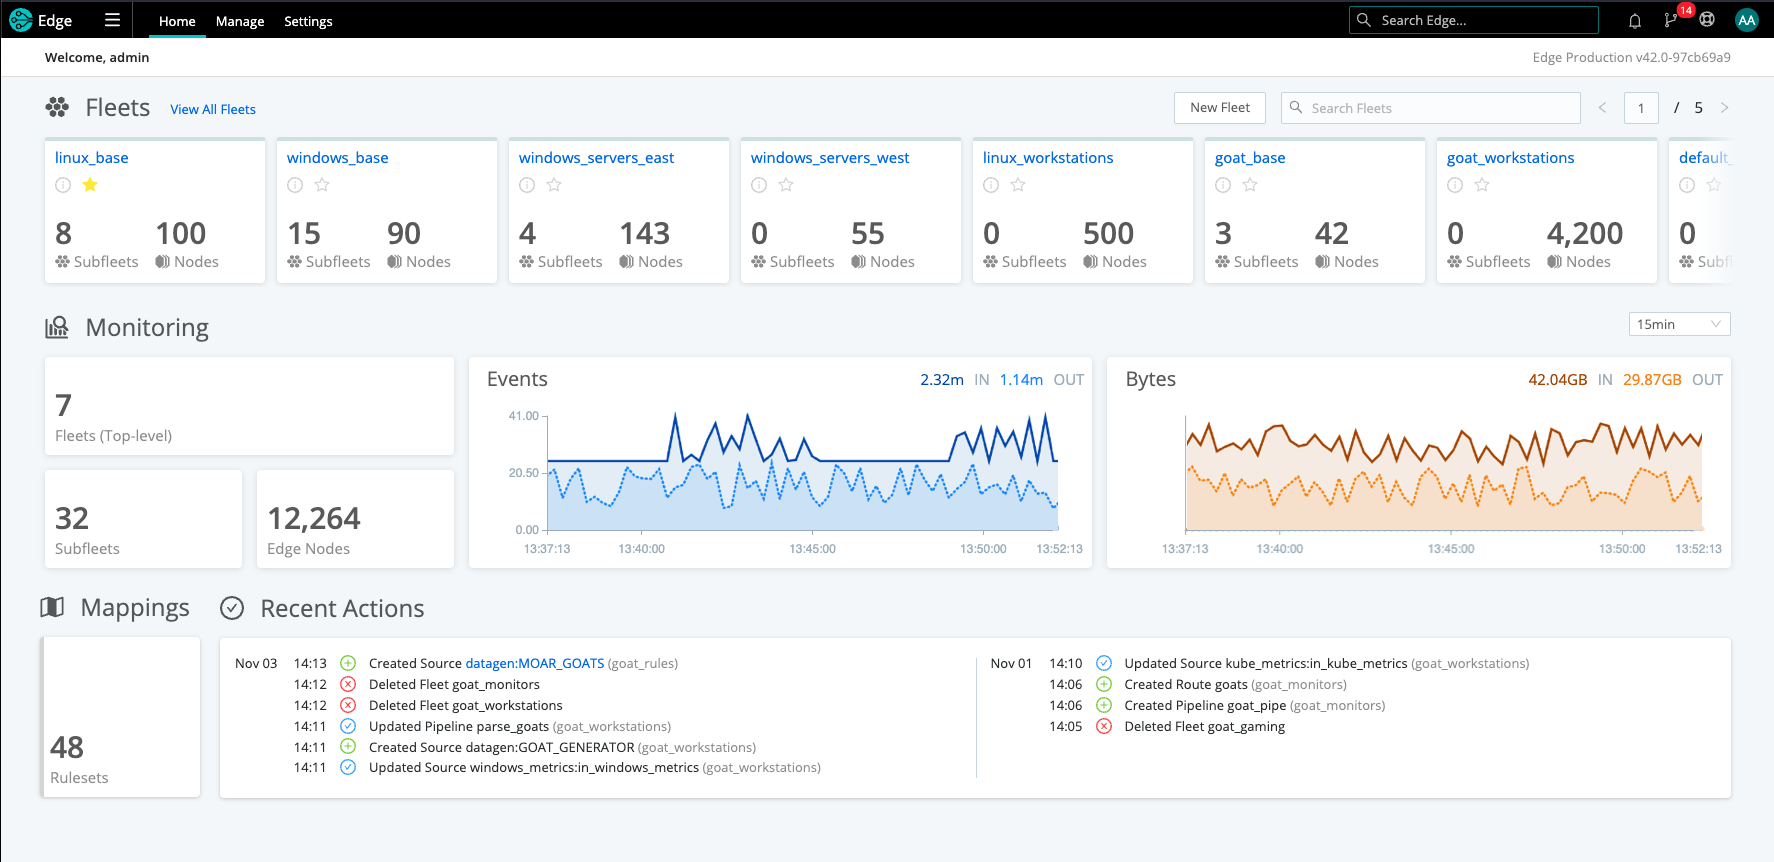
When you first log into Cribl Stream/Edge (single-instance or distributed), you’ll see tiles that prompt you to choose between two roads diverging in a yellow wood the Stream versus Edge UIs. The Edge tile displays basic configuration details, including the number of Fleets, Subfleets, Edge Nodes, and events and bytes over time. Click Manage to start.
Fleets Overview
On the Cribl Edge Home tab, you can access your configured Fleets and a summary of your Cribl Edge environment, highlighting the aggregate data for all Fleets, Subfleets, Edge Nodes, and Mappings. The charts display information about traffic in and out of the system.
Select Manage from the top nav to view the Fleets Landing page. Here you can access the tabs for more information about your Fleets (and Subfleets), Edge Nodes, Mappings, Notifications, and Logs.
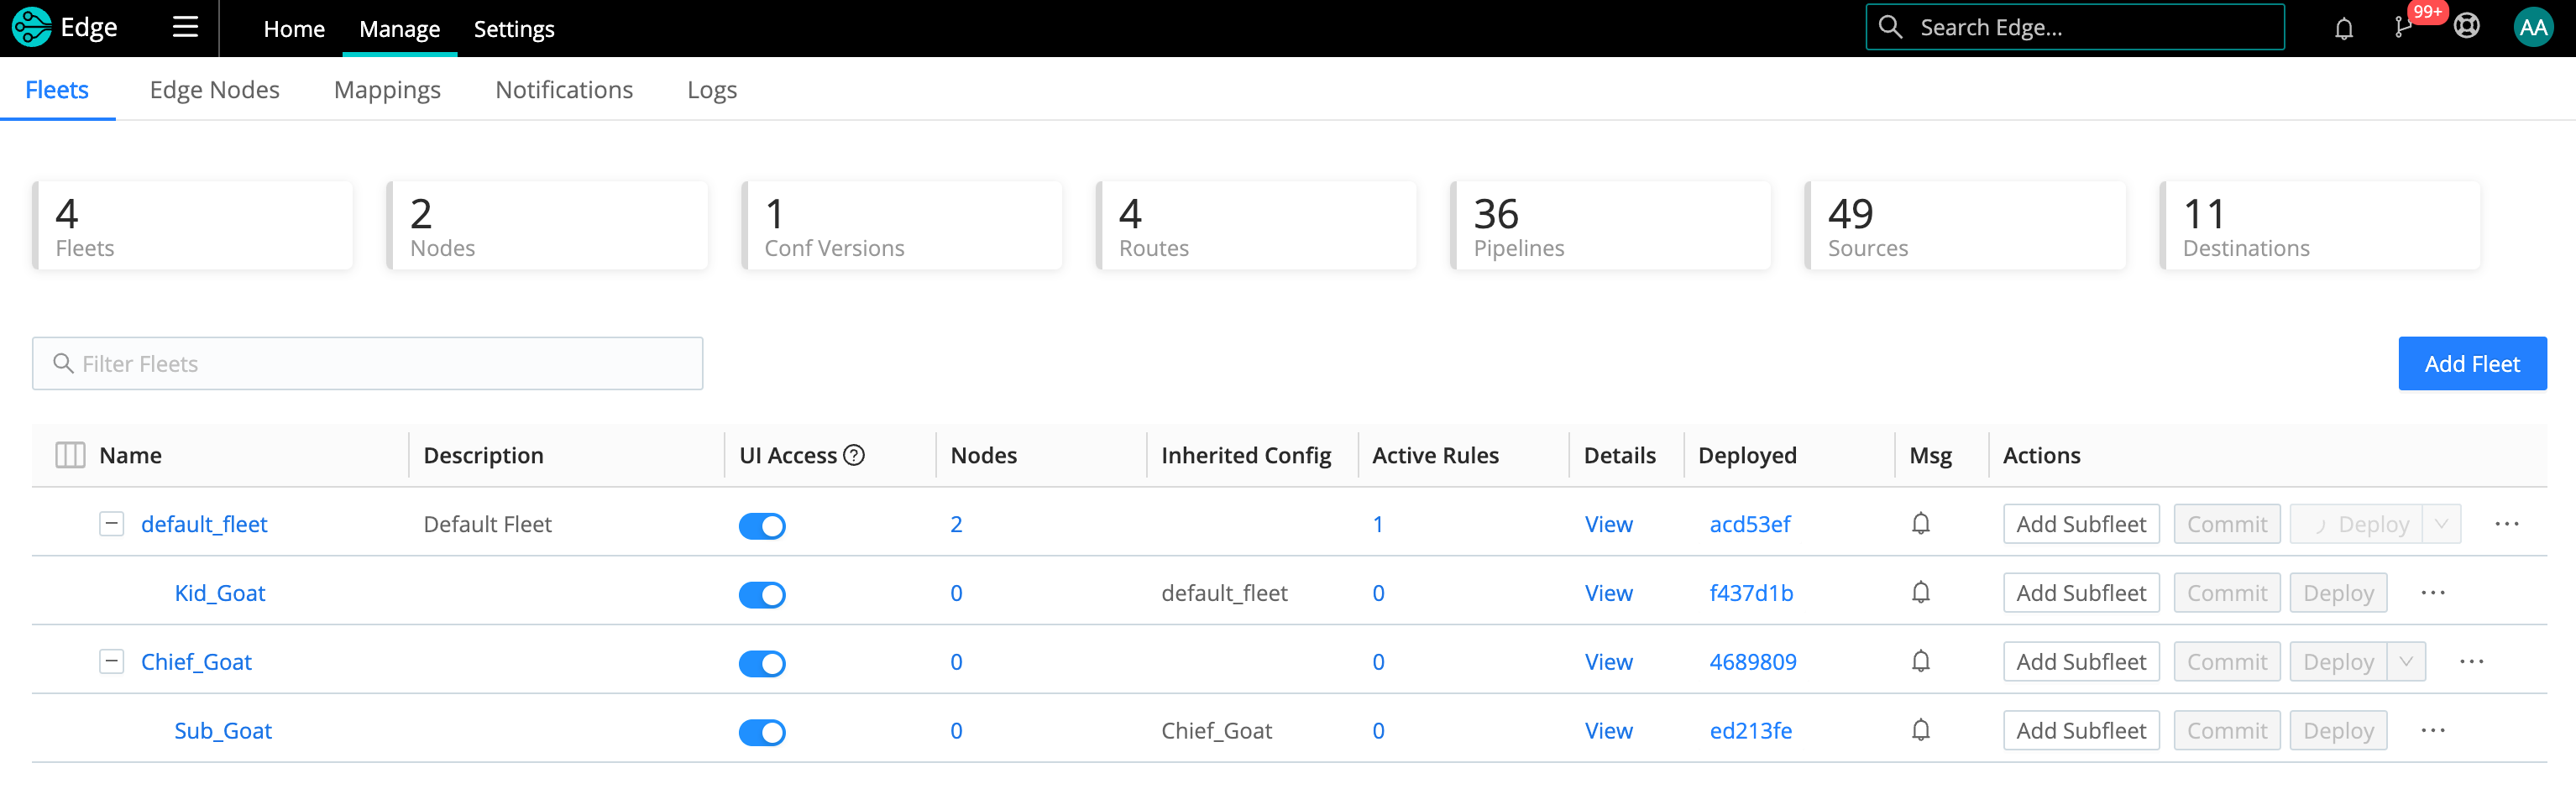
The Manage Fleets page gives you access to more information about your Fleets (and Subfleets), Edge Nodes, Mappings, Notifications, and Logs.
You can click a Fleet link to isolate individual Fleets, or use the Search bar to locate your Fleet.
Fleet Landing Page
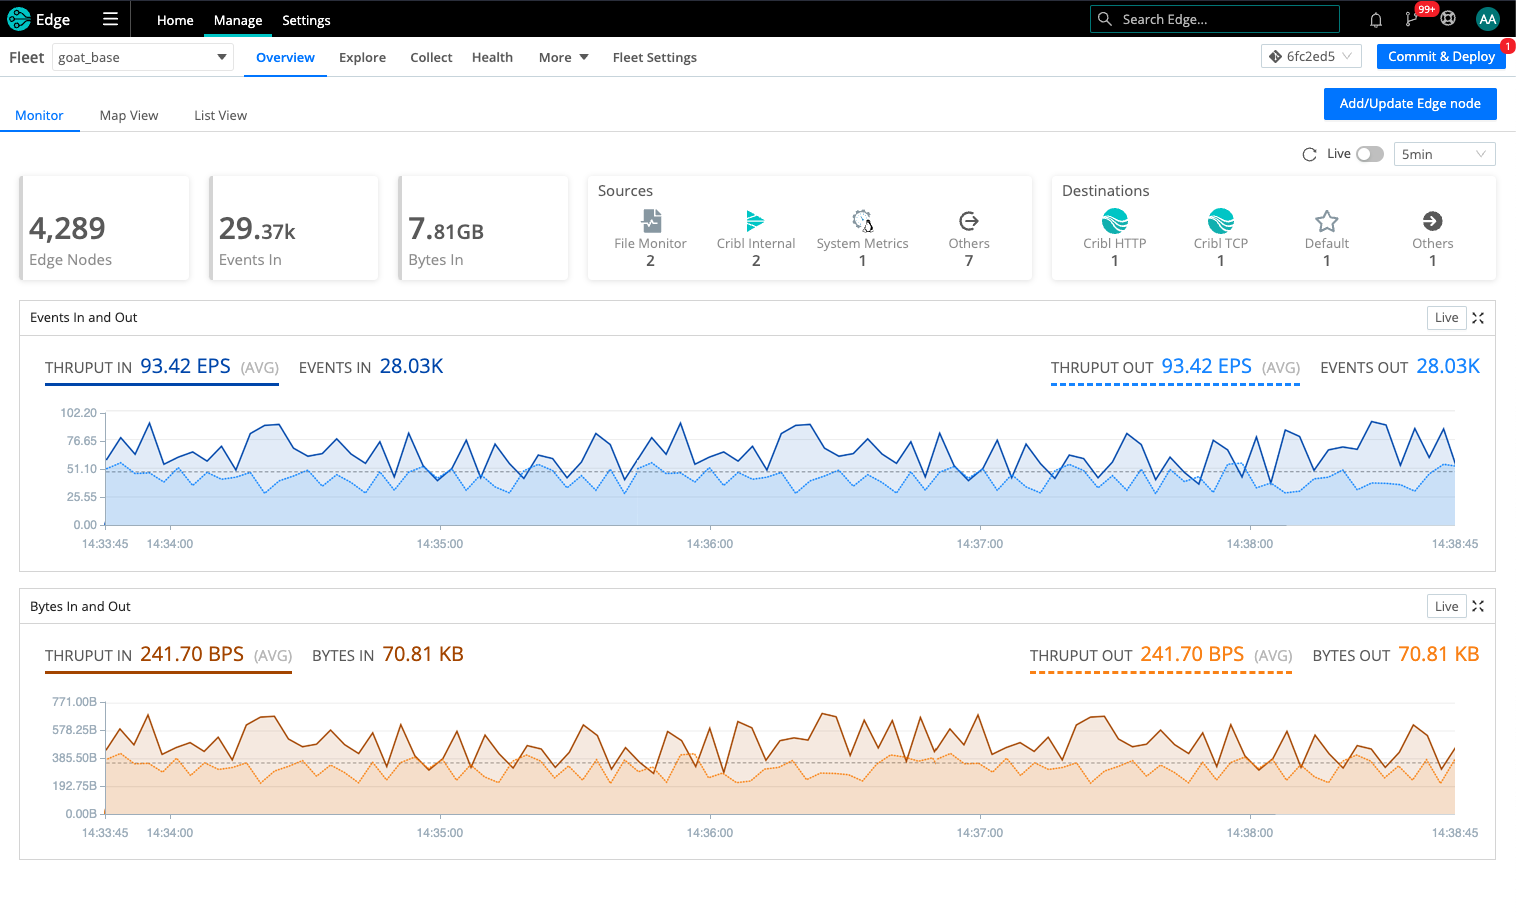
The Fleet’s landing page highlights information about your configured Edge Nodes. The following information is displayed across the top.
Number of Edge Nodes: How many Edge Nodes are configured in this Fleet.
Events In: Total number of Events in the last 5 minutes of data collected. You can change the display’s granularity from the default last 5 min, selecting a variety of time ranges from 1 min up to 1 day. (The latter covers the preceding 24 hours, and this maximum window is not configurable.)
Bytes In: The uncompressed amount of data in the last 5 minutes of data collected. You can change the display’s granularity from the default last 5 min, selecting from a variety of time ranges from 1 min up to 1 day. (The latter covers the preceding 24 hours, and this maximum window is not configurable.)
Sources: List of configured Sources.
Destinations: List of configured Destinations.
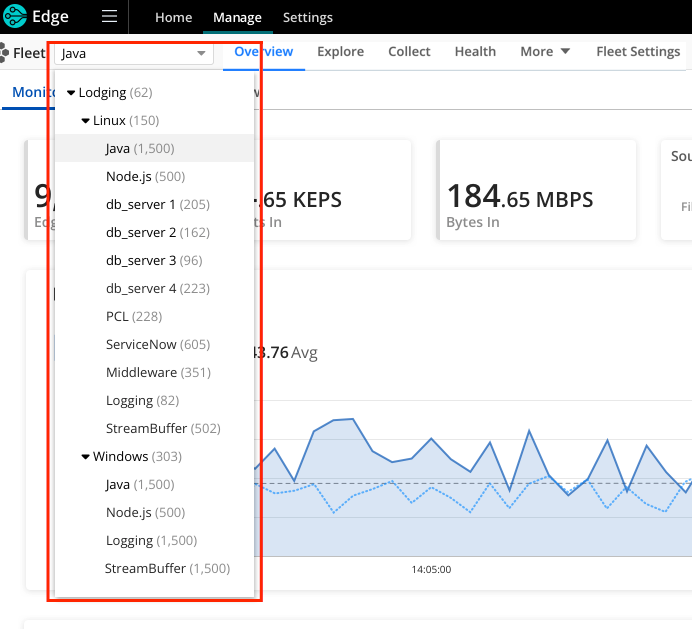
Select the Fleet dropdown (top right) to see a hierarchical list of all your Fleets and Subfleets.
Fleet Map View
Map View: Here, a query builder allows you to display metrics from the Edge Nodes in the Fleet. You can select from different aggregations in the Chart field, different metrics in the Measure field, and the time window in the During field.
The metrics that appear in the Measure list depend on the option selected in Fleet Settings > Limits > Metrics under Metrics to send from Edge Nodes. The metrics total.in_bytes, total.in_events, total.out_bytes, and total.out_events always appear in the list; the display of any other metrics depends on what the Edge Nodes are sending to the Leader. To learn more about these metrics options, see Controlling Metrics.
A hexagon-based map view displays the resulting metric combination for each of your Edge Nodes. Hovering over on one of the hexagons displays the Edge Node’s GUID.
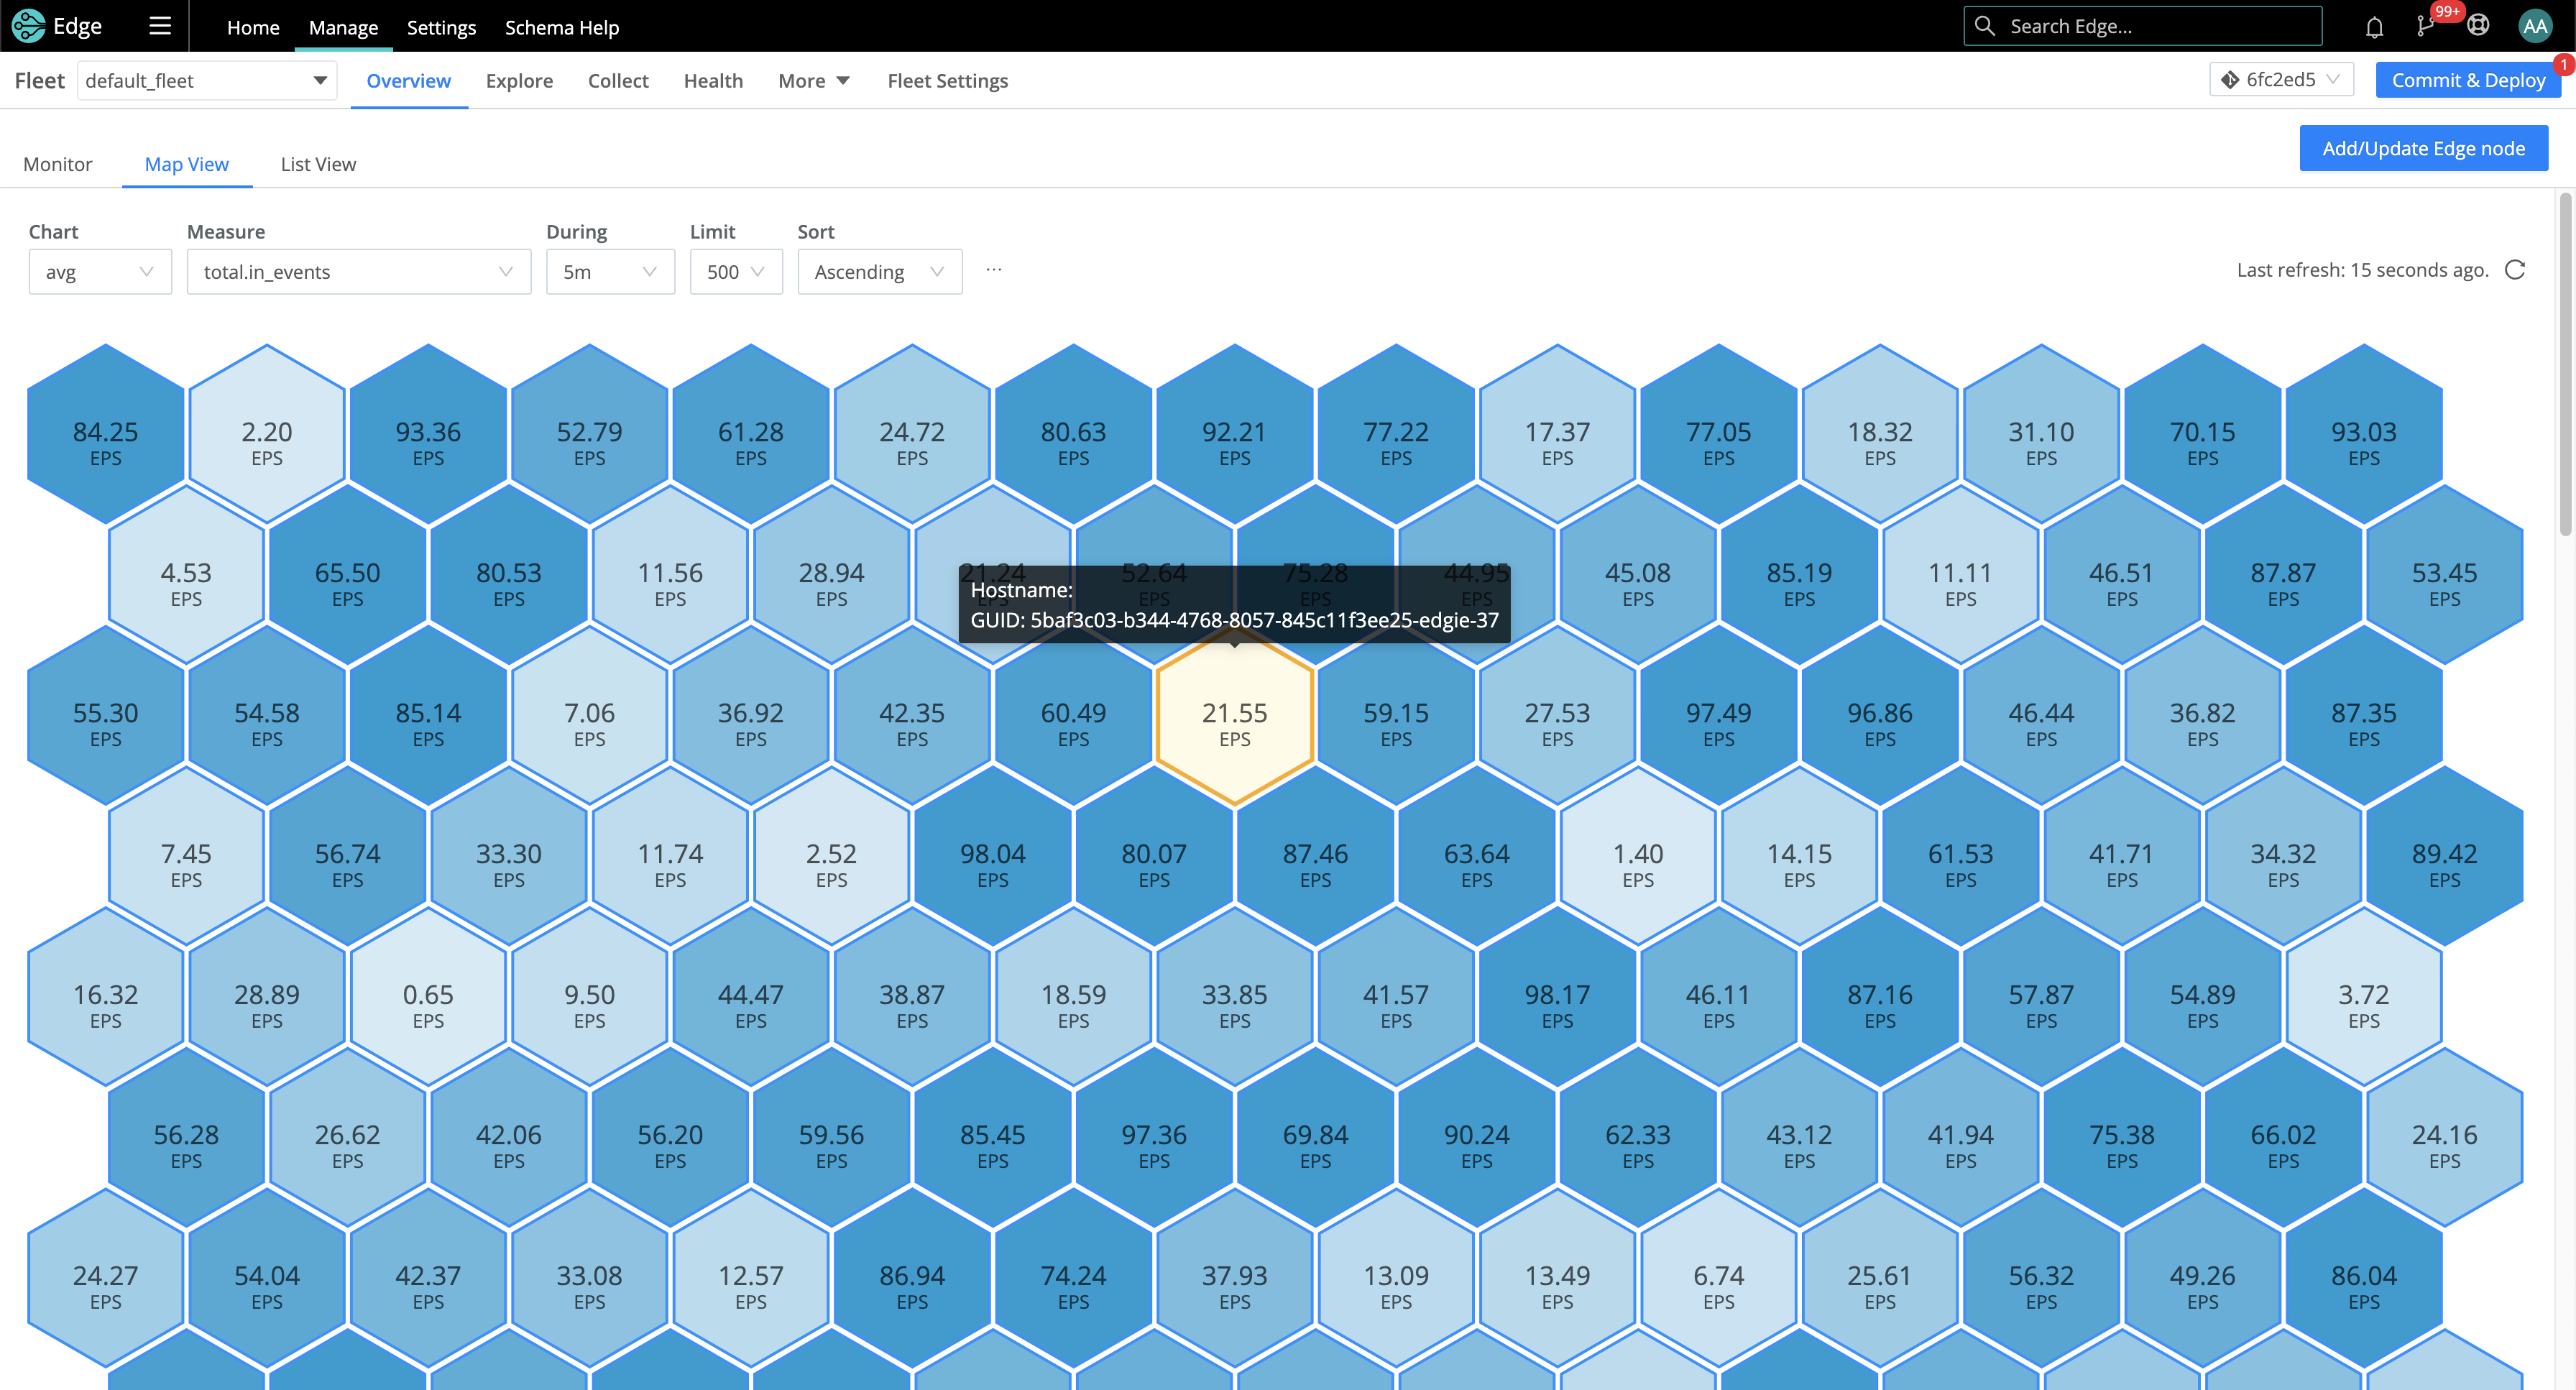
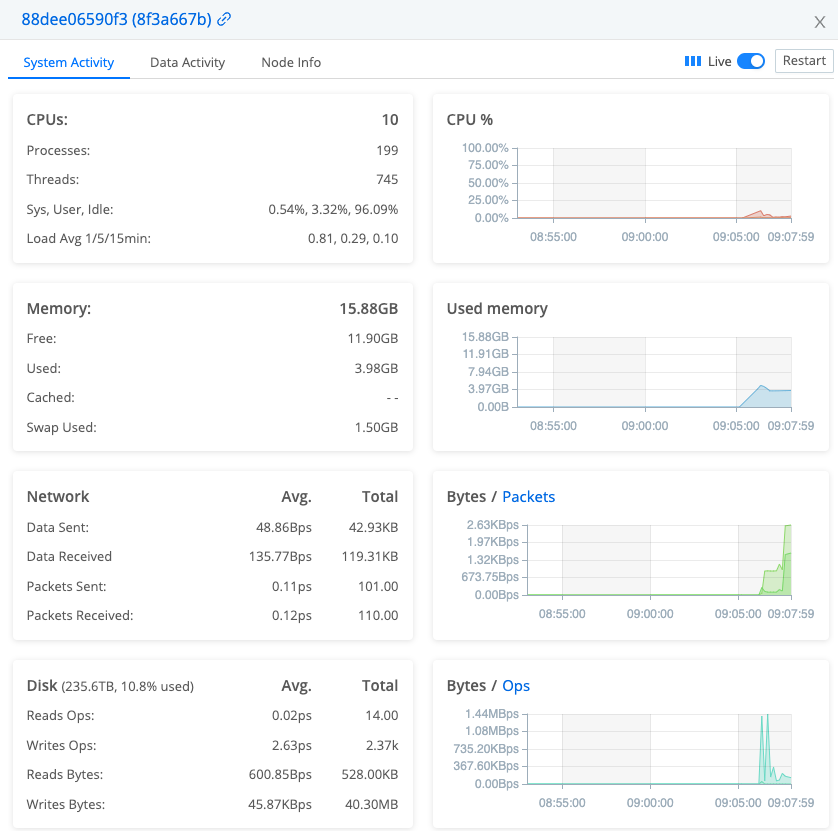
Clicking any of the hexagons displays a modal providing details on the Edge Node, similar to teleporting into it, with the option to Restart the host. The System Activity tab displays details about the host’s CPU, memory, network, and disk operations.
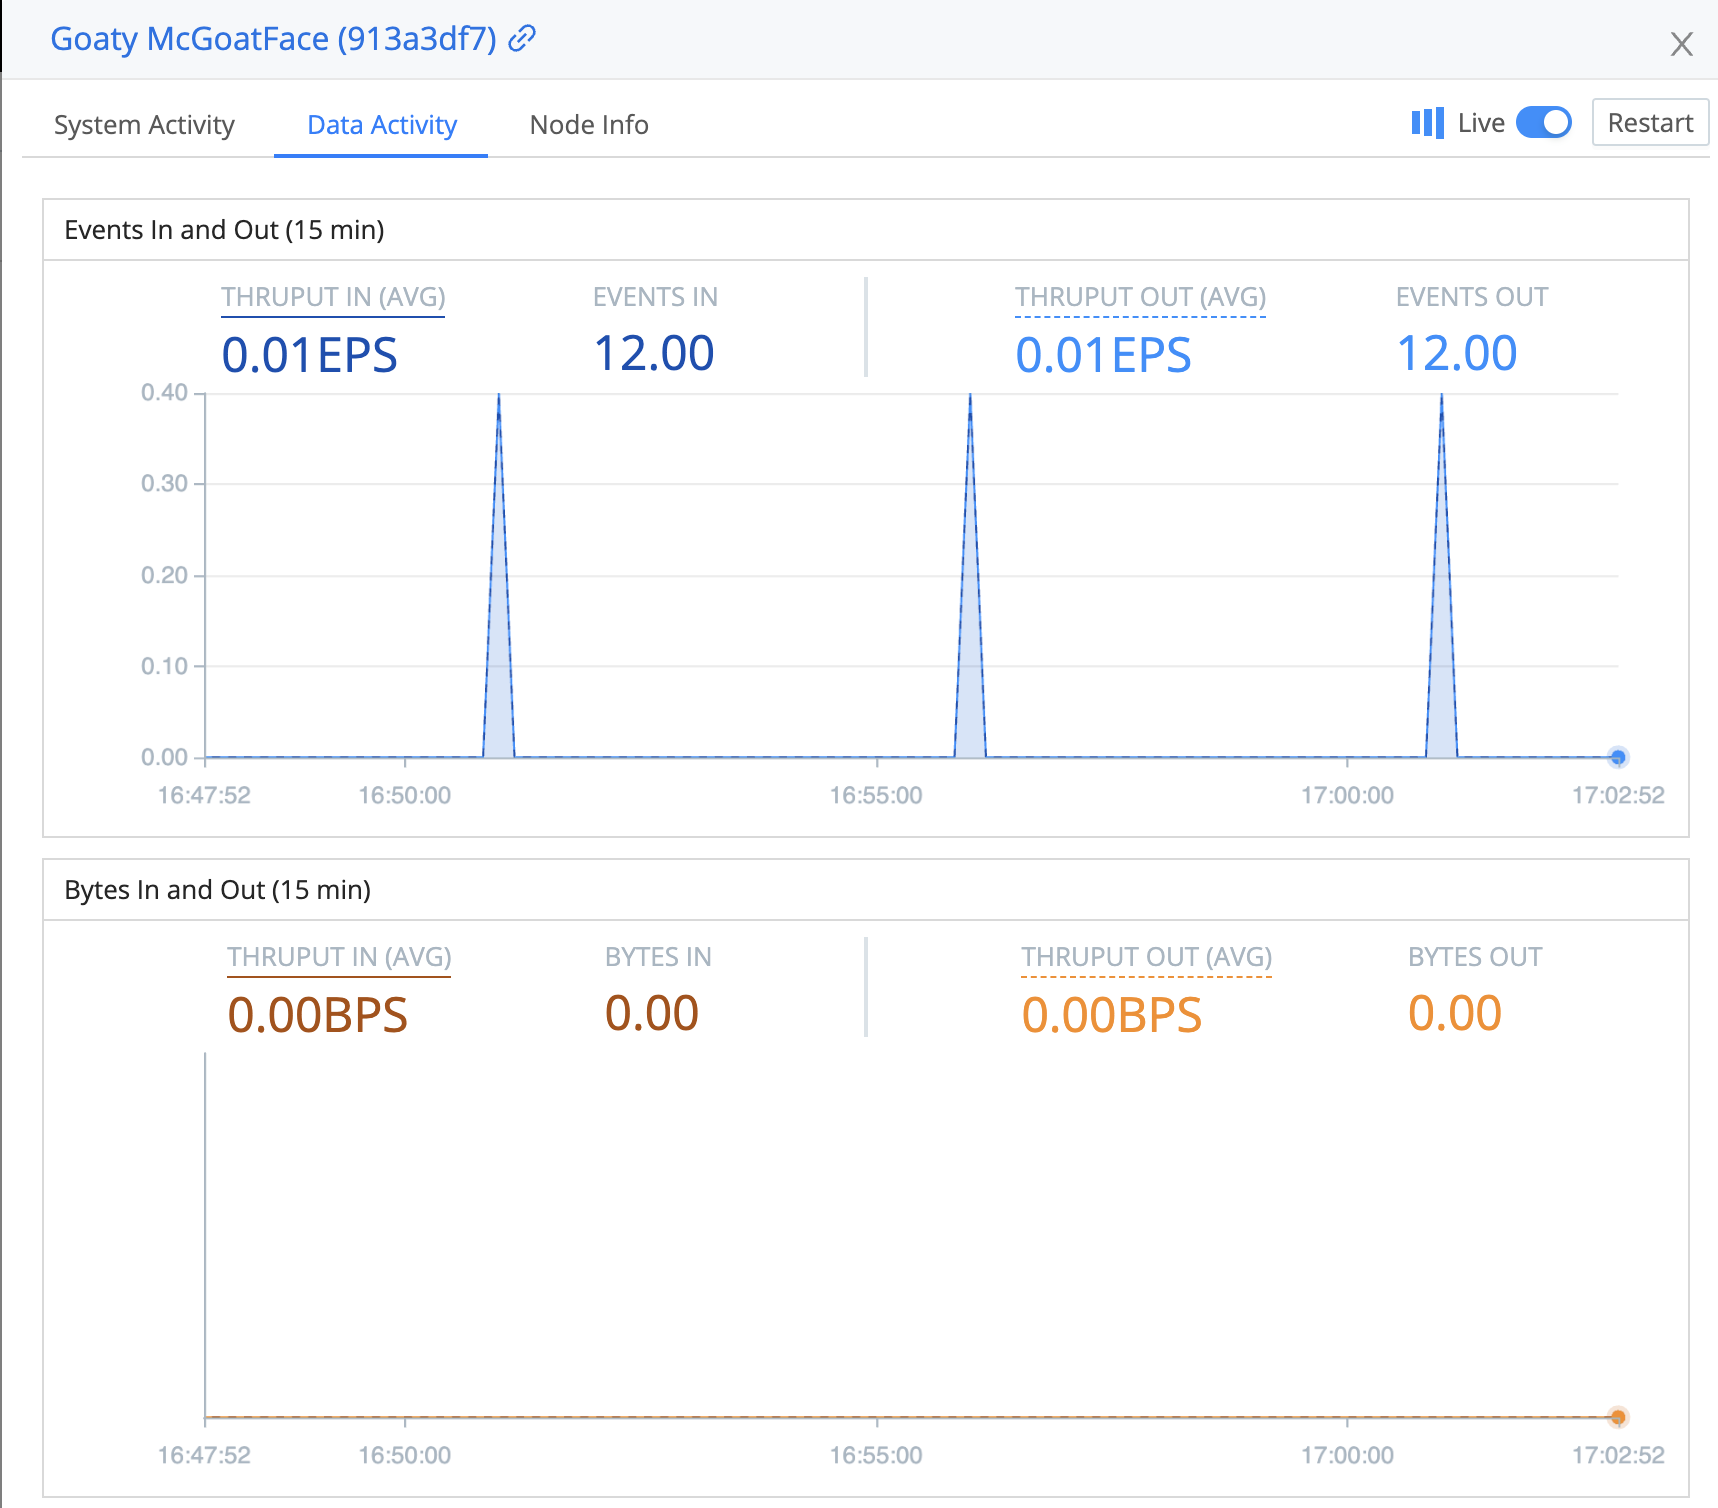
The Data Activity tab offers a view into the data flowing through the Edge Node.
The Node Info tab offers Host/OS level information with a snapshot of the latest Heartbeat captured.

Fleet List View
The List View tab displays a list of all the systems in the Fleet. This also serves as the “transporter room,” allowing you to teleport into each of the Node’s interfaces.
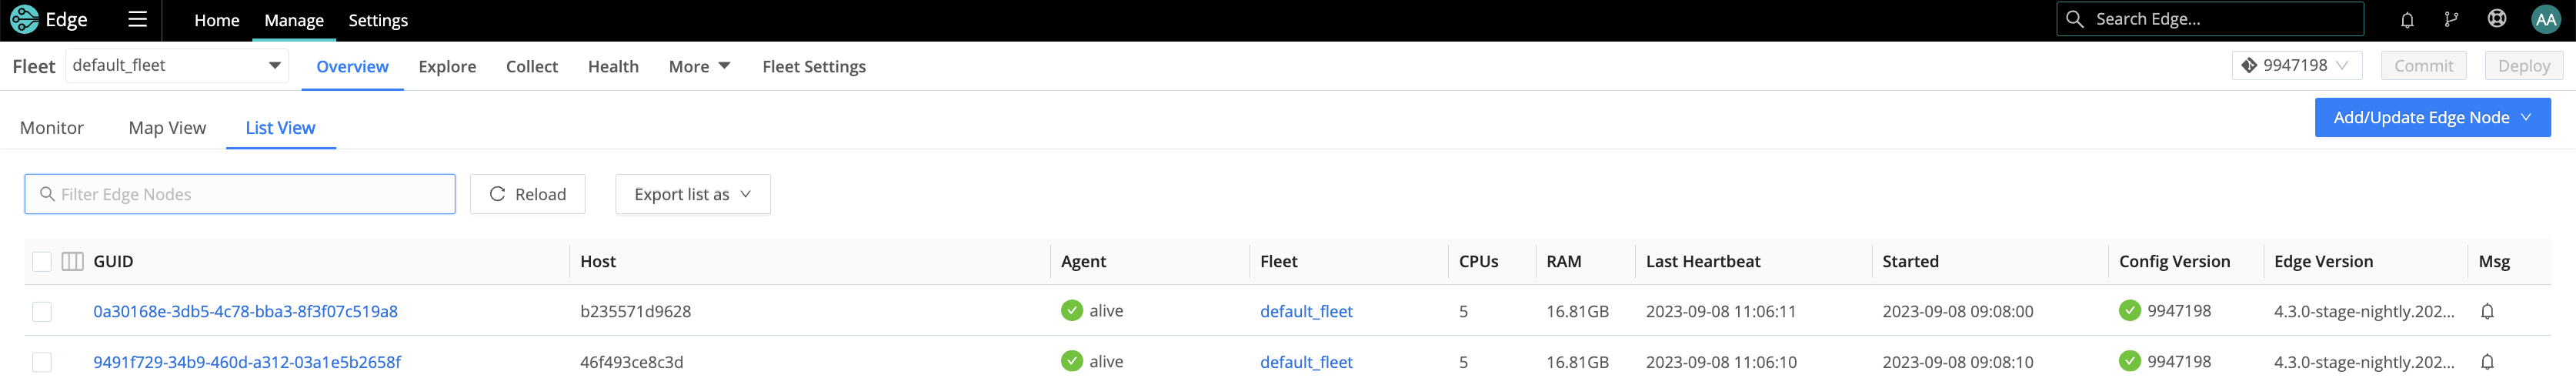
Click anywhere on a row to display a quick snapshot of the Edge Node’s details, with an option to Restart the host.
Teleport into an Edge Node
Click the Edge Node GUID link to teleport from the Leader into the Edge Node. Here, you can explore the metrics and log data that the Node has autodiscovered, and can manually discover and explore other data of interest. You can use the discovered data to perform root-cause analysis, to troubleshoot, and to restart the host.
The page displays metadata for the Node, and below it, graphs of system activity. A magenta border indicates you are remotely viewing a host, and identifies the host’s name.
Click Restart Edge to restart the Node. To return to the Manage Edge Nodes page, click the X close button on the upper right.
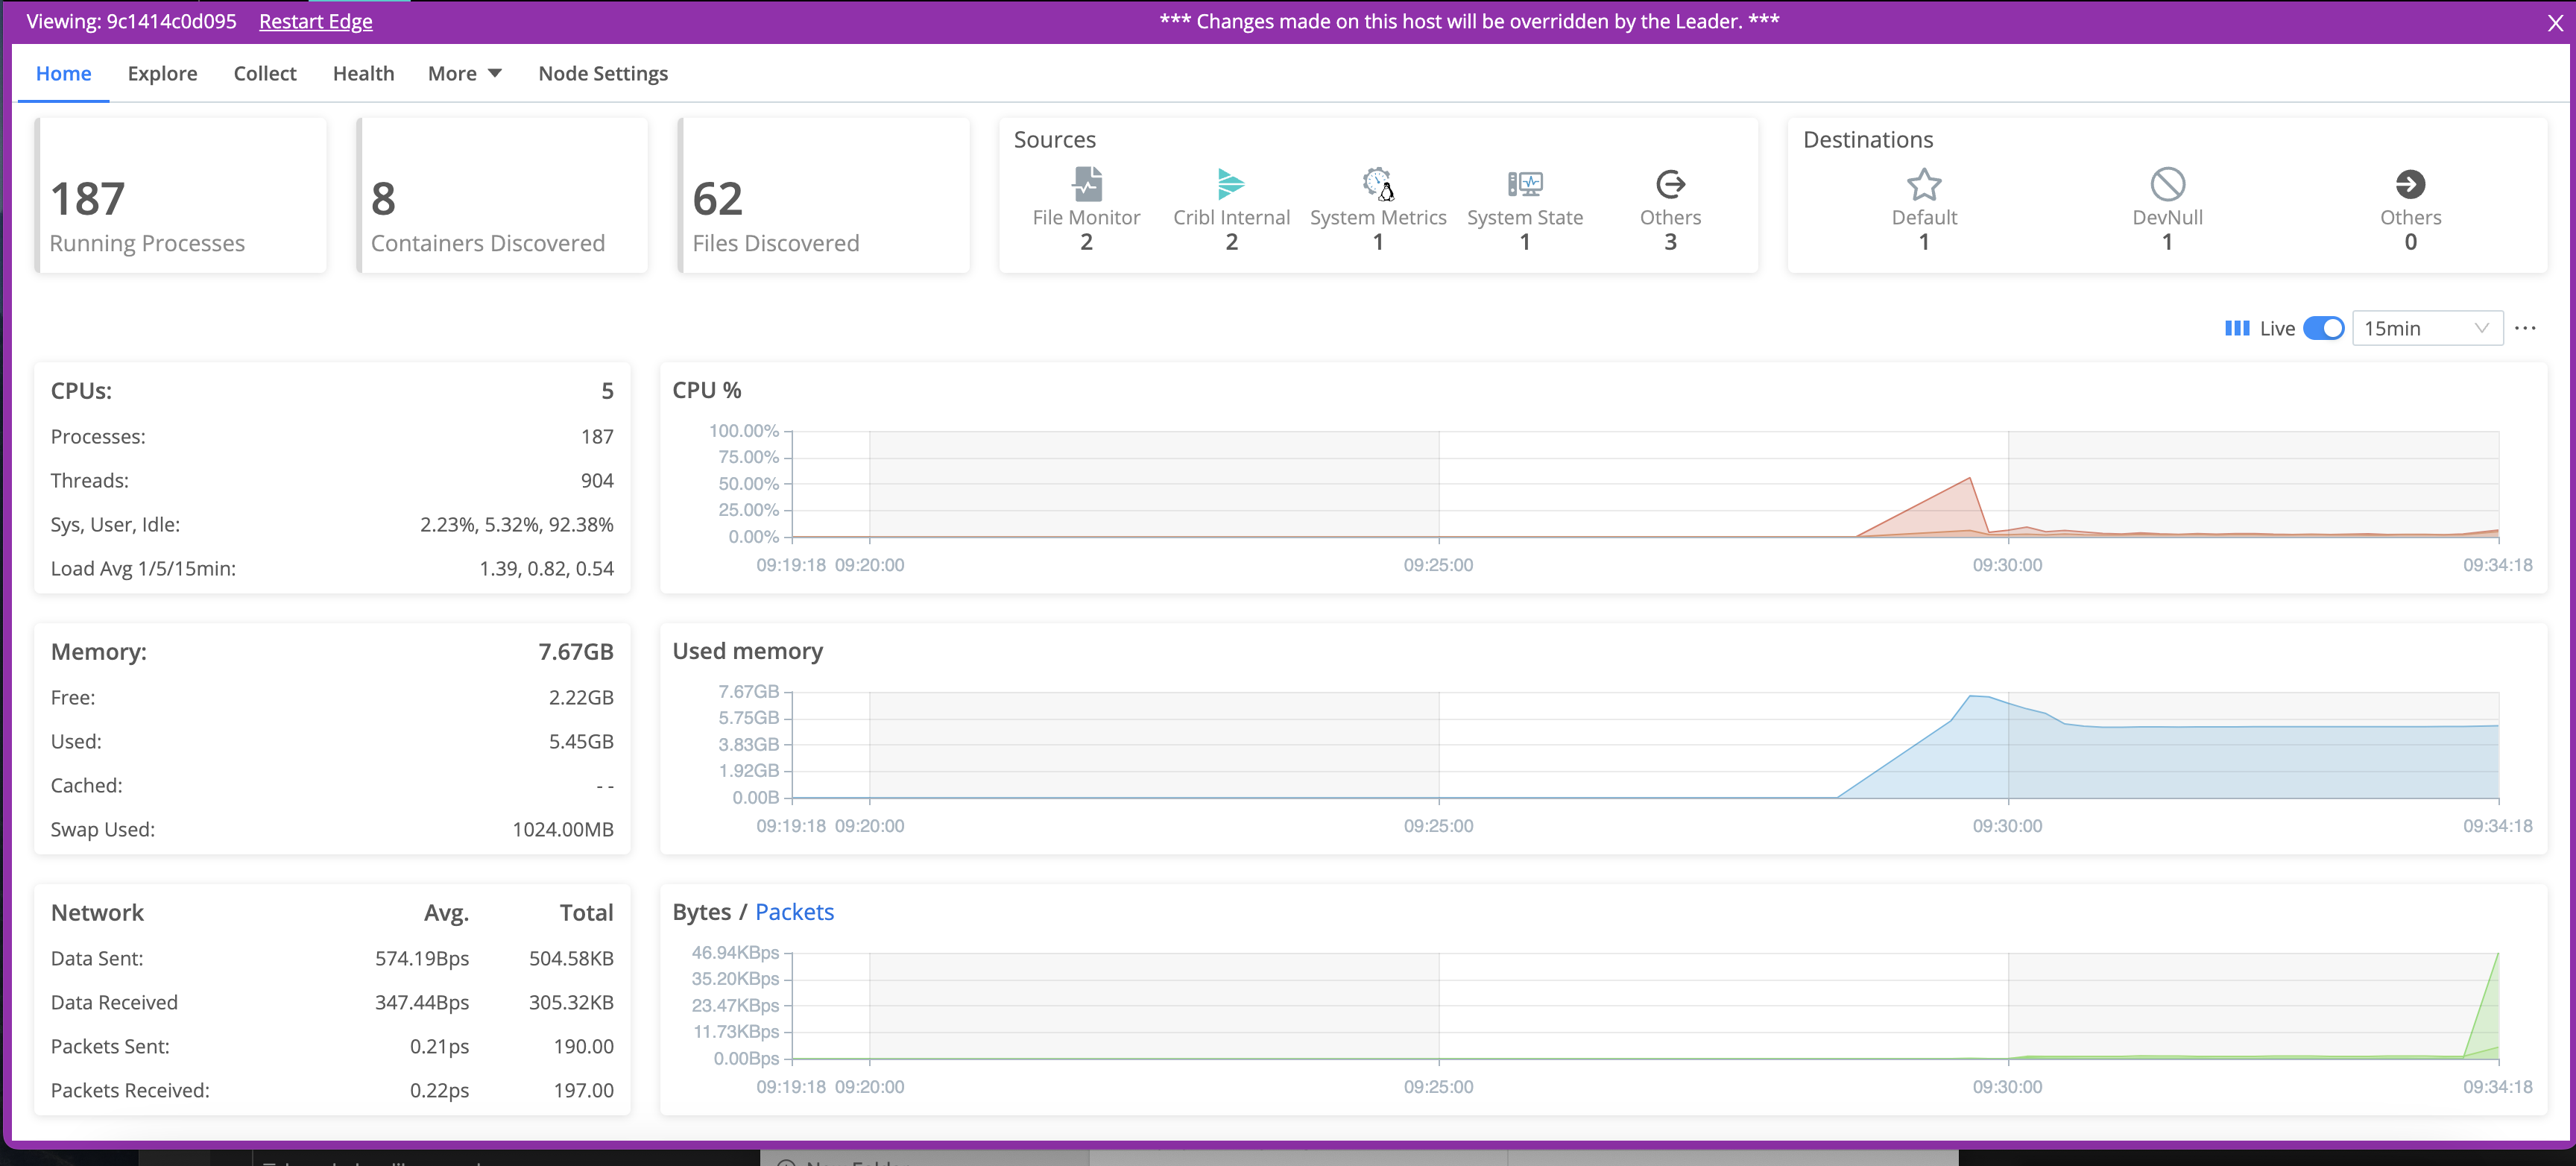
Changes that you make on an Edge Node will not propagate to the Leader. Also, the Leader will override any changes that you make directly on a Node.
Explore Tab
From the top nav, select Explore to view more details on a particular Edge Node. On the Node to explore drop-down, select one of your hosts to display the following tabs:
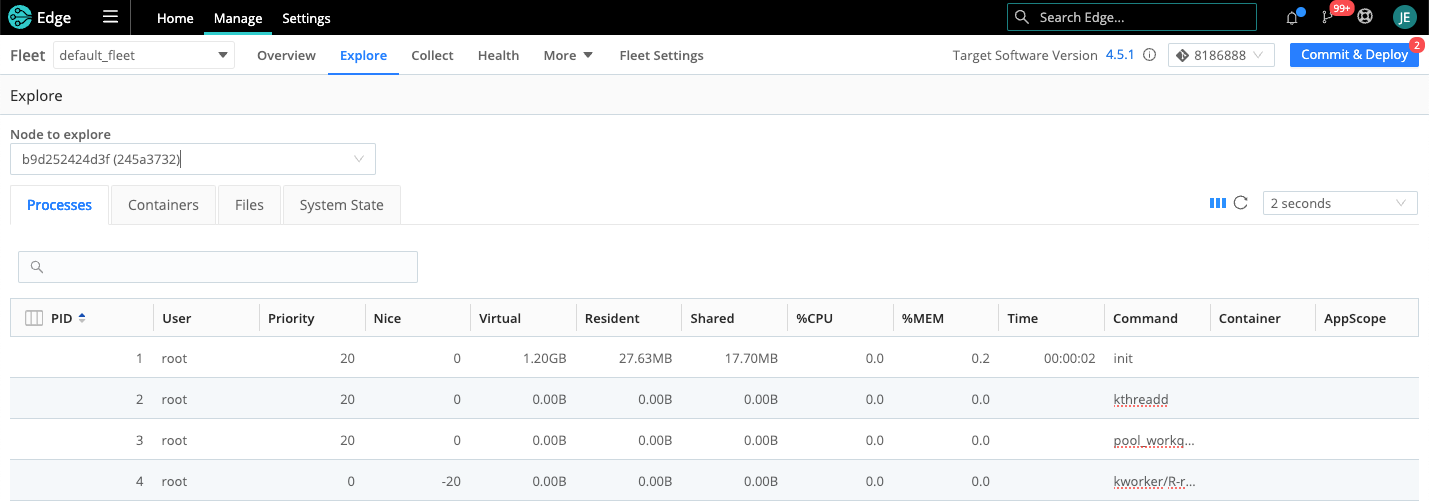
The Node to explore drop-down lists up to 50 Edge Nodes, ordered by hostname. To view the details for a specific Edge Node, enter the hostname or GUID into the Node to explore field.
Let’s explore each tab.
Processes
The Processes tab lists all the processes running on the Edge Node.
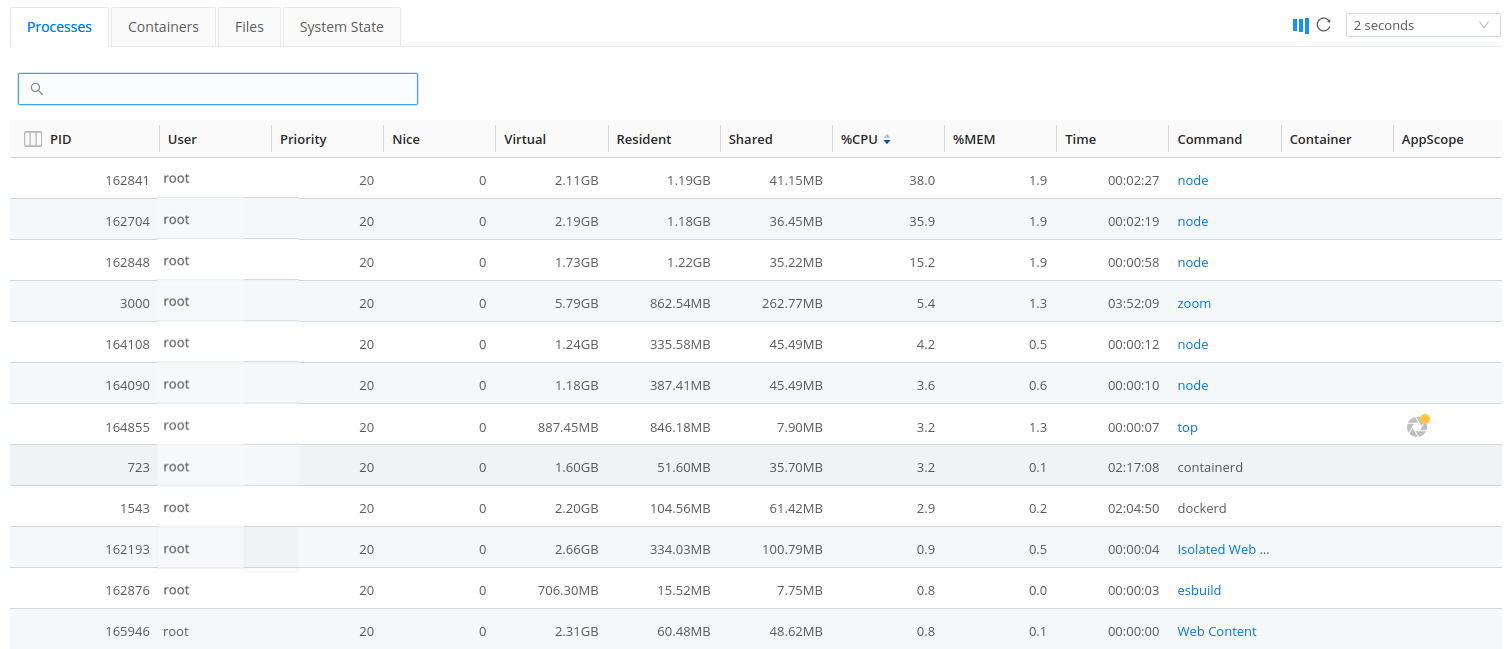
Click on any of the rows to open the Process: <process_name> drawer. In the drawer’s default Overview tab, you’ll find basic information on the process, including CPU, Memory, and IO graphs, along with tables for active Listening, Inbound, and Outbound connections.
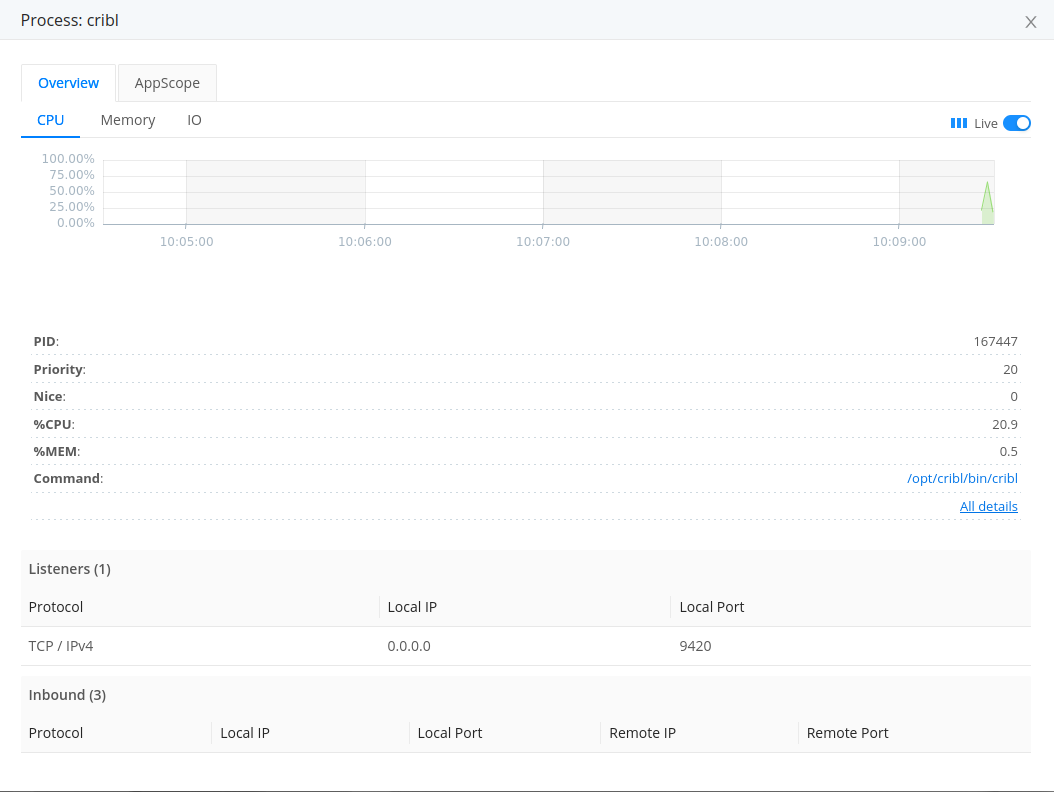
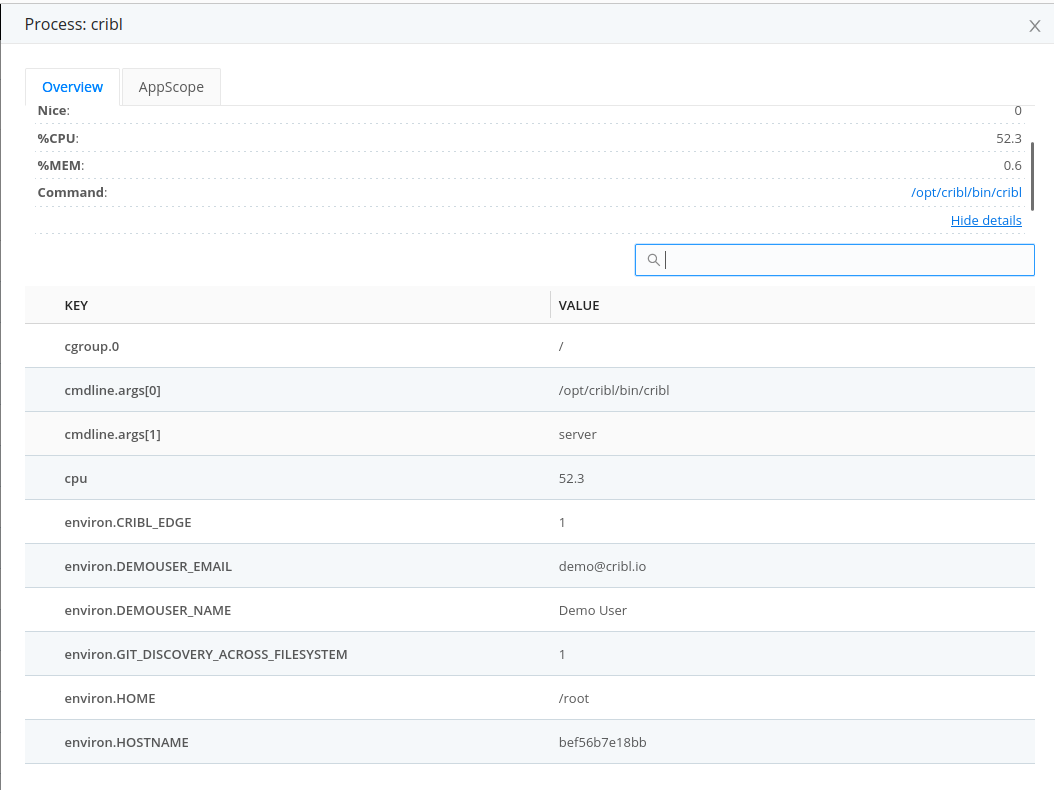
In this tab, click All details to see the selected process’ information out of /proc, expressed as key-value pairs. This information would normally require SSH’ing to the machine; this view makes troubleshooting across multiple systems much easier.
Open the AppScope tab if you want to “scope” the process (i.e., use AppScope to monitor it). Once in the tab, you’ll choose an an AppScope configuration that says what events and metrics to obtain, and an AppScope Source to receive them. See Scoping by PID in the AppScope docs. Note that your Cribl Edge instance must be running as root to do process monitoring with AppScope.
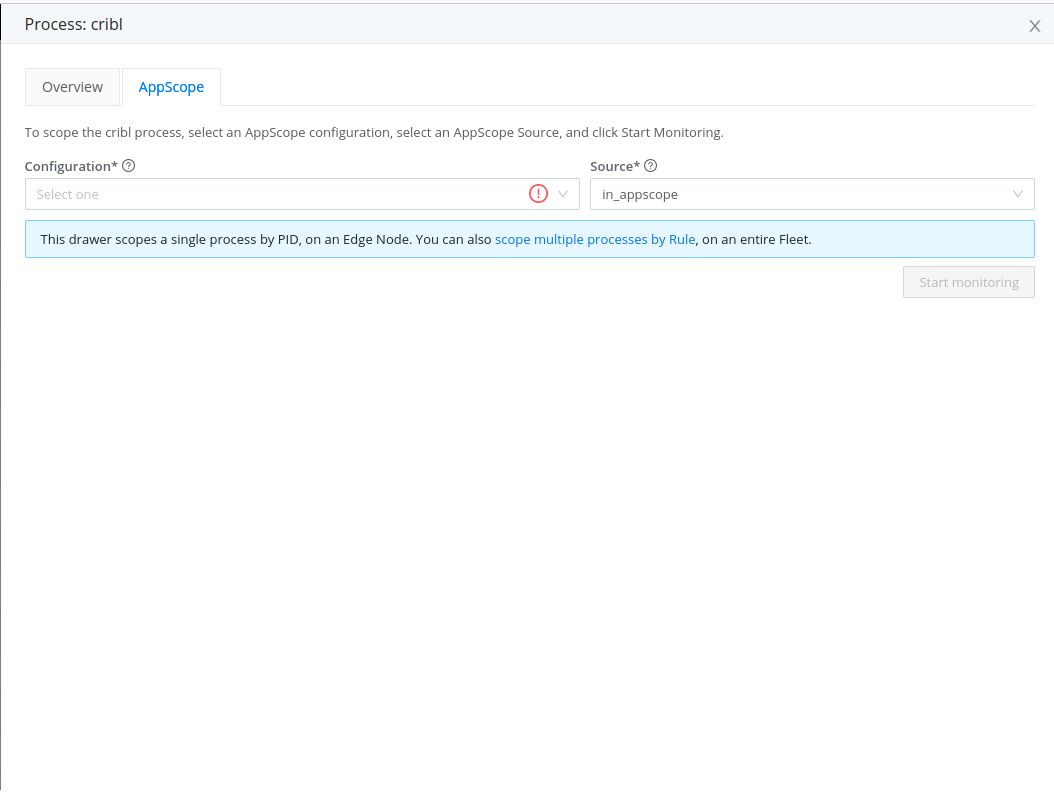
When a process is being scoped, back in the Processes tab you’ll see that indicated in the process’ entry in the AppScope column.
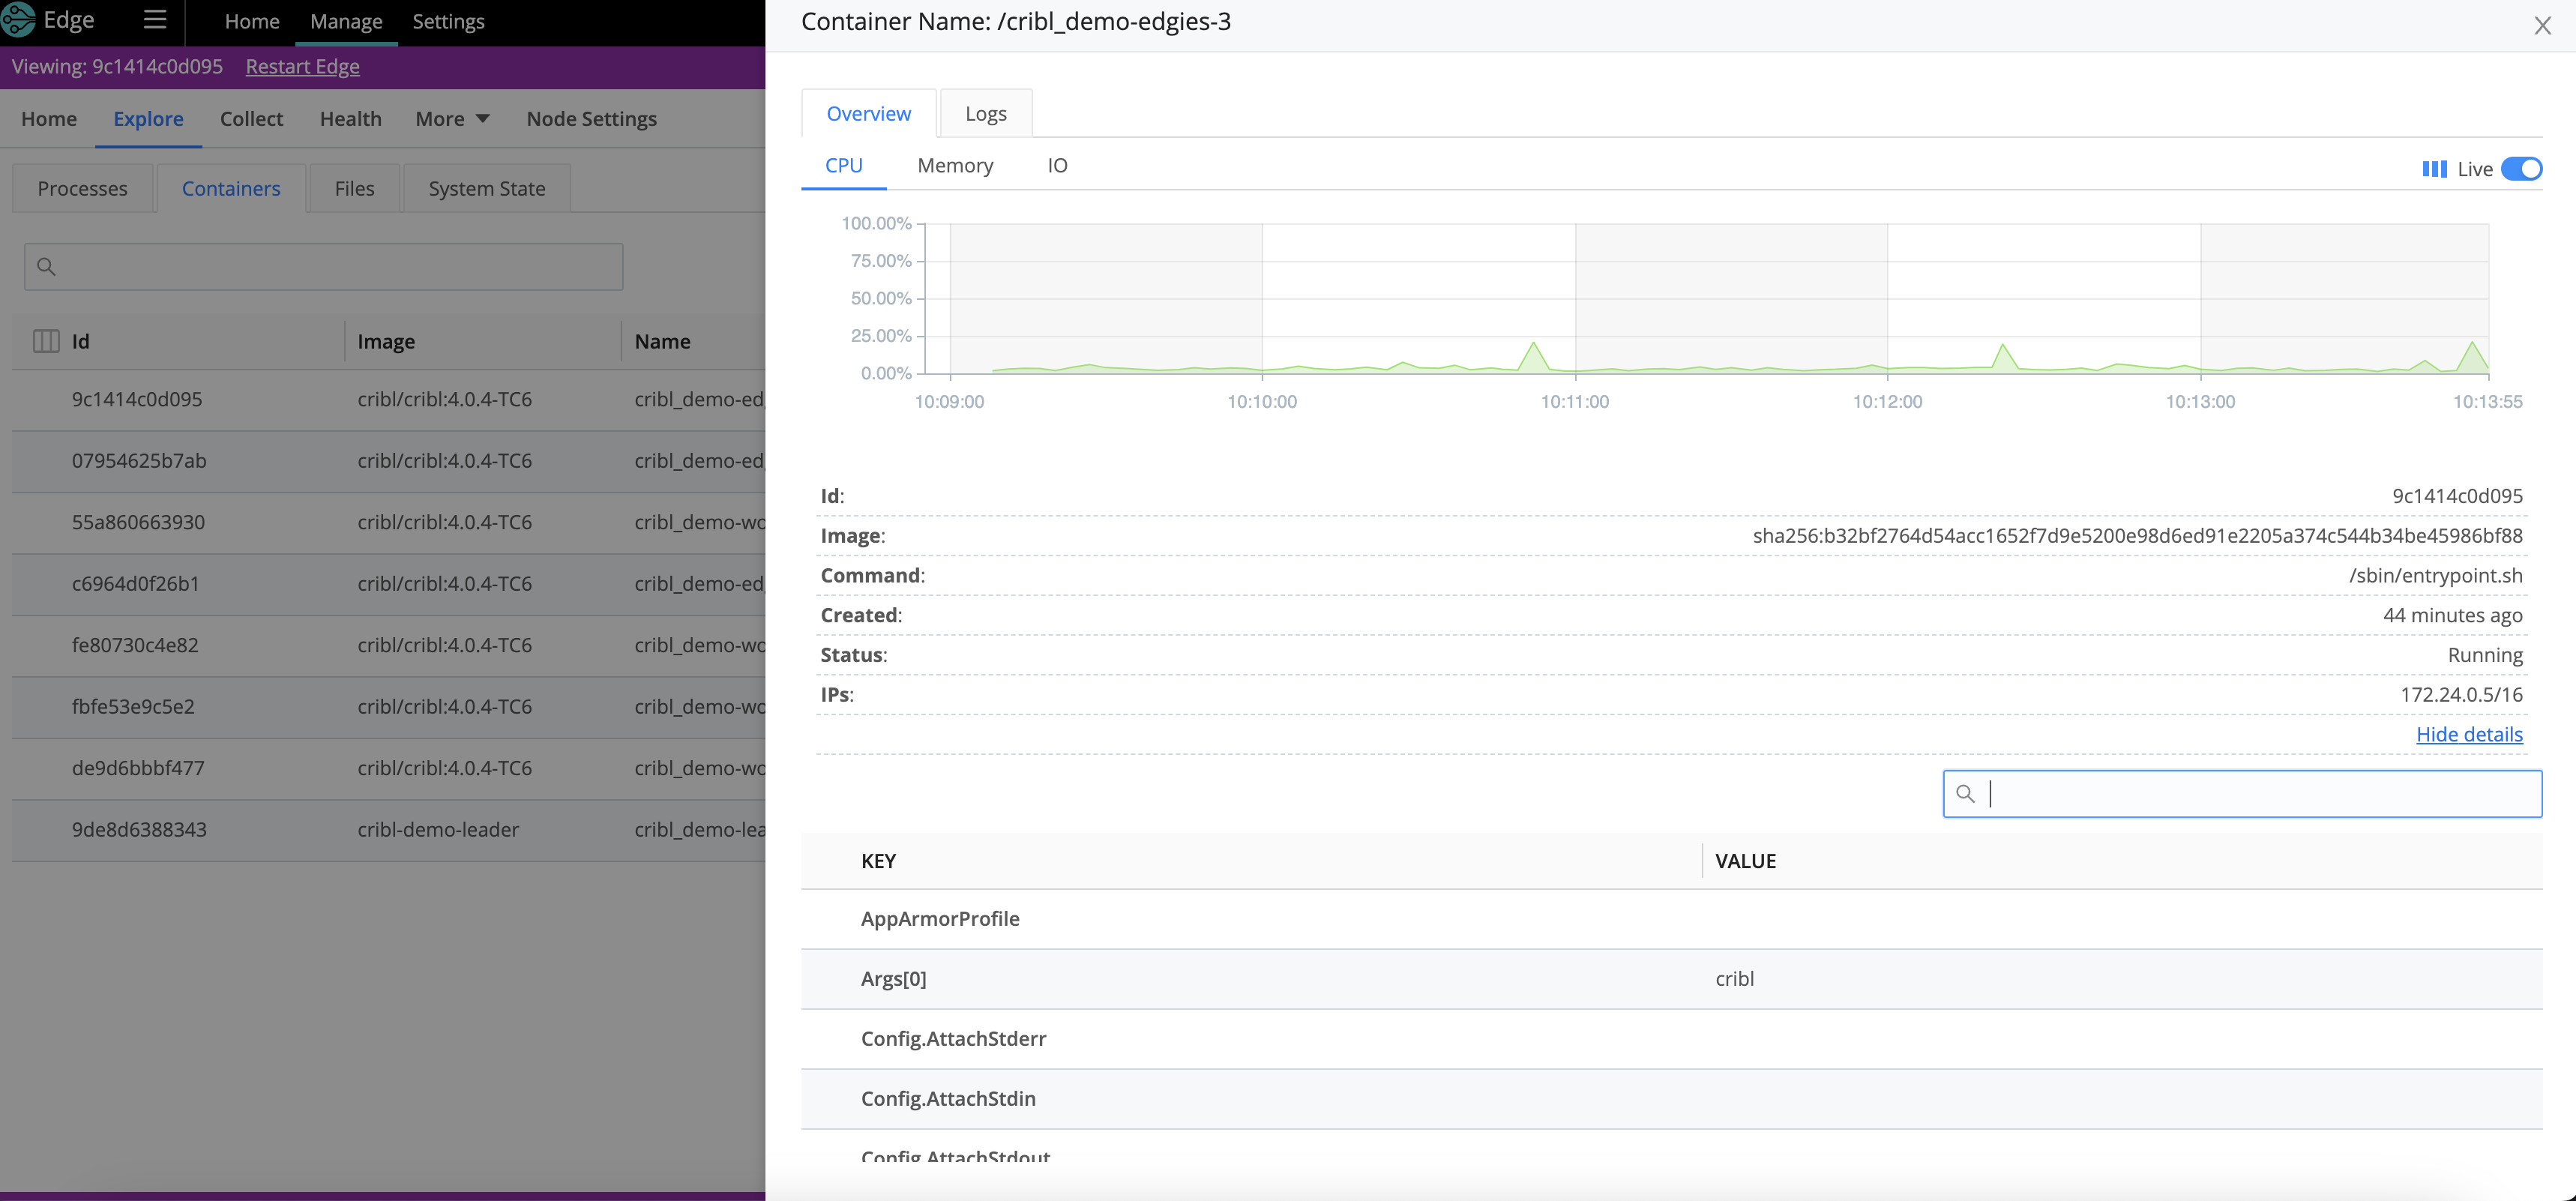
Containers
The Containers tab lists all the running containers and container metrics including information about images, volumes, status, ports, etc.
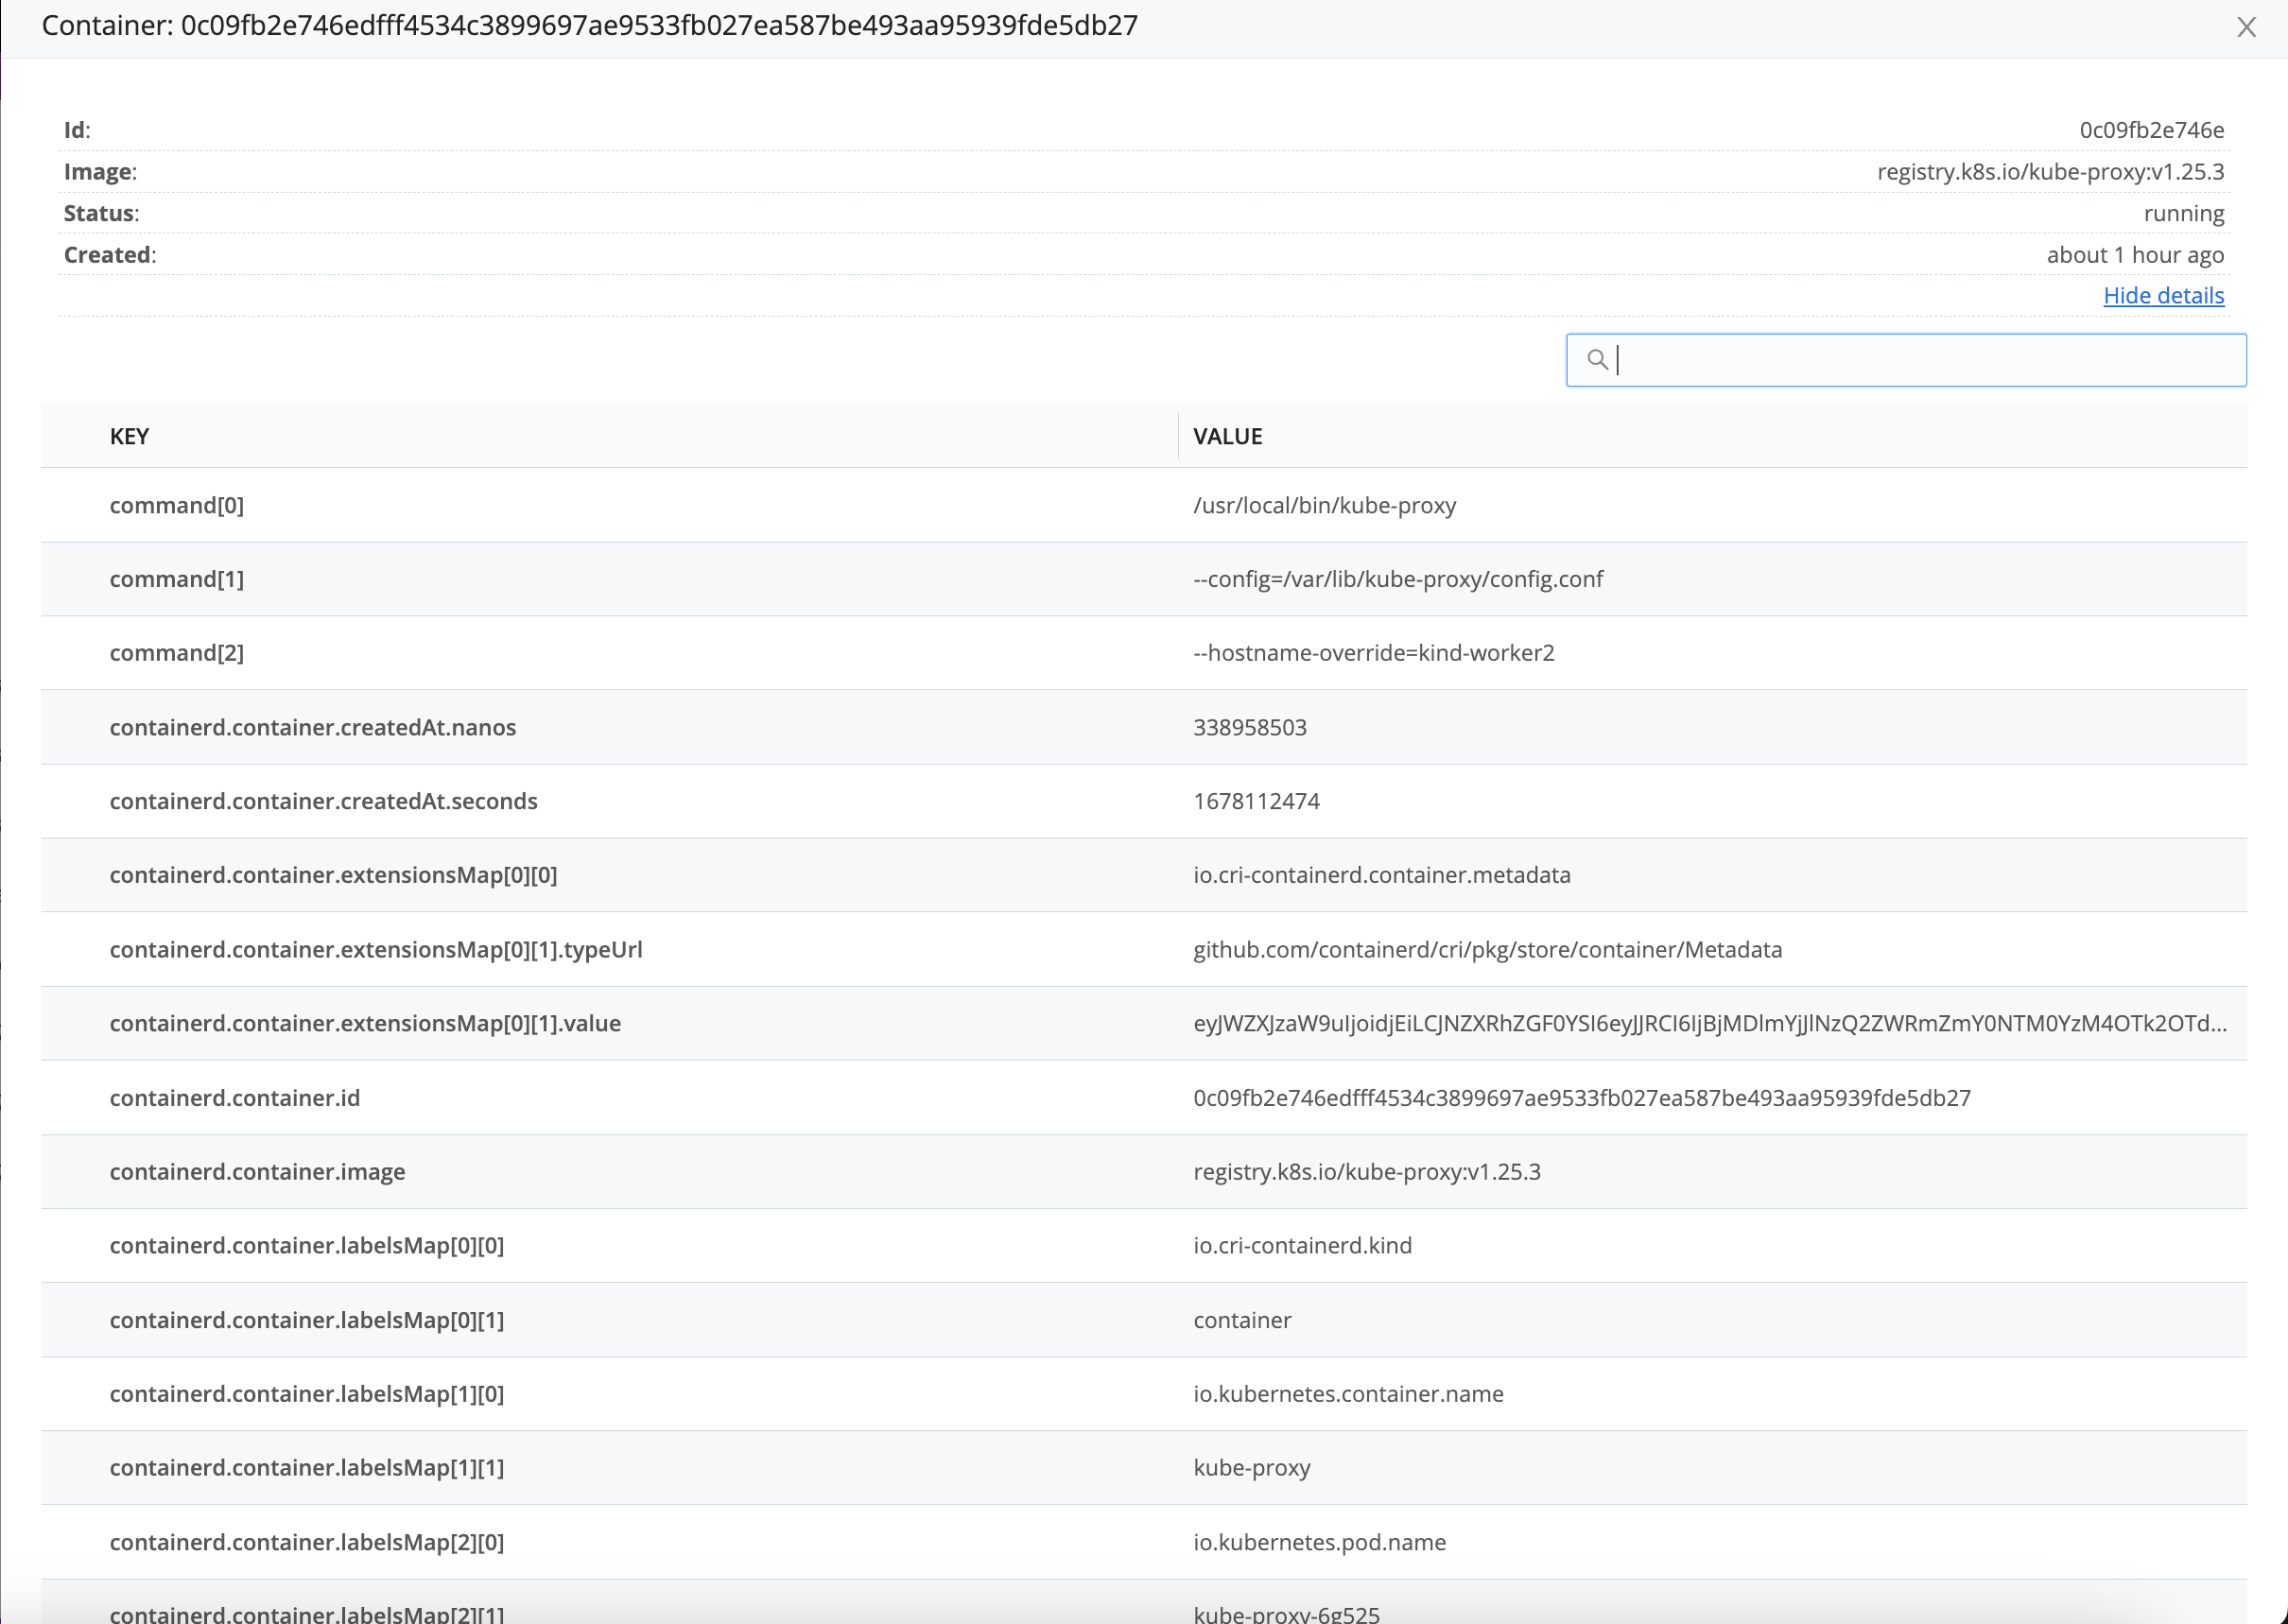
Cribl Edge supports both Docker and
containerdruntimes.
containerd containers have less info than Docker containers, so Ports, IPs, and Logs won’t populate.
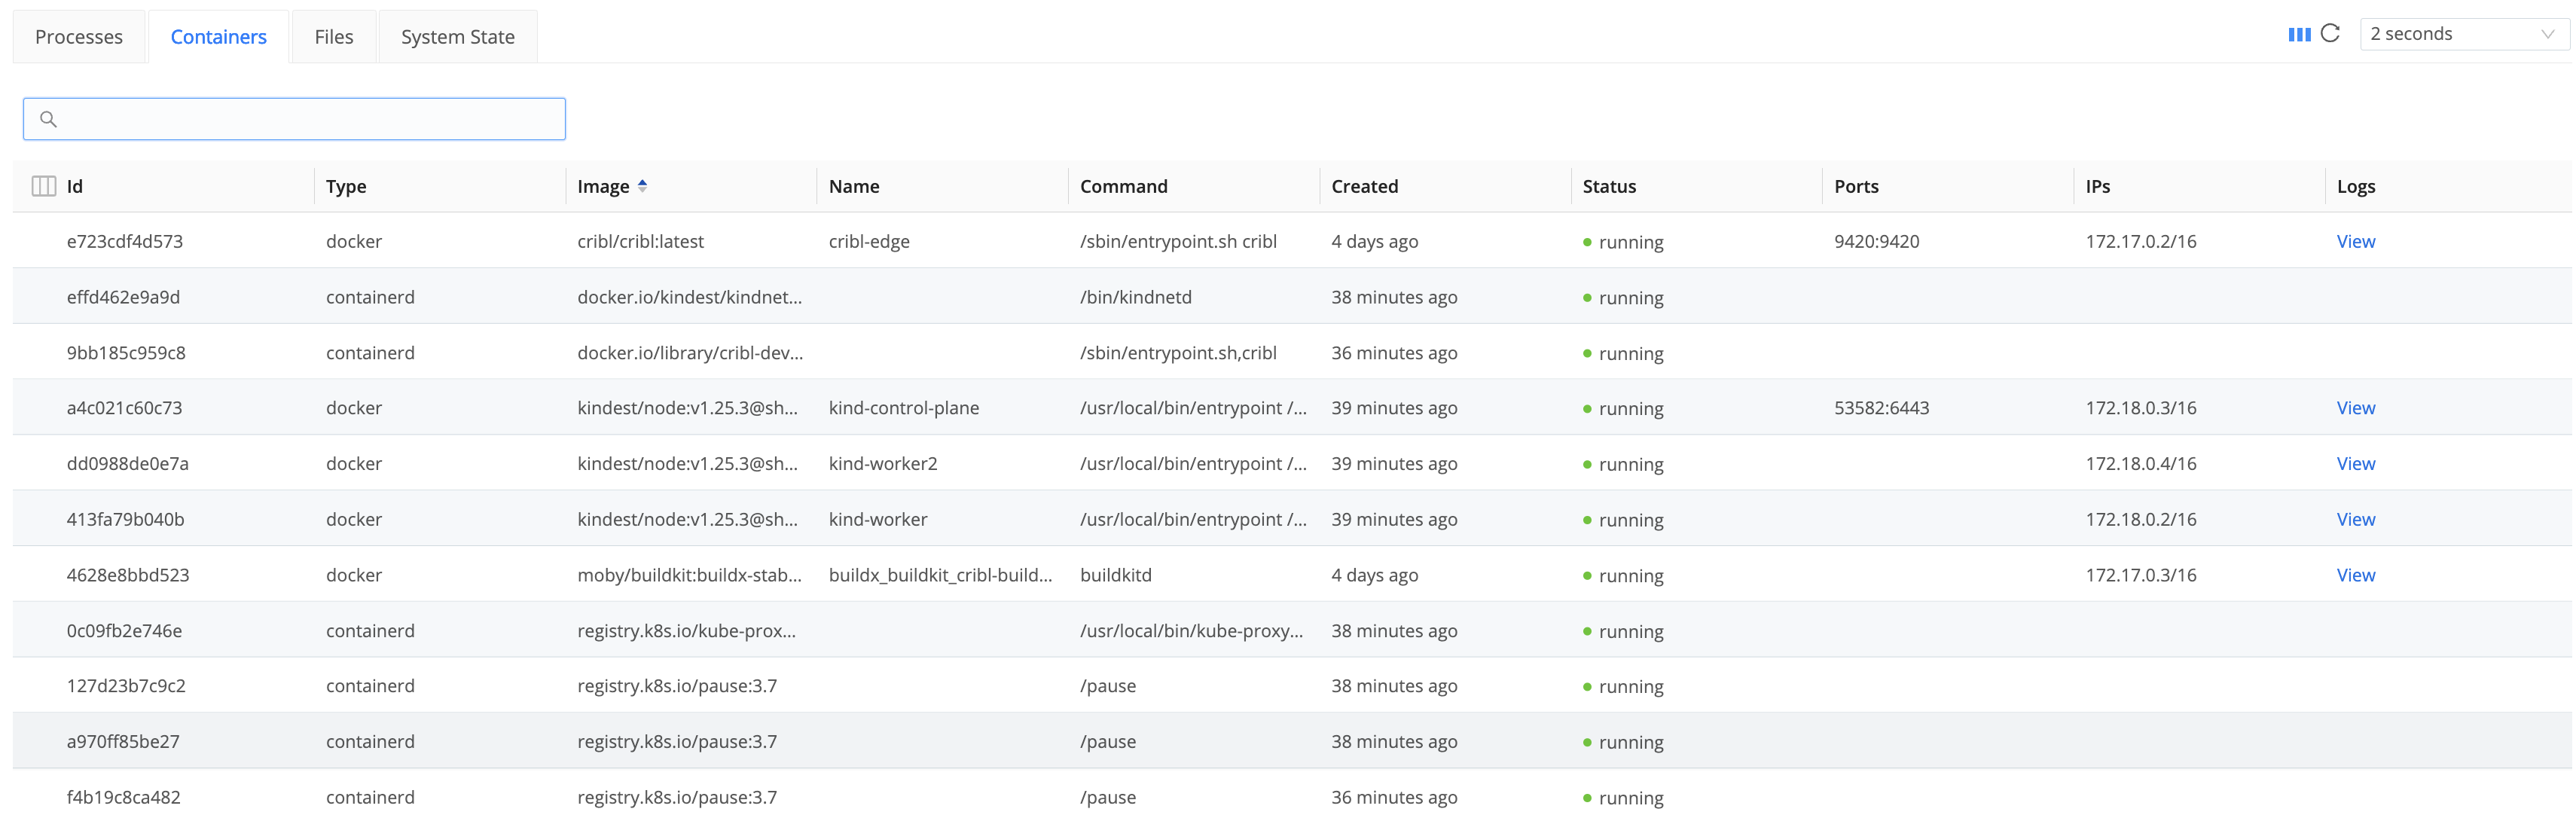
Click any container to view more details:
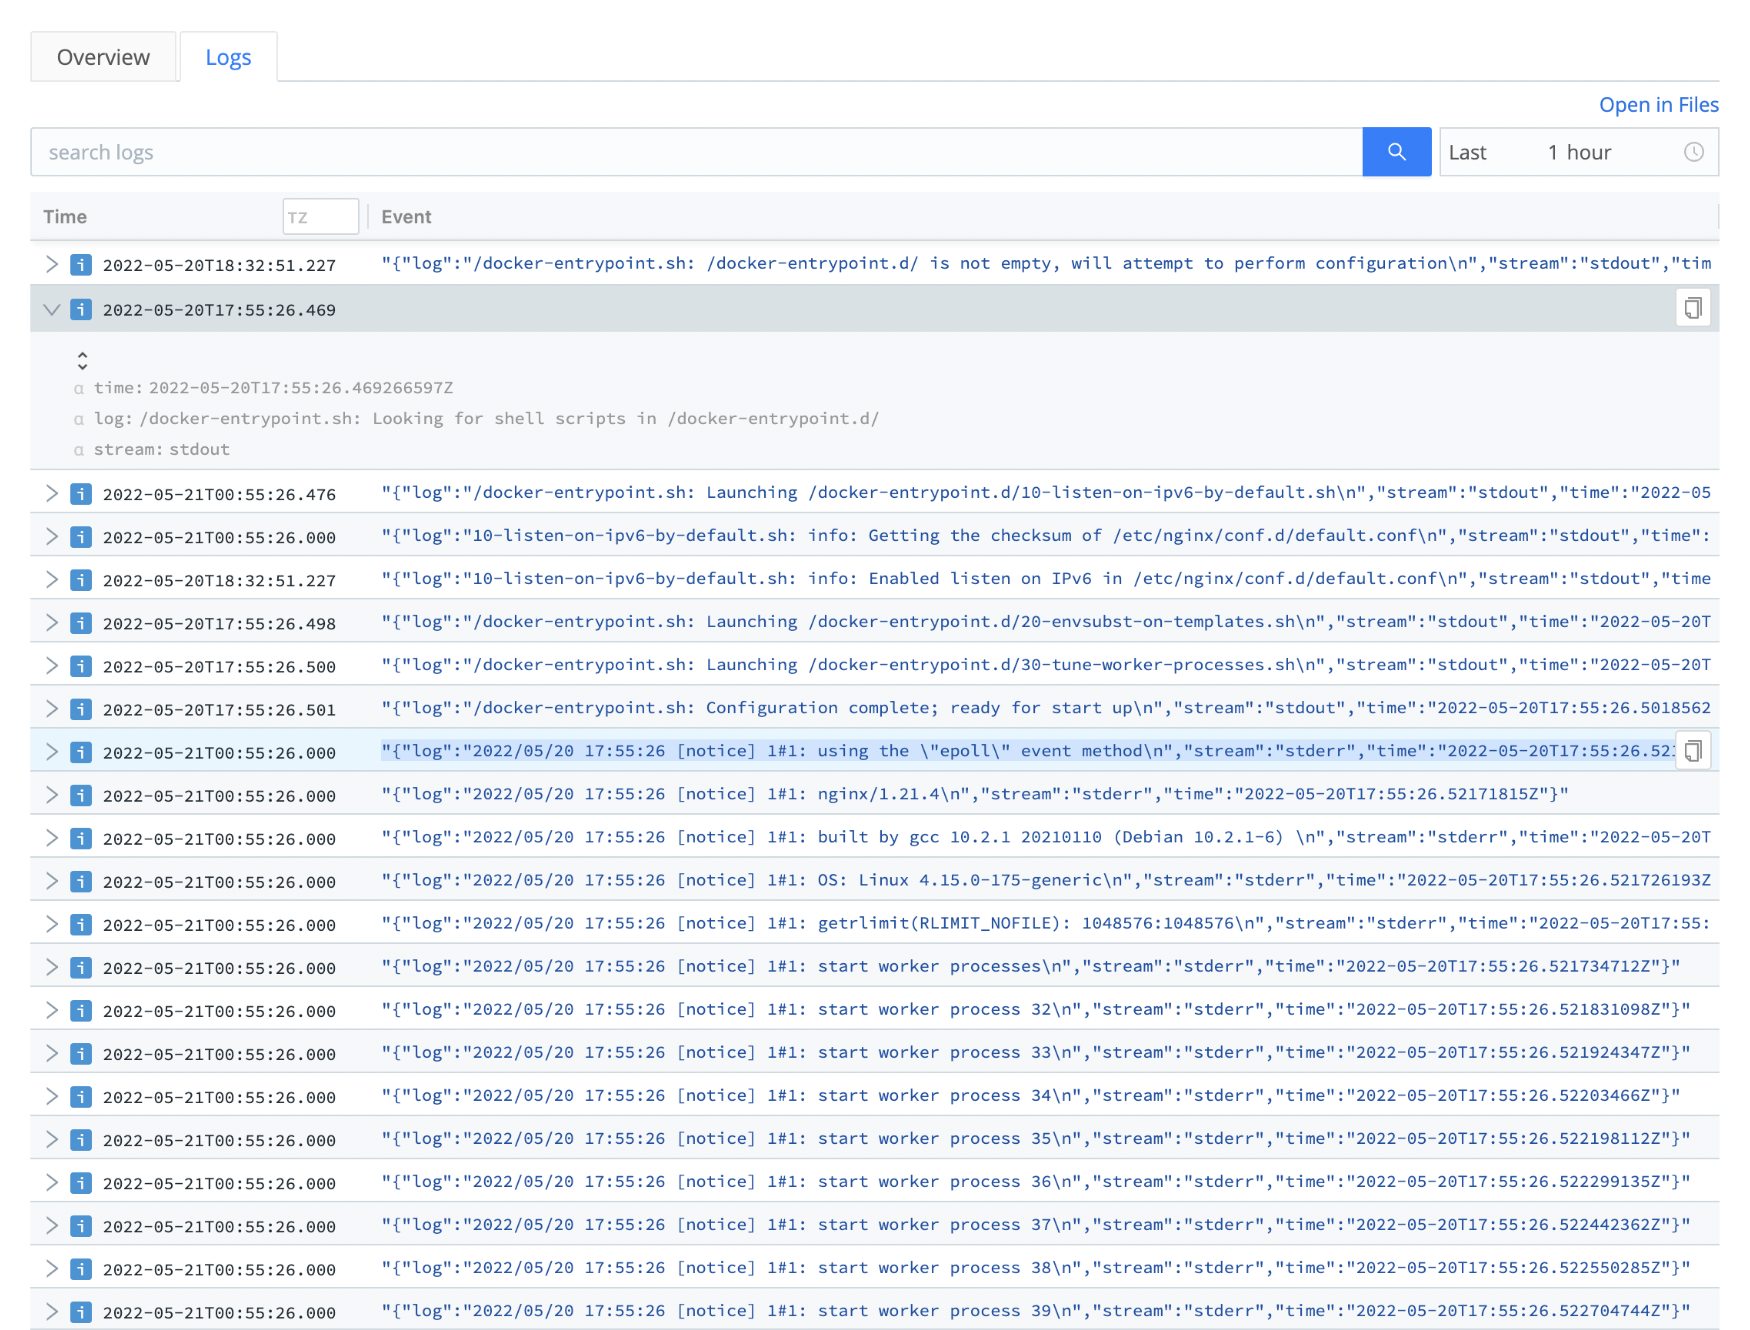
Click the Logs tab to view container logs. Optionally, use the search bar to filter displayed logs by arbitrary strings.
The screenshot below shows containerd details, which don’t include charts or logs.
If you run Edge as an unprivileged user, see Making Docker Containers Visible to Edge.
Files
The Files tab lists all the log files being actively written to by running applications that Cribl Edge has auto-discovered. You can also specify a list of directories and files to actively monitor.
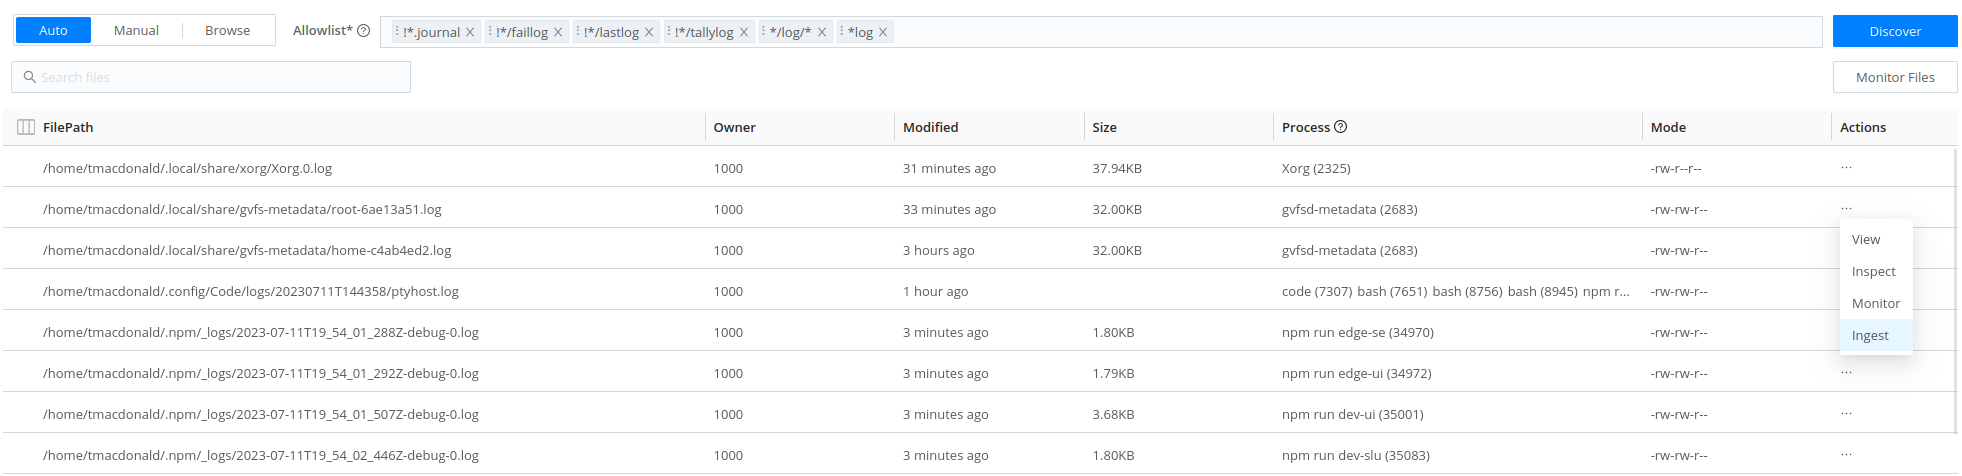
The Actions column allows you to:
View: Displays a representation of the lines this column contains. You can also click any file row. To restrict how much data is displayed, use the search field or time picker on the Search tab.
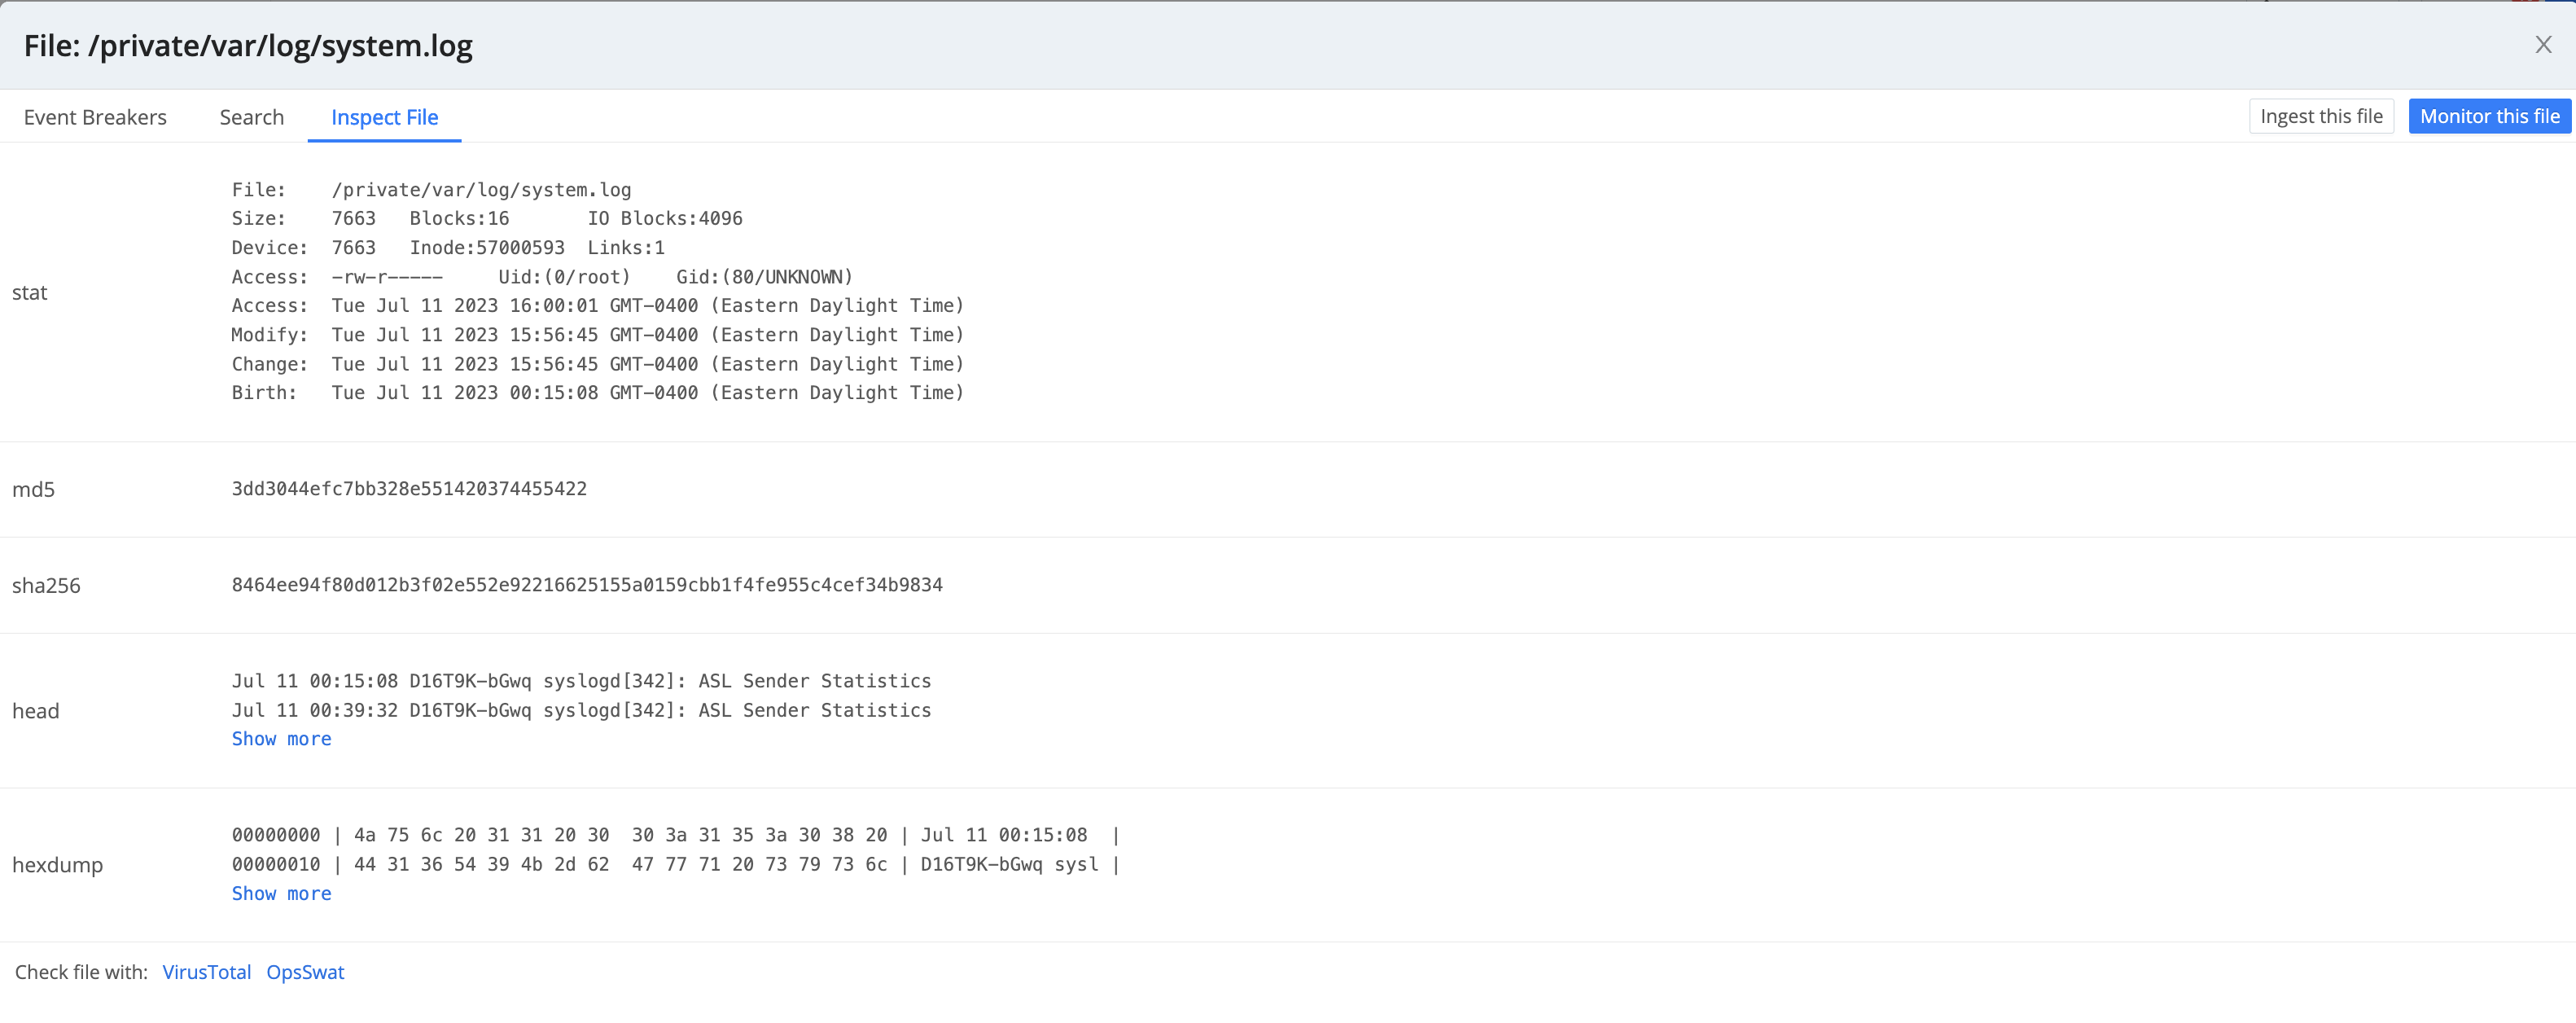
Inspect: Opens the Inspect File tab to show file metadata including details like permissions, file size, user, and modified date.
When inspected, compressed files (e.g. foo.bar.gz) include a File preview that shows the beginning of the file contents.
Archived files (e.g. .zip, .tgz, .tar.gz) include a File listing that shows the files within it.
If a file appears suspicious, click VirusTotal or OpSwat at the bottom of the modal to see if the file is flagged as compromised.
Monitor: Displays the File Monitor’s configuration modal.
Ingest: Opens the Ingest file modal to send the file content to Routes/Pipelines for further processing or downstream to any destination you have configured. This is useful for testing and troubleshooting your configurations.
The Files tab provides the following options.
File Discovery Modes
Click a button at the top to select a discovery mode:
- Auto: Tells Cribl Edge to automatically discover files that are open for writing on currently running processes.
- Manual: Tells Cribl Edge to discover the files within the Path (directory) and Allowlist that you specify, down to the Max depth.
- Browse: Displays a tree view of all of your directories and files.
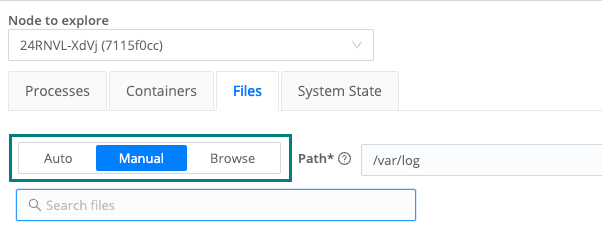
Path
The Path field tells Cribl Edge to discover the files within the path (a directory) that you specify, down to the Max depth.
Allowlist
The Allowlist field, available with Auto and Manual discovery, supports wildcard syntax, and supports the exclamation mark (!) for negation. For example, you can use !*cribl*access.log to prevent Cribl Edge from discovering its own access log. The default filters are */log/* and *log.
Click any file to see a representation of the lines it contains. To restrict how much data is displayed, you can use the search field or time picker on the Search tab.
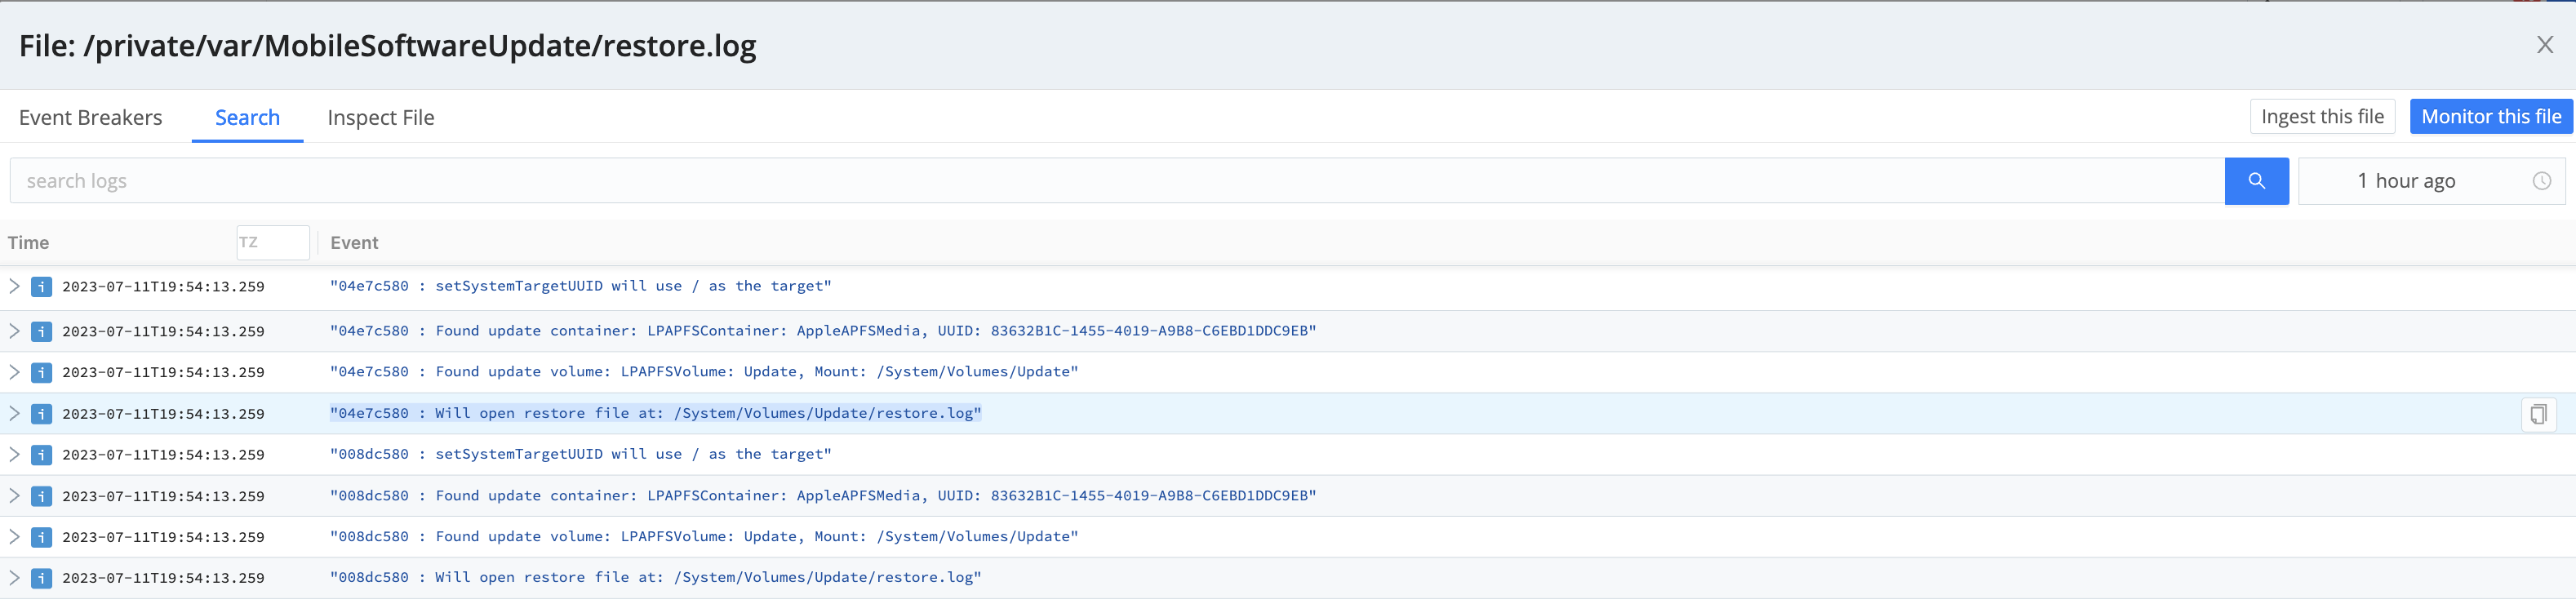
If the representation of events shown on the Search tab isn’t ideally suited to the file’s content, you can use the Event Breakers tab to change it.
Monitor Files
The Monitor Files button, available with Auto and Manual discovery, opens a new File Monitor Source prefilled with the discovery mode and anything else you specified on the Files tab, such as allowlist entries, path, or max depth.
Max Depth
The Max depth field, available with Manual discovery, is empty by default. Cribl Edge will search subdirectories, and their subdirectories, downward without limit.
If you enter 0, Cribl Edge will discover only the top-level files within the specified path. If you specify 1, Cribl Edge will discover files one level down from the top. Follow this pattern to specify the depth you want.
Monitoring a File
Click a file’s Monitor button or Actions option to configure your File Monitor Source to generate events from the file’s lines or records.
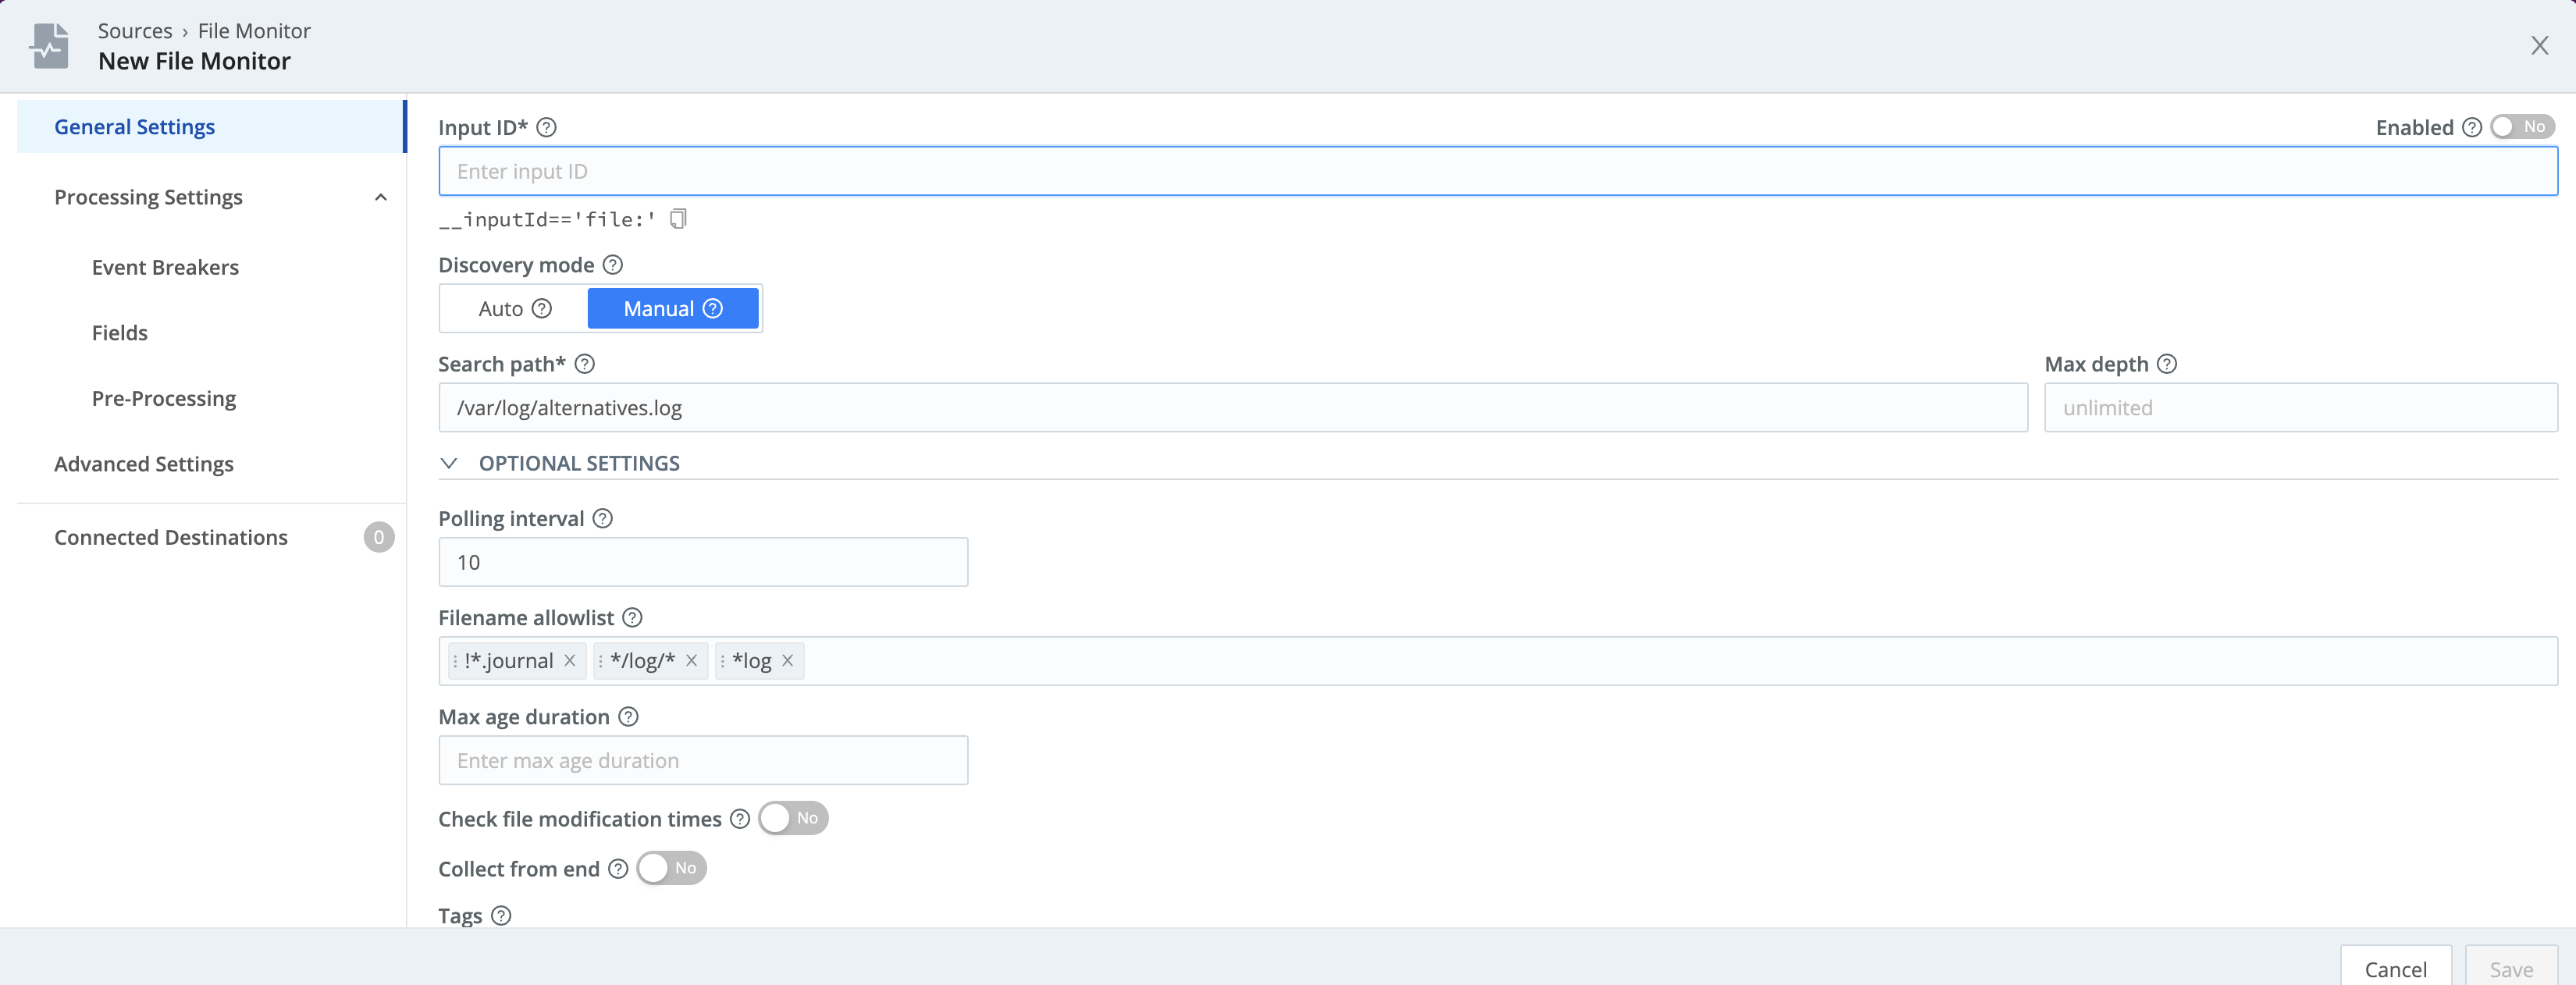
The Monitor feature automatically prepopulates the modal with the following settings configured on the Files tab:
- Discovery mode
- Search path
- Max depth
- Filename allowlist
In addition, the Connected Destinations section defaults to QuickConnect. In the Connected Destinations section, you can select a Pipeline or Pack and a Destination. Otherwise, when you save, you’ll be routed to the Collect page to set up your connections via QuickConnect.
For further details, see File Monitor and QuickConnect.
Ingesting a File
To configure options for how and where to send file contents, use the Ingest file modal.
You have two options:
- Send directly to a configured Destination via QuickConnect (the default).
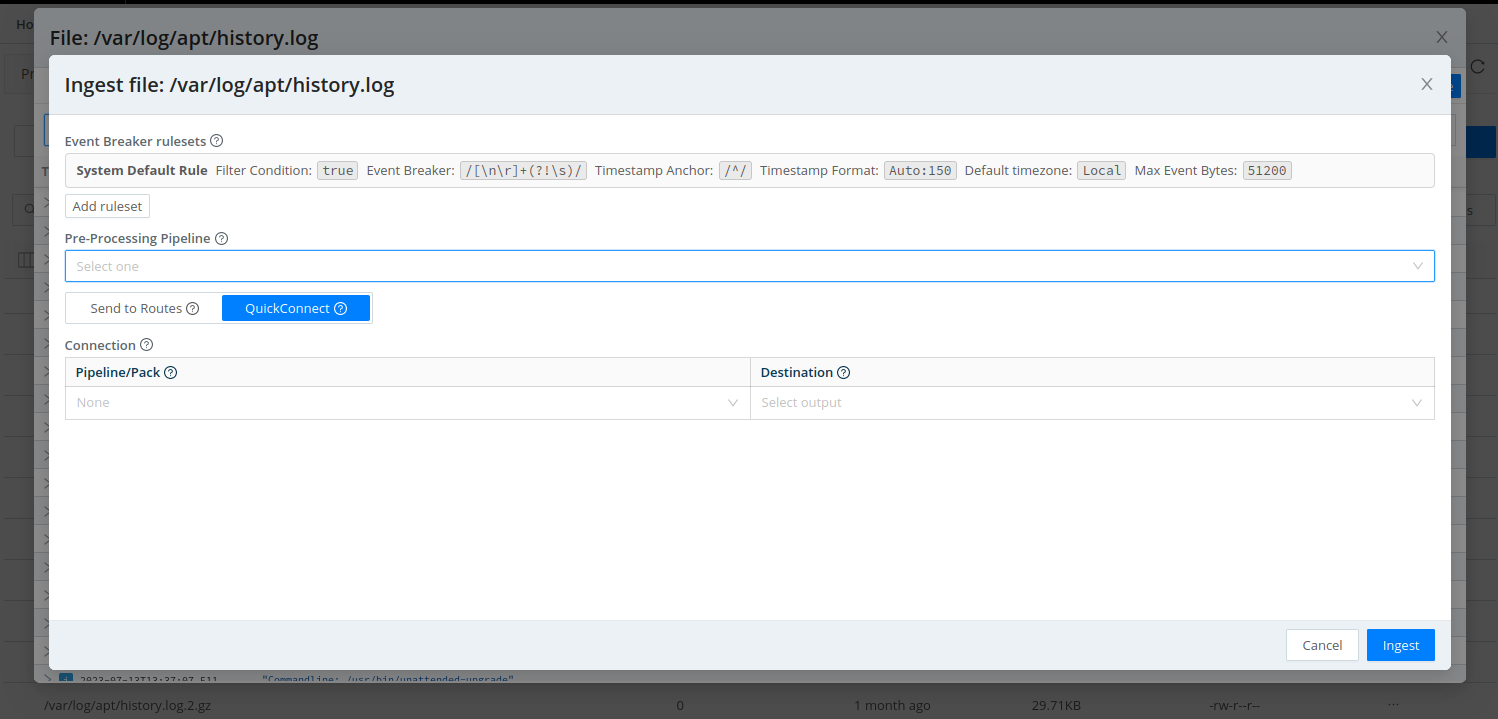
- Send to Routes through (an optional) Pre-Processing Pipeline.
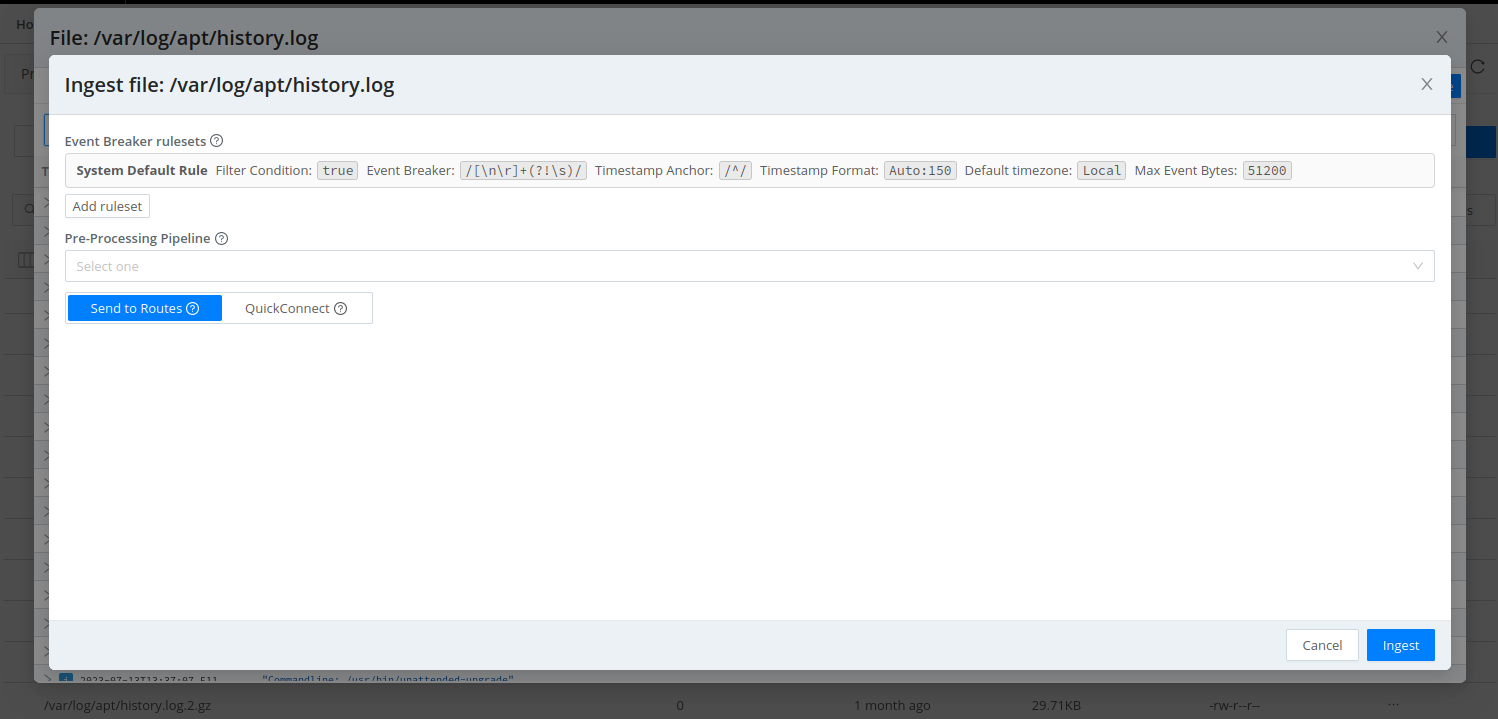
You can configure Event Breakers and rulesets for both options.
Exploring Files with Event Breakers
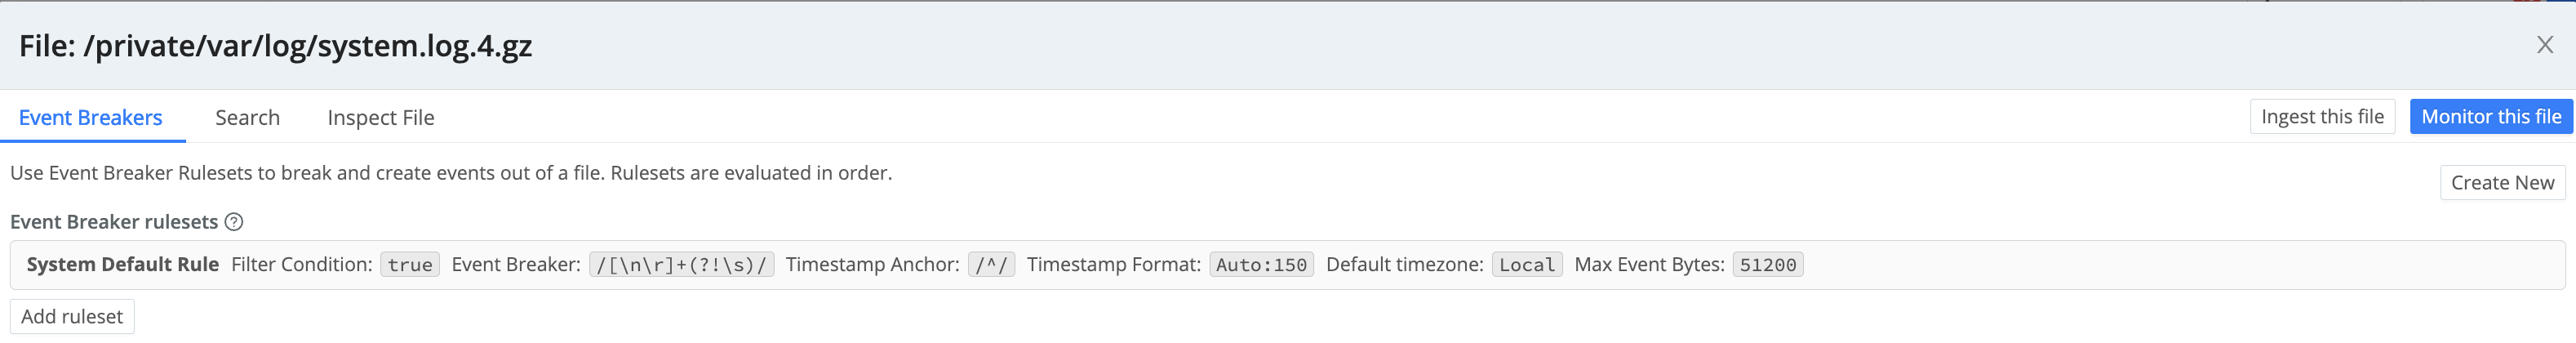
When you click a file in the Files tab, and Cribl Edge shows a representation of the lines that the file contains, how does that work? What’s happening is that Cribl Edge is applying a default Event Breaker to the file.
You are not limited to the default Event Breaker, though. Select the Event Breakers tab, then:
To apply a different (existing) Event Breaker, click Add ruleset, then select the desired ruleset from the Event Breaker rulesets drop-down.
To create a new ruleset, click Create New to open the New Ruleset modal. Proceed as described here. Later, you can persist the new Event Breaker as part of a Source or a Collector. While you create the new ruleset, Cribl Edge pulls the contents of the open file into the Sample File area. Toggle between the In and Out tabs to compare, respectively, the original content, and the content as modified by the Event Breaker you’re creating.
Now return to the Search tab - the contents of your chosen file will appear with the new Event Breaker applied.
System State
The System State upper tab provides access to these left tabs:
- Host Info
- Disks
- DNS
- File Systems
- Firewall
- Groups
- Hosts File
- Interfaces
- Listening Ports
- Logged-In Users
- Routes
- Services
- Users
To display any of the tabs above, you need to configure and enable the System State Source. Also, make sure that the Source’s Collector Settings fields are enabled.
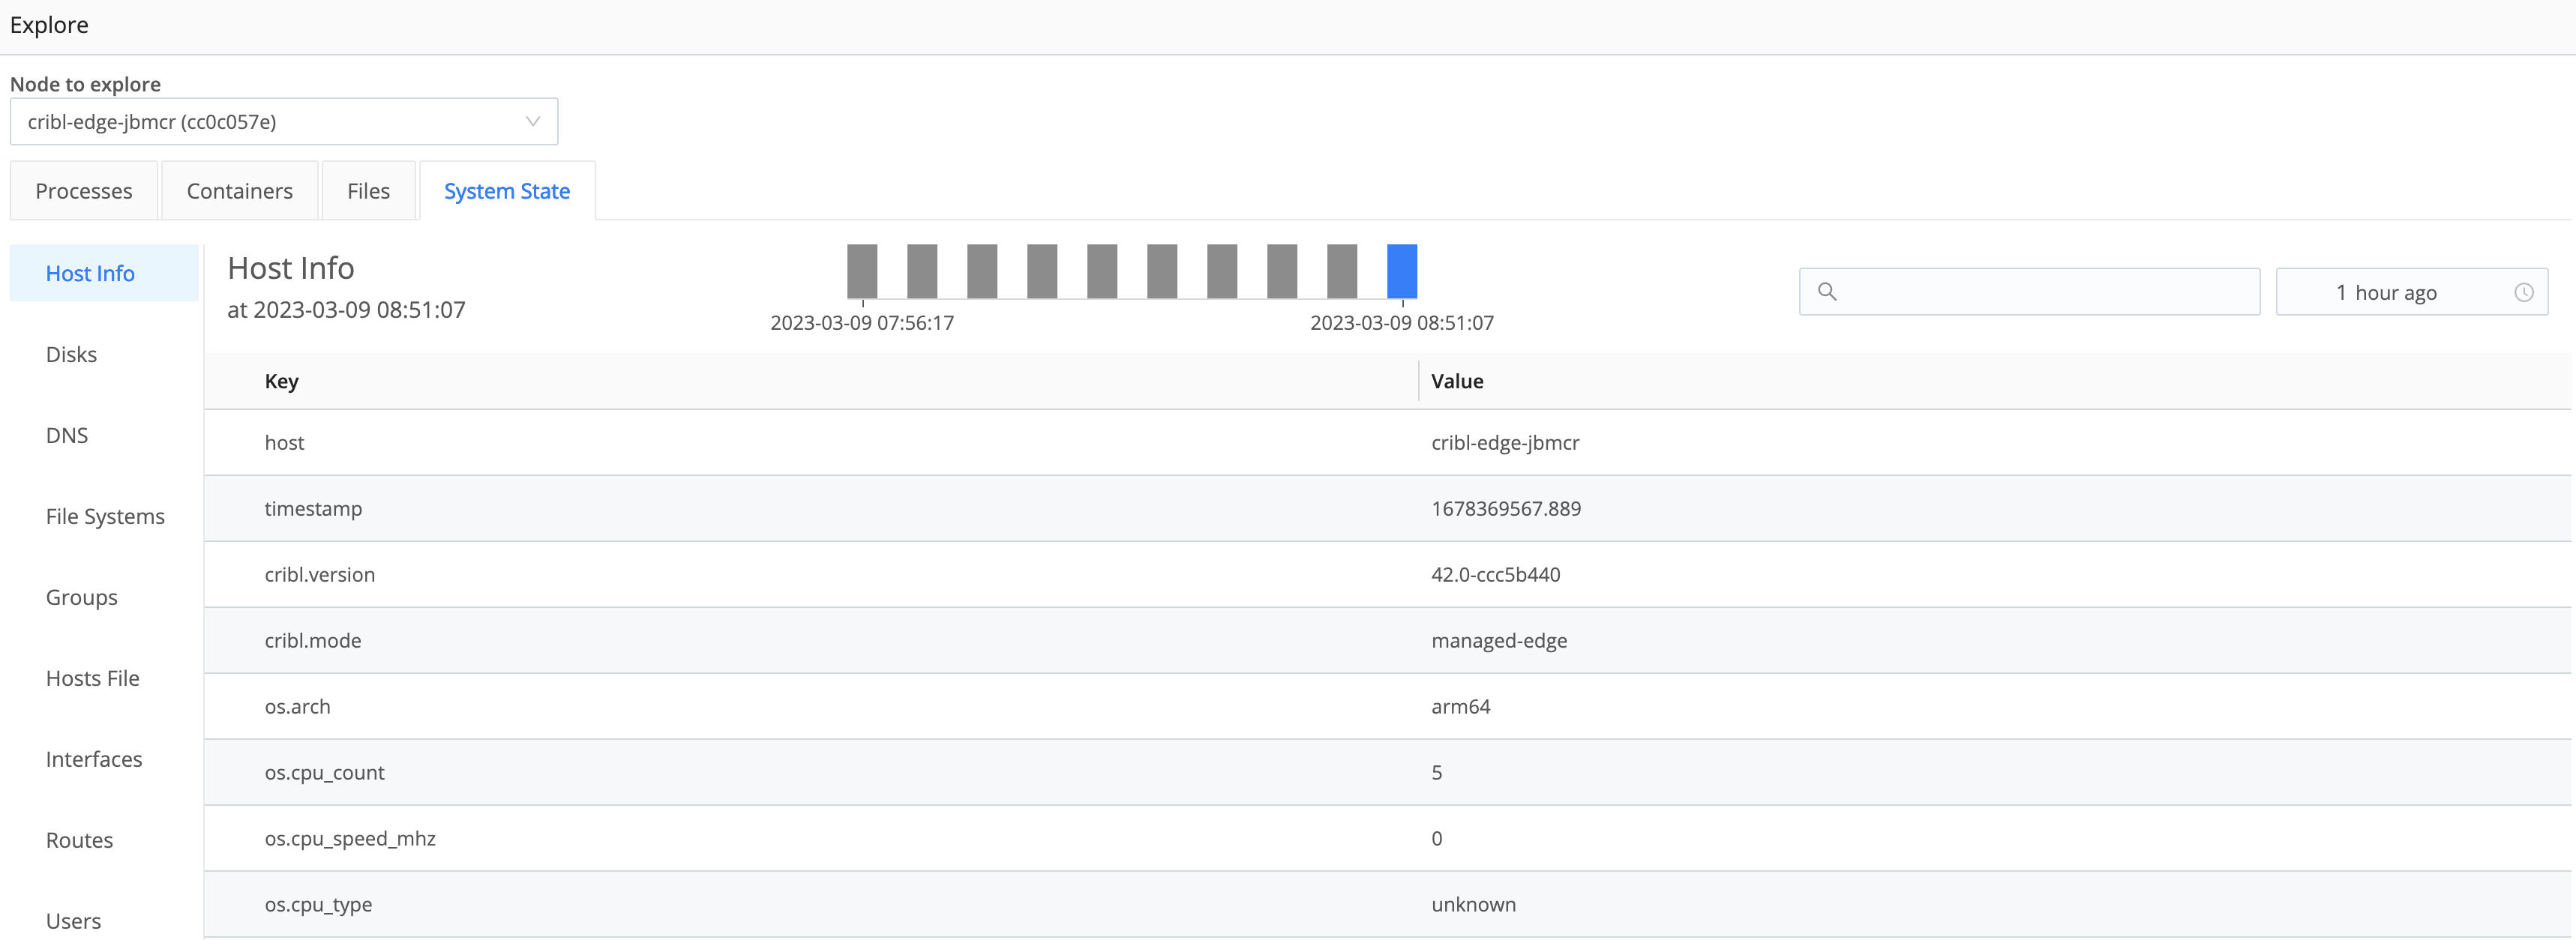
Host Info
Cribl Edge can add a __metadata property to every event emitted from every enabled Source. The System State tab displays the metadata collected for each Edge Node under Host Info.
The metadata surfaced by an Edge Node can be used to:
- Enrich events (with an internal
__metadatafield). - Display to users as a part of instance exploration.
You can customize the type of metadata collected at Fleet Settings > Limits > Metadata. Use the Event metadata sources drop-down (and/or the Add source button) to add and select metadata sources.
In Edge mode, all the Event metadata sources are enabled by default.
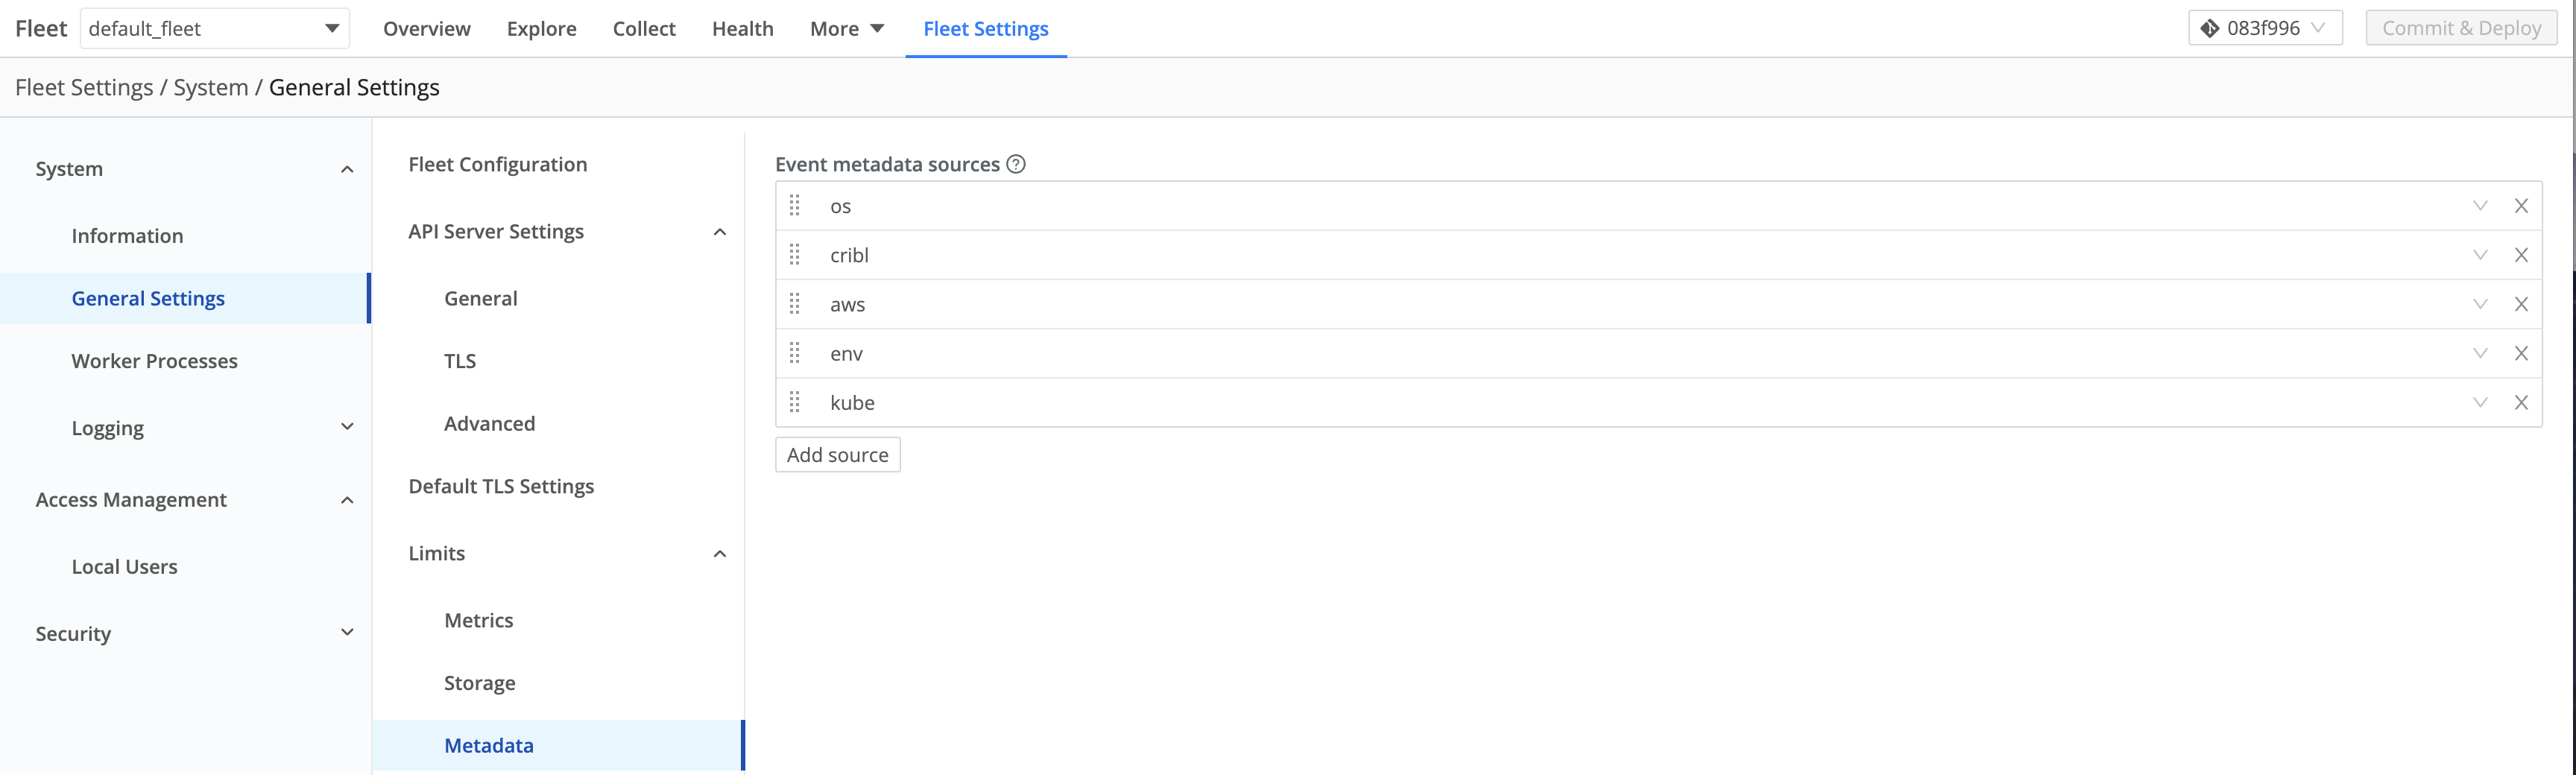
The metadata sources that you can select here include:
os: Reports details for the host OS and host machine, like OS version, kernel version, CPU and memory resources, hostname, network addresses, etc.cribl: Reports the Cribl Edge version, mode, Fleet for managed instances, and config version.aws: Reports details for an EC2 instance, including the instance type, hostname, network addresses, tags, and IAM roles. For security reasons, we report only IAM role names.env: Reports environment variables.kube: Reports details on a Kubernetes environment, including the node, Pod, and container. For details, see __metadata.kube Property.
When these metadata sources are enabled (and can get data), Cribl Edge will add the corresponding property to events, with a nested property for each enabled source.
Some metadata sources work only in configured environments. For example, the
awssource is available only when running on an AWS EC2 instance.If your security tools report denied outbound traffic to IP addresses like
169.254.169.168or169.254.169.254, you can suppress these by removingawsfrom the metadata sources described above. If you have a proxy setup, Cribl recommends adding these IP addresses to yourno_proxyenvironment variable.
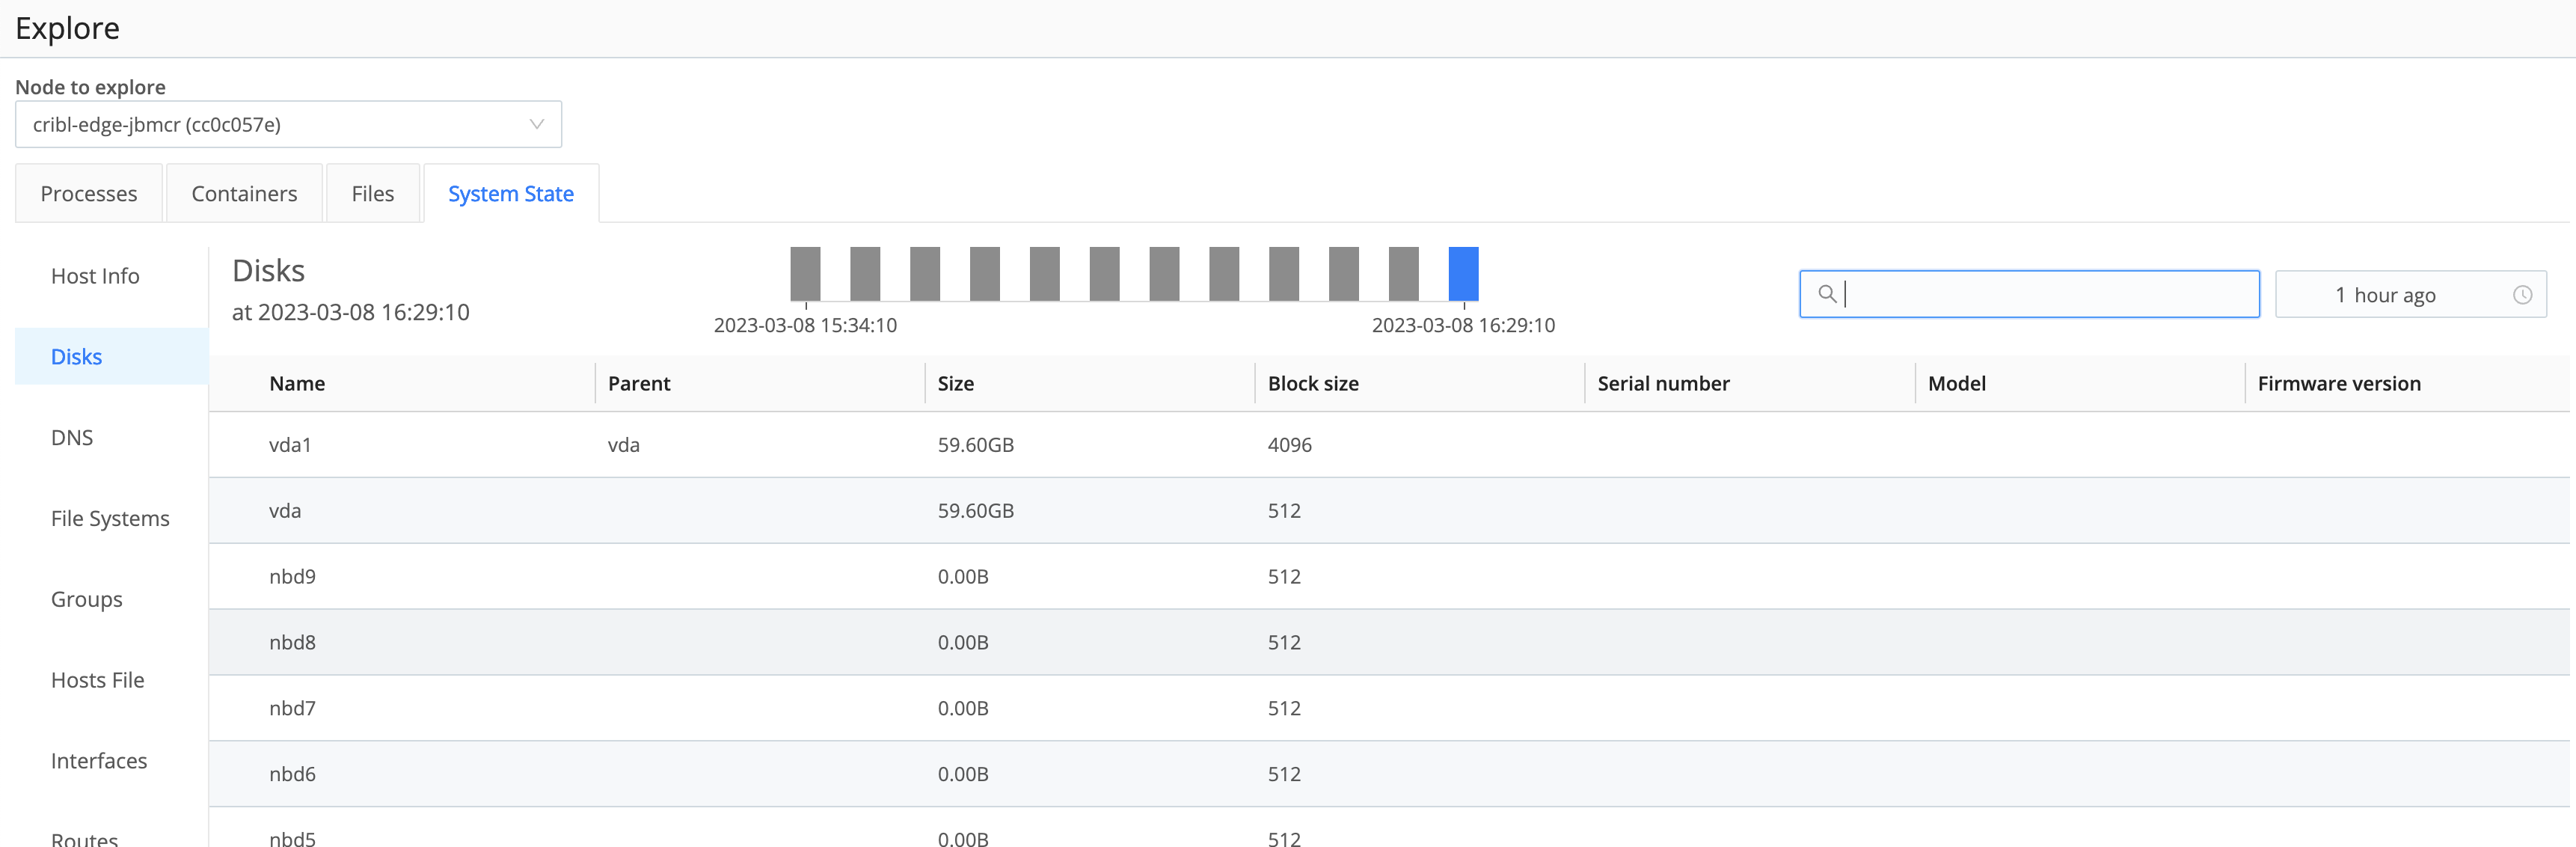
Disks
The Disks tab displays the inventory of physical disks and their partitions on the host system.
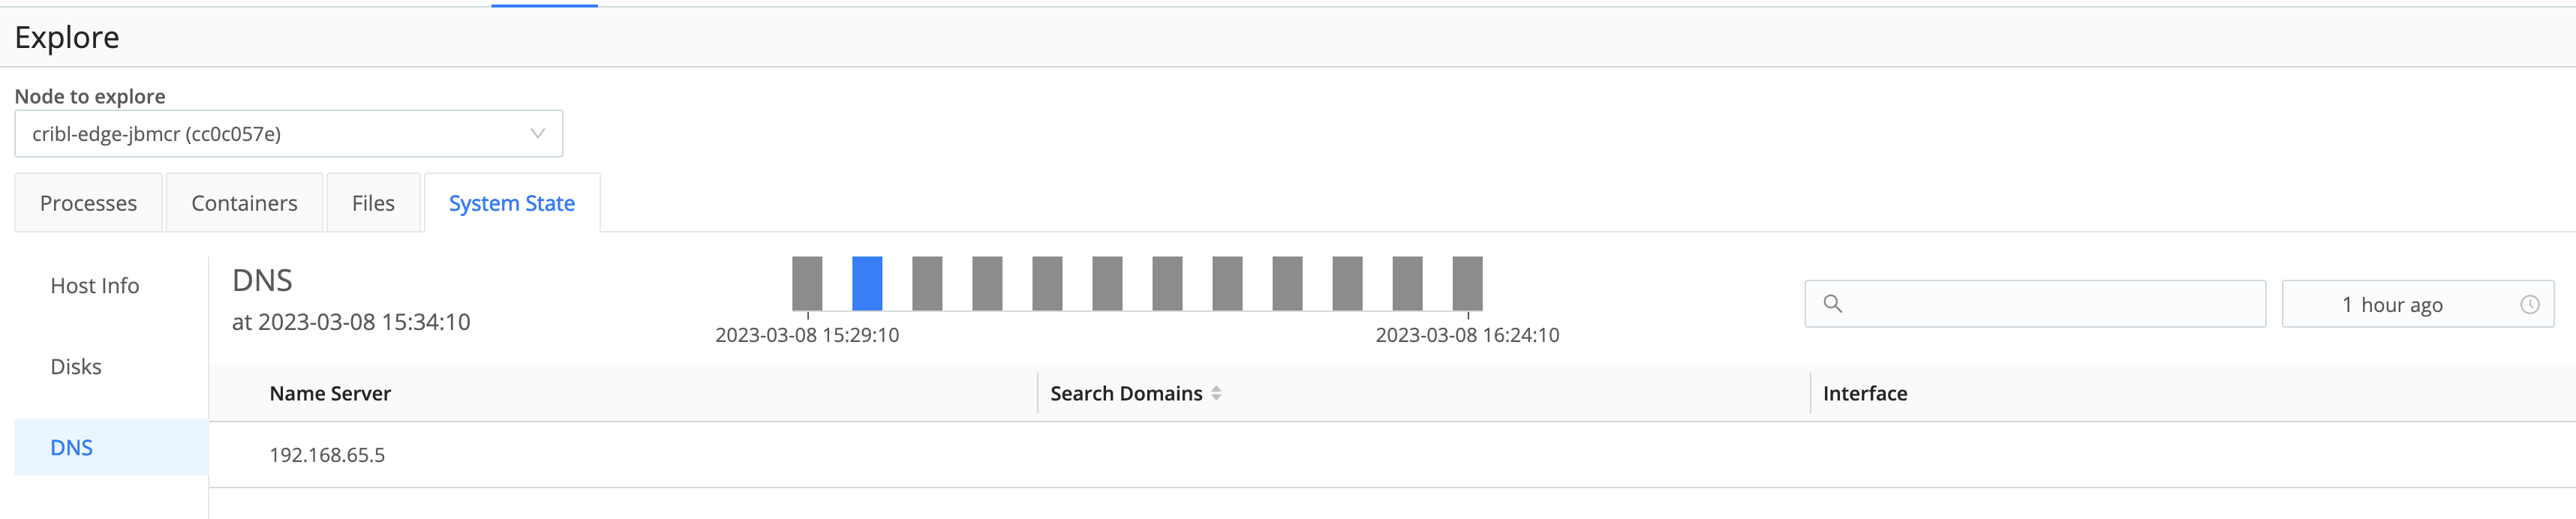
DNS
The DNS tab lists the host system’s DNS resolvers and search entries.
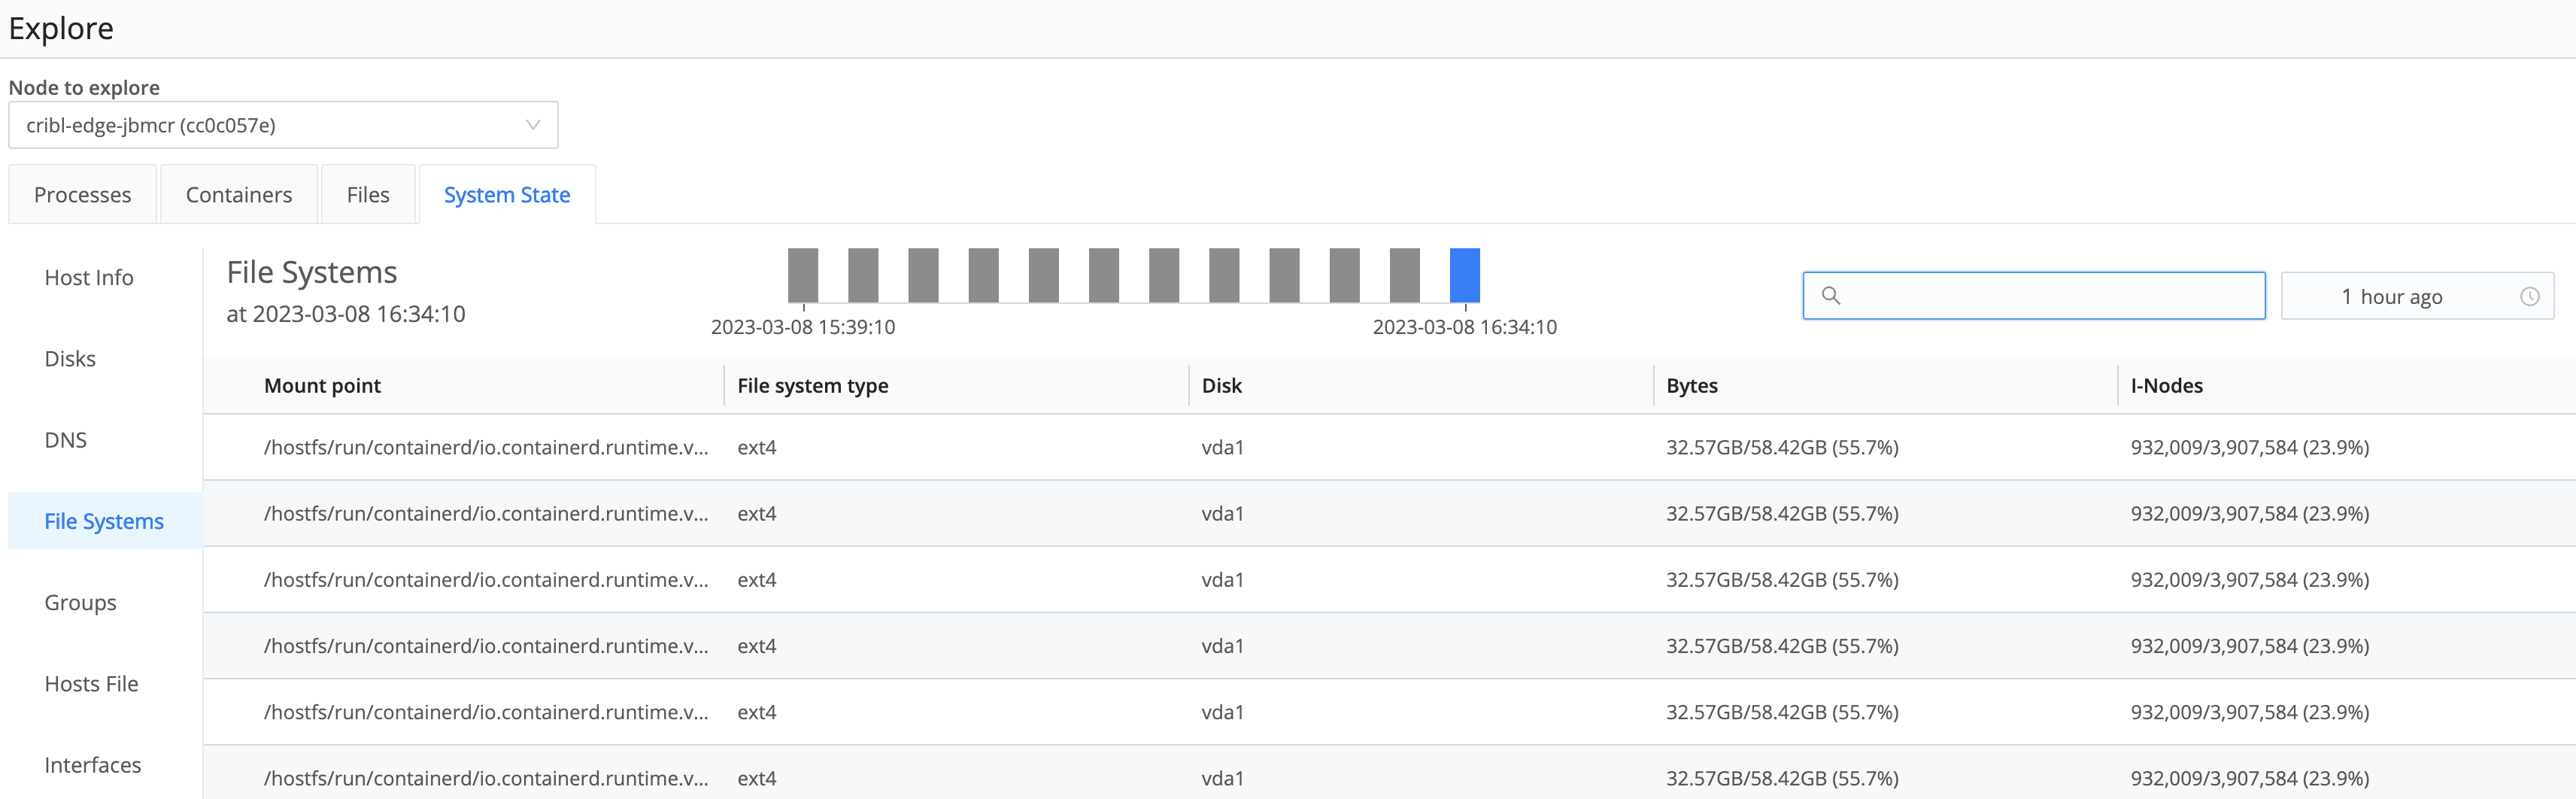
File Systems
The File Systems tab displays an inventory of the mounted file systems on the host system.
Firewall
The Firewall tab displays a list of the host’s defined firewall rules.
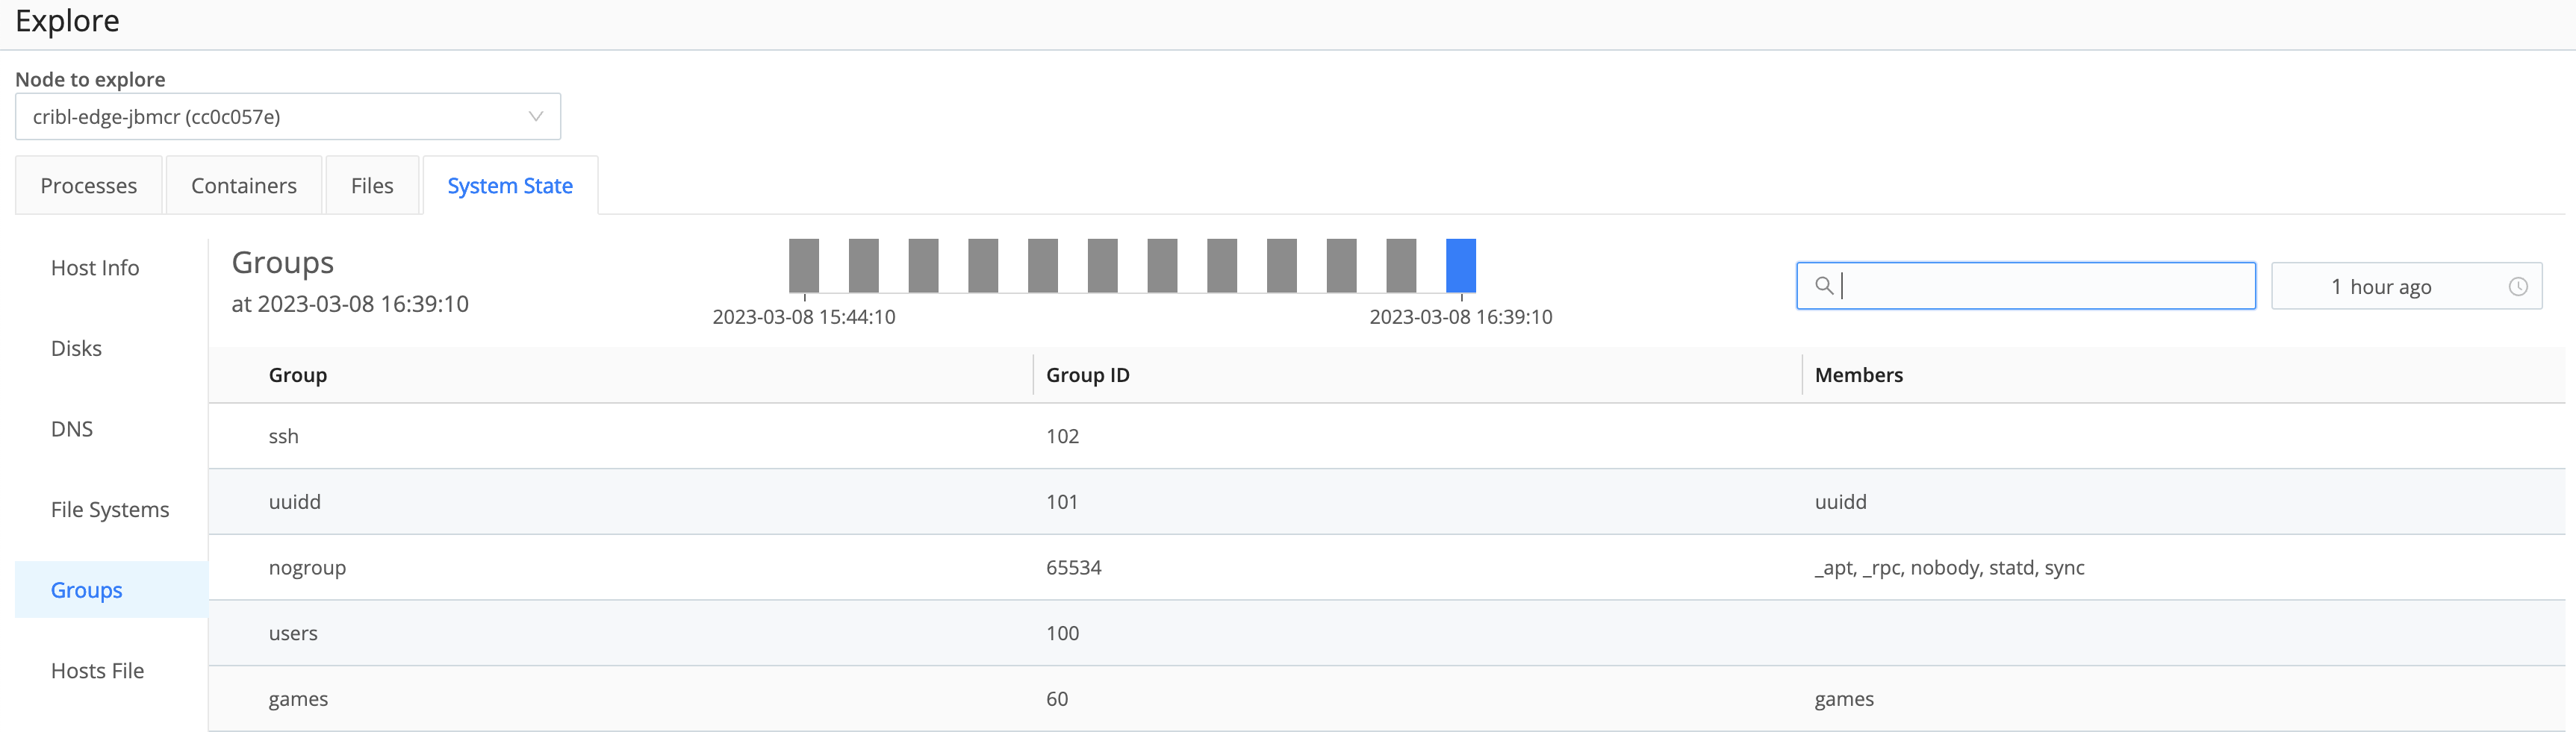
Groups
The Groups tab displays a list of the local groups including their names, descriptions, and members on the host system.
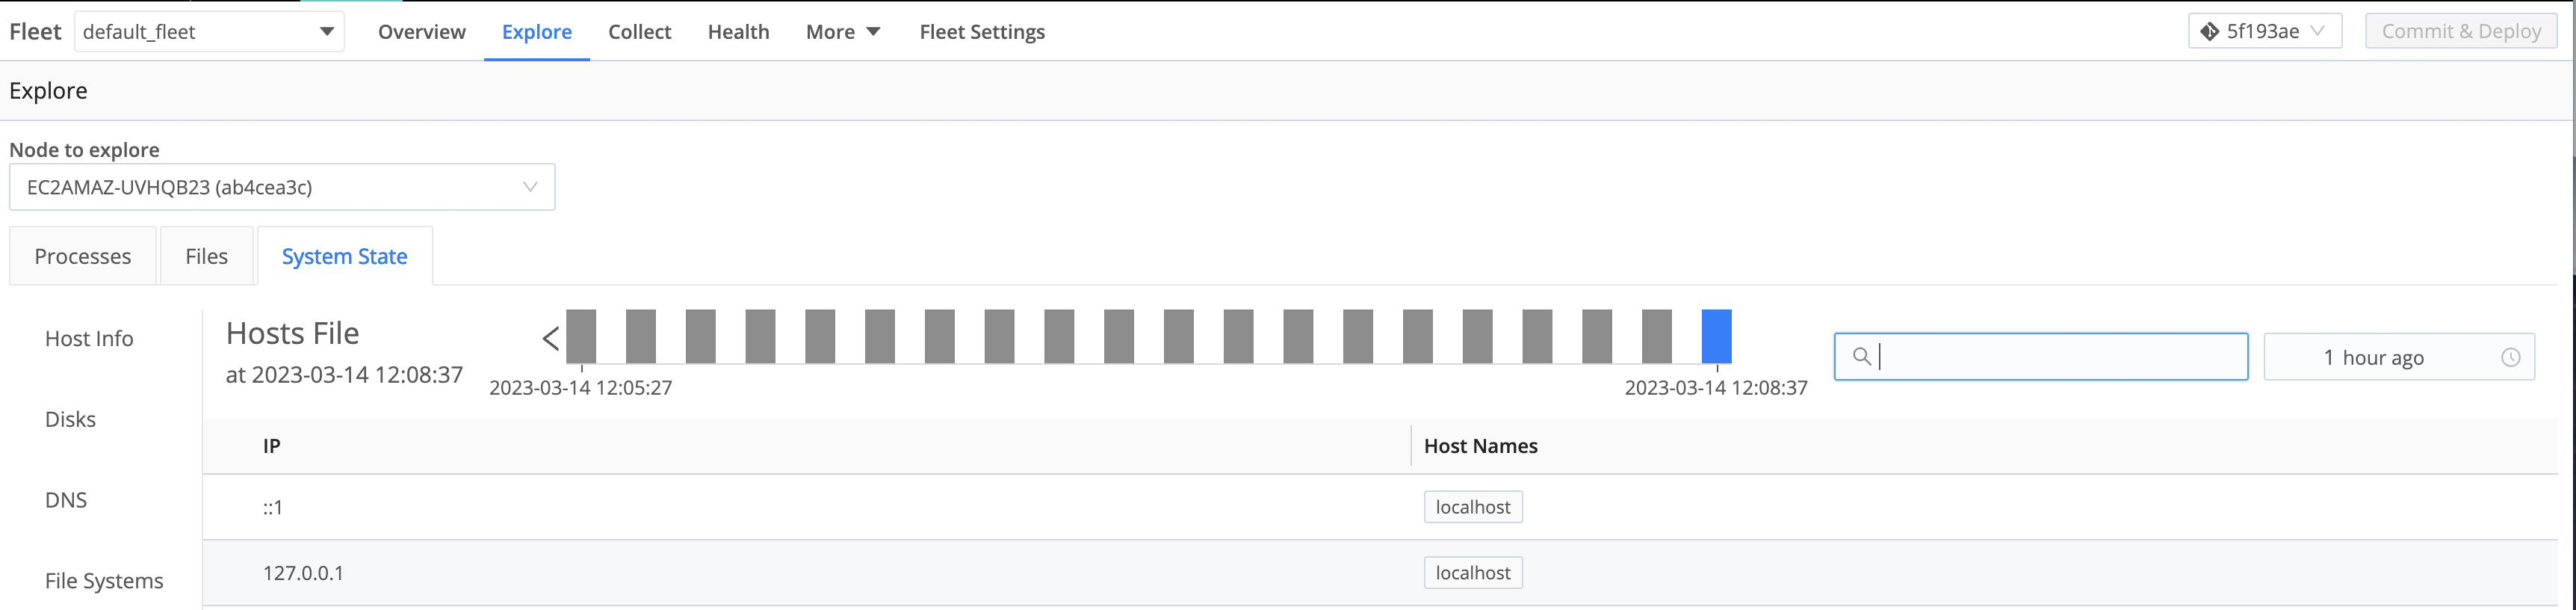
Hosts File
The Hosts File tab displays the host system’s current state.
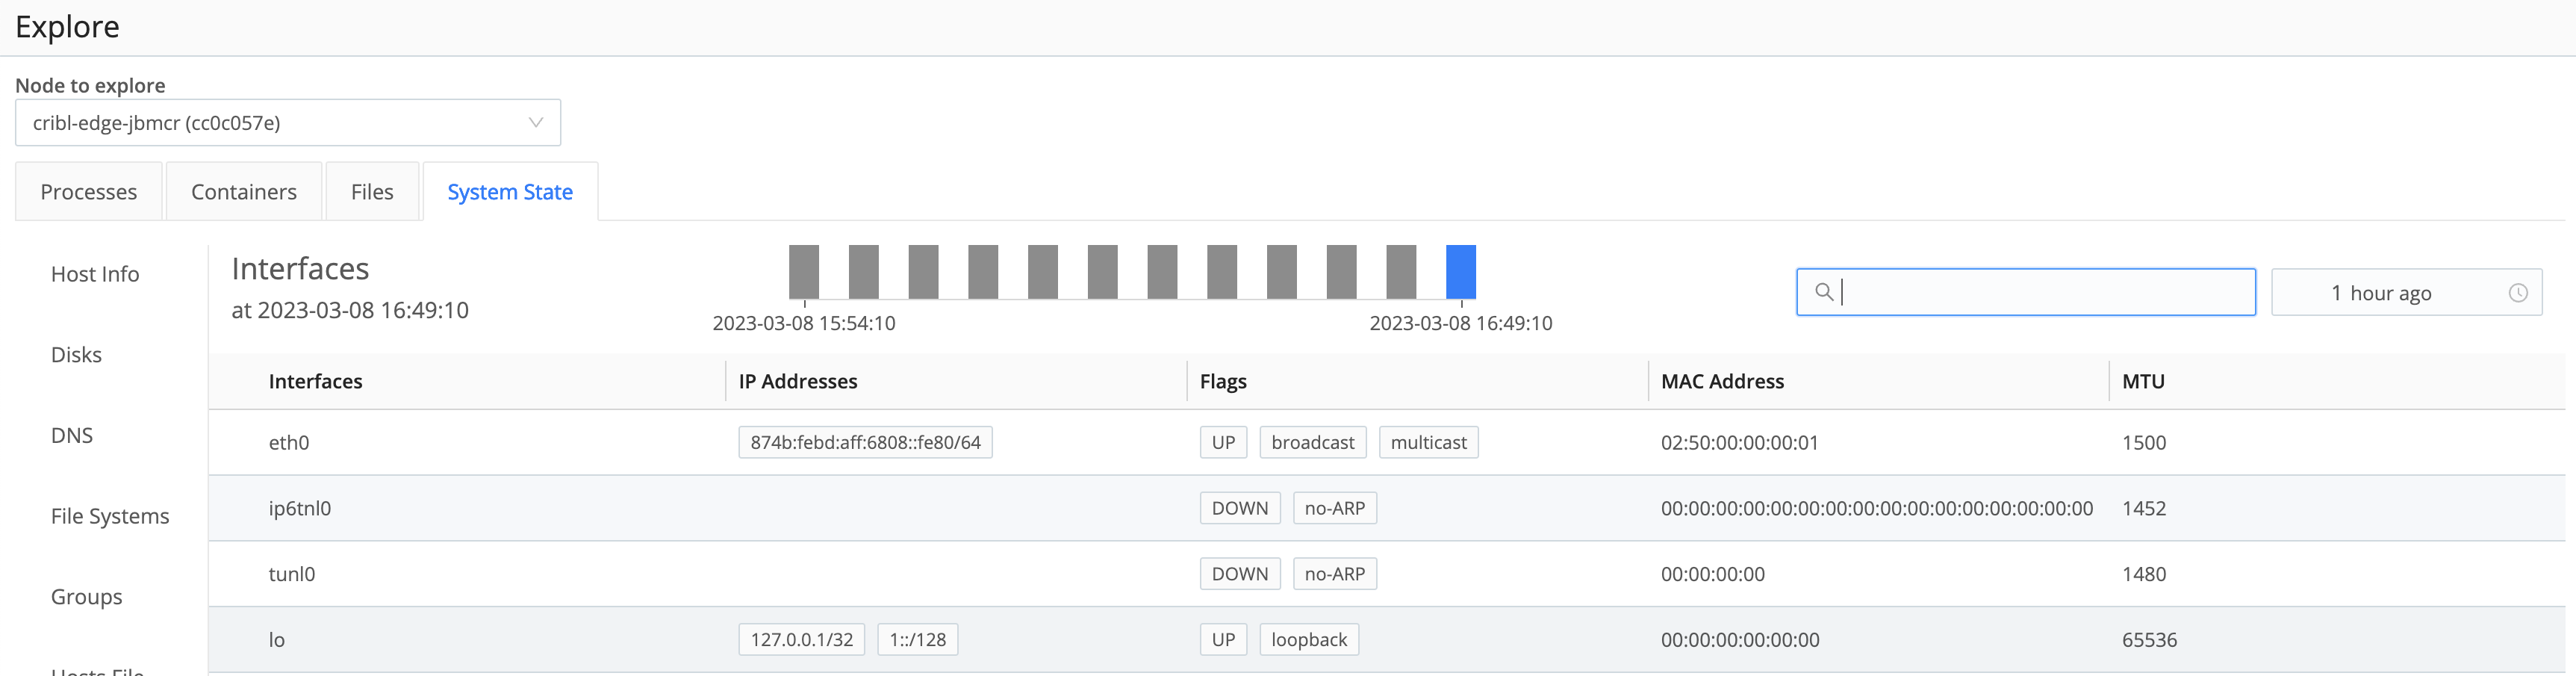
Interfaces
The Interfaces tab displays a list of each of the network interfaces on the host system.
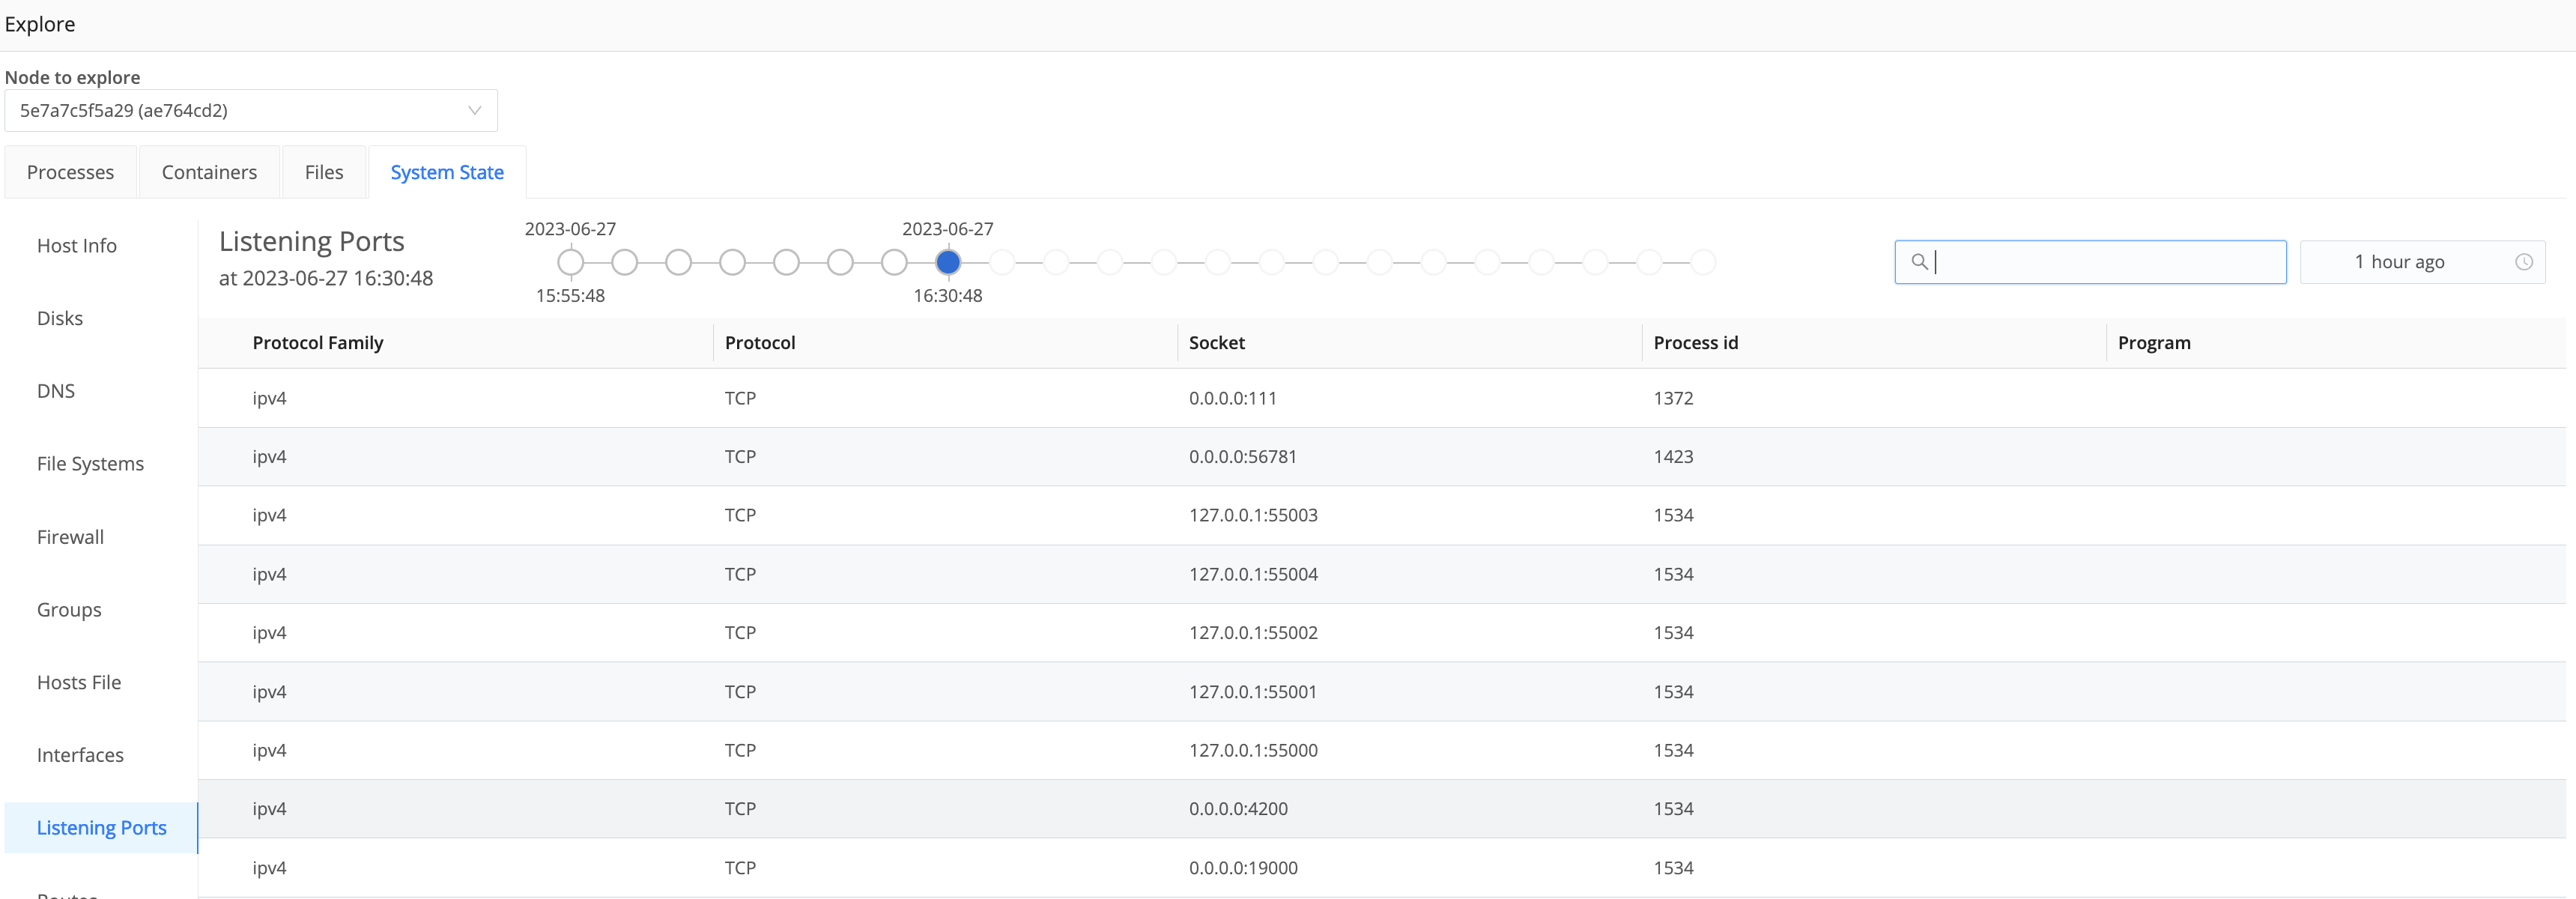
Listening Ports
The Listening Ports tab displays a list of listening ports and their associated process identifier (pid).
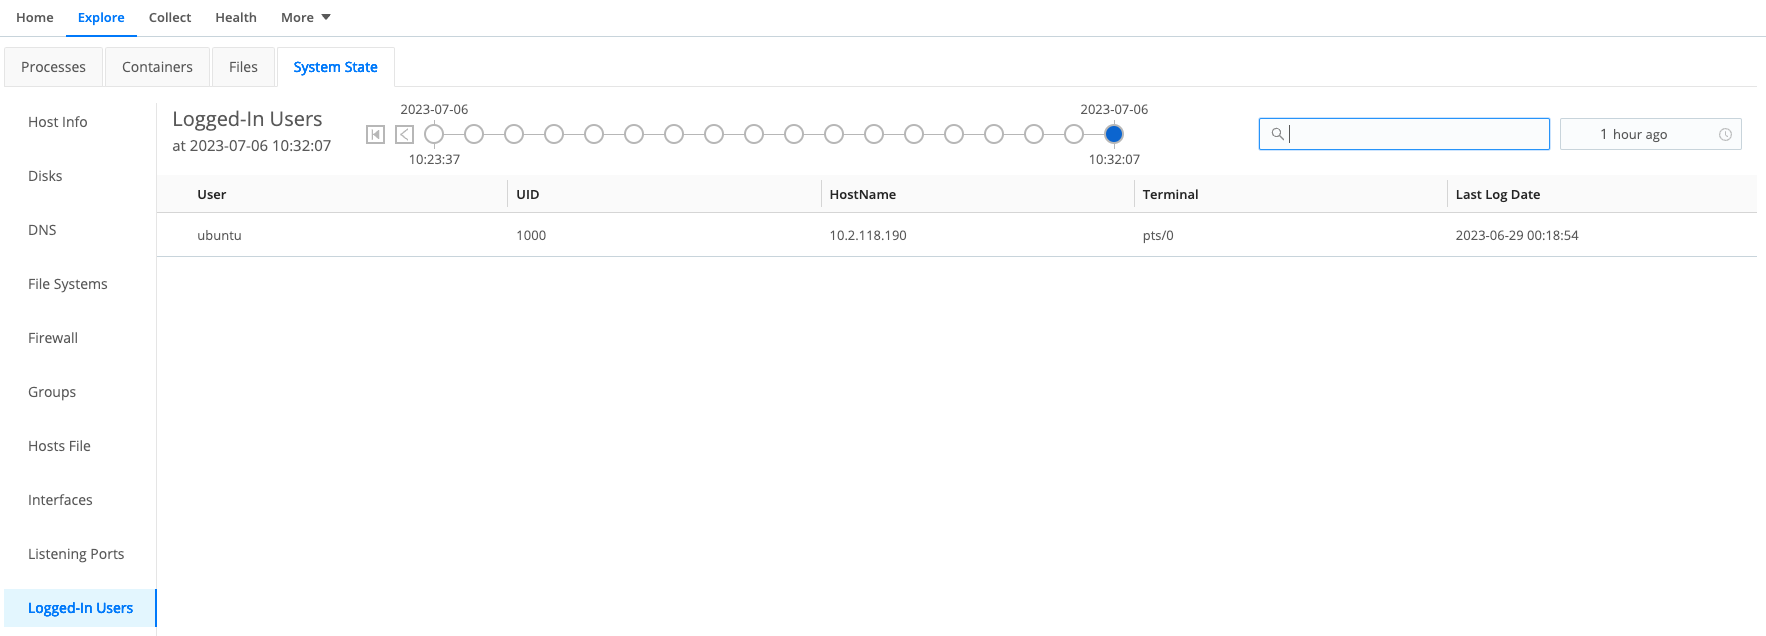
Logged-In Users
The Logged-In Users tab displays a list of currently logged-in users on the host.
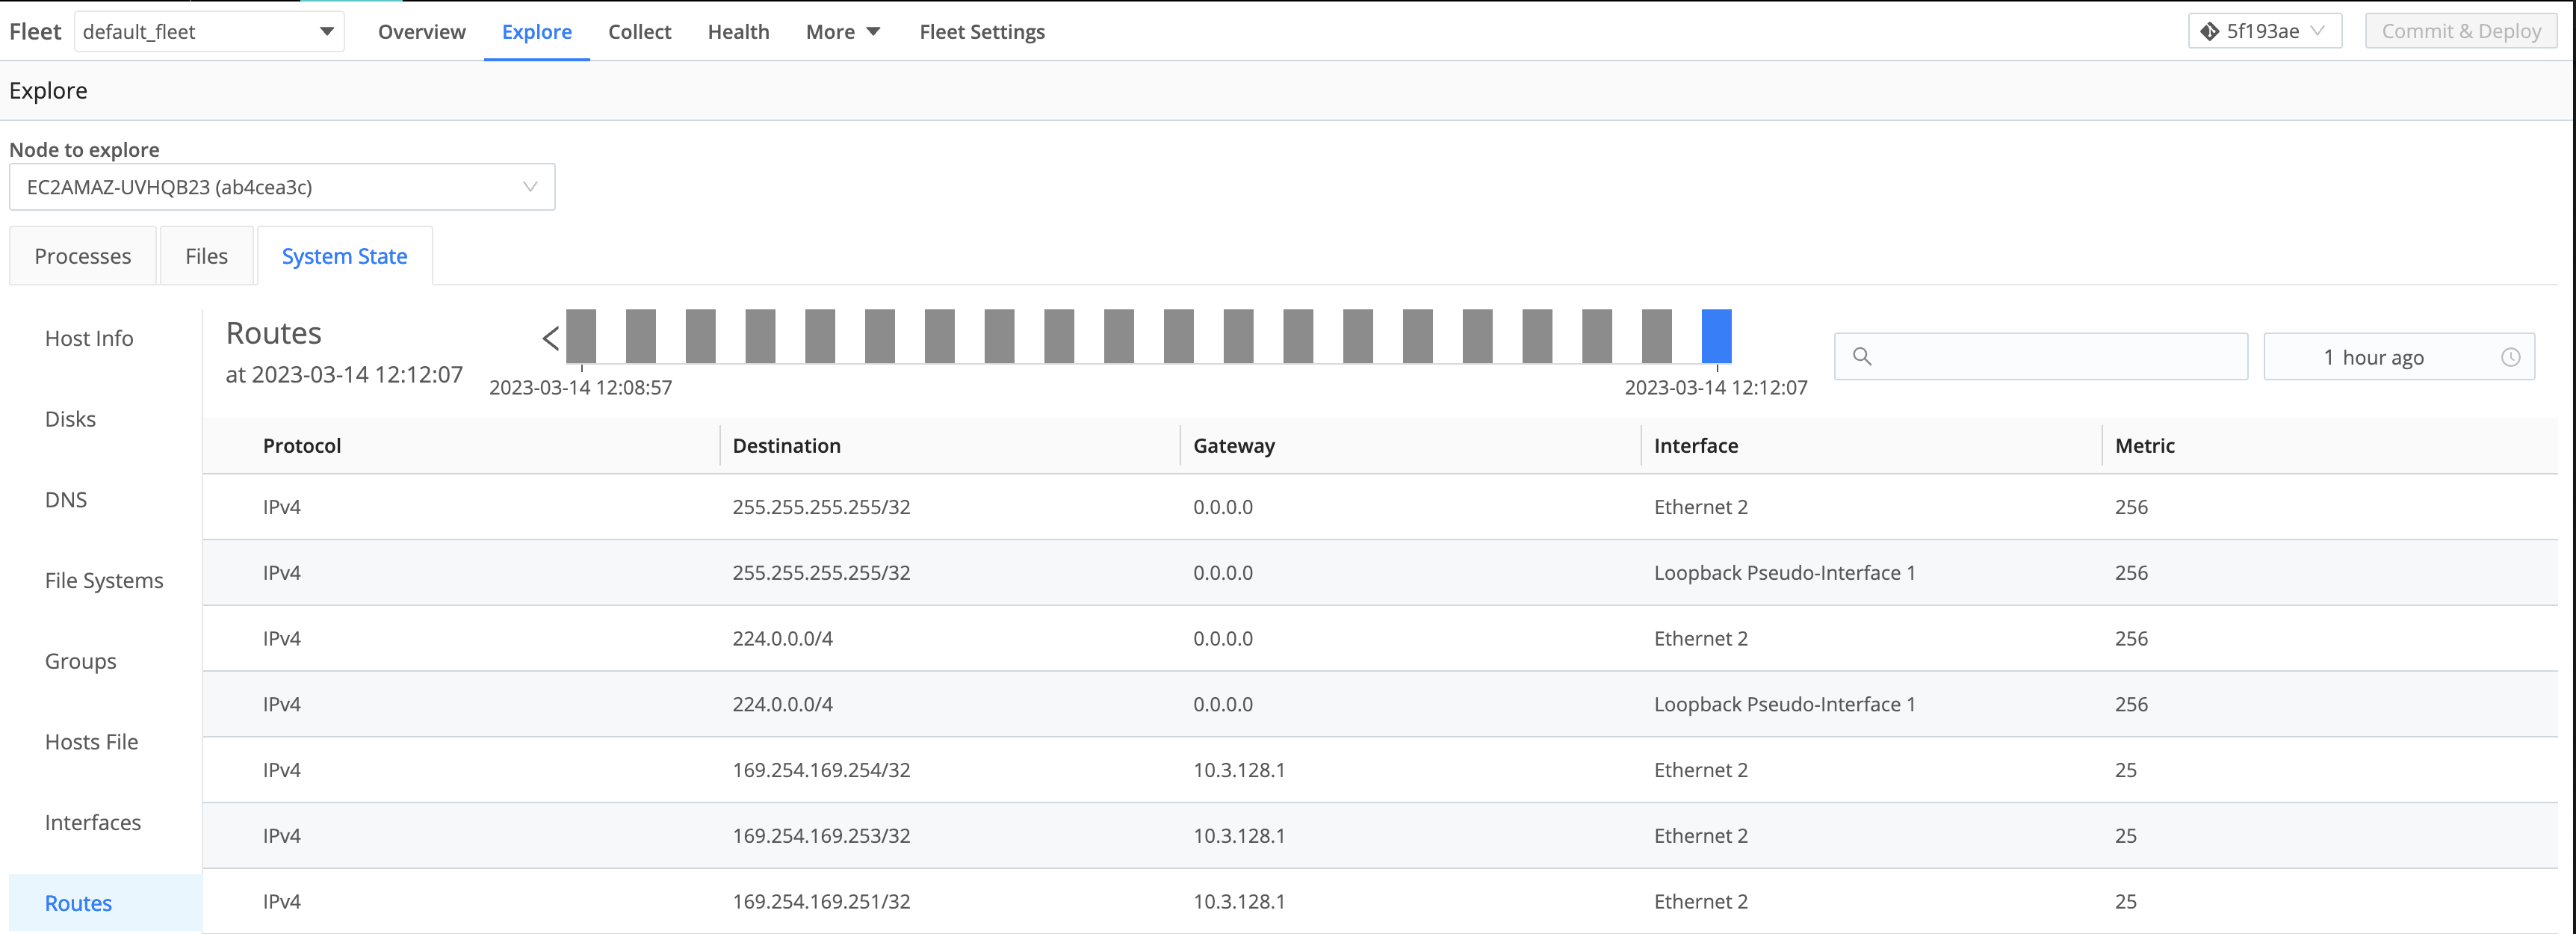
Routes
The Routes tab displays entries from the network routes on the host system.
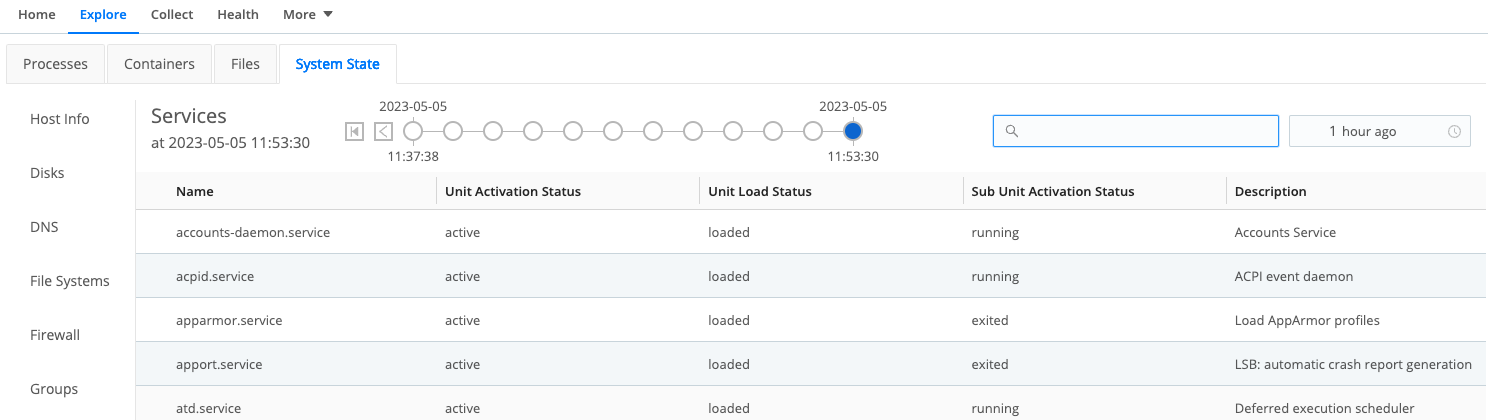
Services
The Services tab displays a list of each configured service (e.g. systemd and initd) along with their running status.
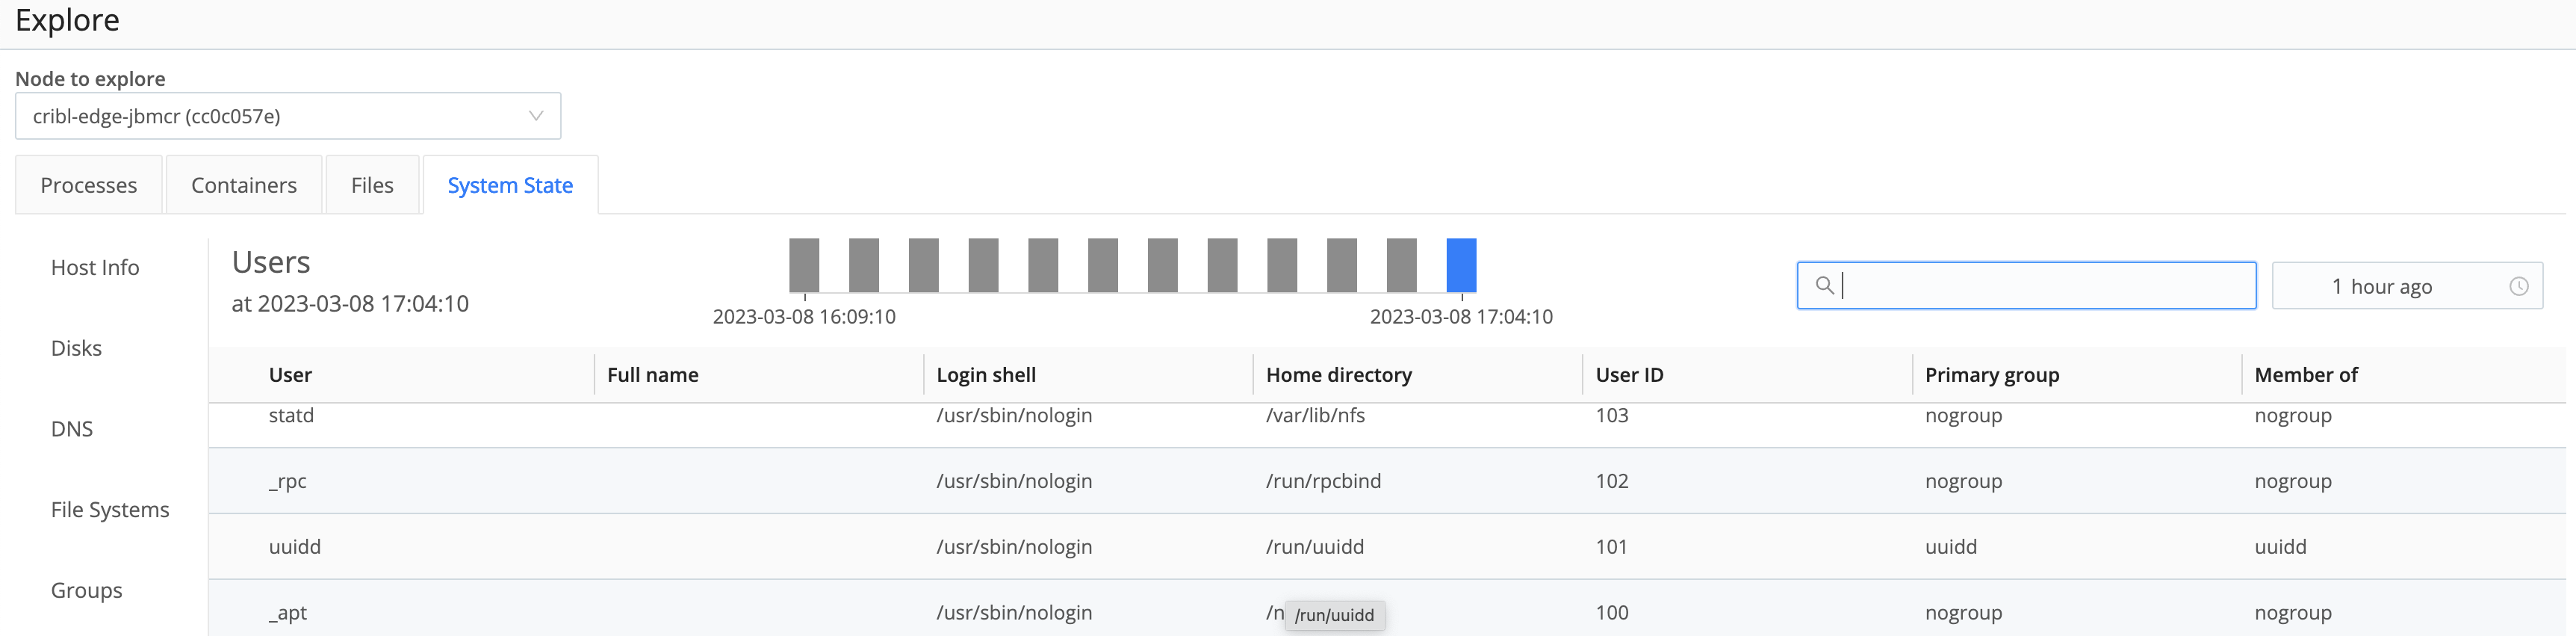
Users
The Users tab displays a list of local users on the host system.
__metadata.kube Property
For the __metadata.kube property (kube in the UI) to report details on a Kubernetes environment, Cribl Edge needs to figure out where it is running. Set the KUBE_K8S_POD environment variable to the name of the Pod in which Cribl Edge is running. At this point, the __metadata.kube property will have information to report on the node and pod properties.
If the /proc/self/cgroupis working, then the container property information will be available, too.
If you leave the
KUBE_K8S_PODenvironment variable unset, and/proc/self/cgroupis not working, then Cribl Edge will not know what Pod it is running in. This state has multiple implications:
- The Kubernetes Metrics Source will be unable to identify whether or not it is in a DaemonSet. The result will be redundant metrics from each node in the cluster.
- The Kubernetes Metadata collector will not add the
__metadata.kube property.- The Kubernetes Logs Source will also duplicate data. Every node in the cluster will collect logs for every container in the cluster.