


These docs are for Cribl Edge 4.8 and are no longer actively maintained.
See the latest version (4.17).
Managing Destinations
For each Destination type, you can create multiple definitions, depending on your requirements.
Create a Destination
To create a new Destination:
- In single-instance deployments, select Manage, then proceed to the options below.
- In distributed deployments, first select Manage, then a Fleet to configure and choose one of the options below.
You can configure a new Destination in two ways:
- To configure via the graphical QuickConnect UI:
- Select Collect.
- Select Add Destination at right.
- From the resulting drawer’s tiles, select the desired Destination type and then Add Destination.
- Or, to configure via the Routing UI:
- Select More, then Destinations.
- From the resulting page’s tiles or the Destinations left nav, select the desired type.
- Select Add Destination to open a New Destination modal.
For configuration settings specific to each Destination, check that Destination’s documentation.
Capture Outgoing Data
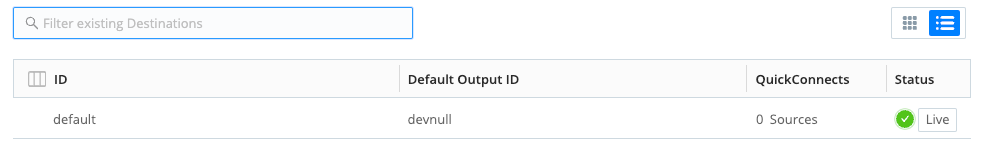
To capture data from a single enabled Destination, you can bypass the Preview pane and instead capture directly from a Manage Destinations page. Select the Live button beside the Destination you want to capture.
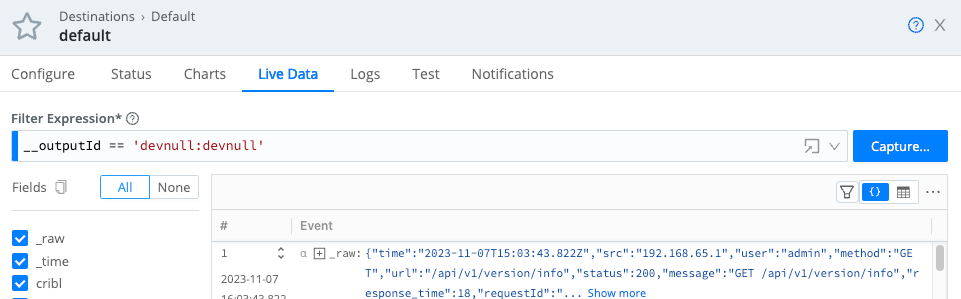
You can also start an immediate capture from within an enabled Destination’s config modal, by selecting the modal’s Live Data tab.
Monitor Destination Status
You can get a quick overview of Destination health status by referring to their status icons.
Additionally, each Destination’s configuration modal offers two tabs for monitoring: Status and Charts.
Destination Status Icons
Destination status icons are available on the More > Destinations page and for each individual Destination in the list for a specific Destination type.
The icons have the following meanings:
| Icon | Meaning |
|---|---|
| Healthy. Operating correctly. | |
| Warning. Experiencing issues.The Destination is not functioning fully. Specific conditions will depend on the Destination type. | |
| Critical. Experiencing critical issues.Drill down to the Destination’s Status tab to find out the details. | |
| Disabled.The Destination is configured, but not enabled. | |
| No health metrics available.This may mean that a Destination is enabled, but has not been deployed yet. | |
Inactive. When using GitOps, a Destination appears Inactive if its Environment field (configured under Advanced Settings) does not match the currently active environment determined by the deployed Git branch. This ensures integrations only activate in their designated environments, preventing unintended data flow or misconfiguration. |
Status Tab
The Status tab provides details about the Edge Nodes in the Fleet and their status. An icon next to each Edge Node uses color to clearly signal its health:
- : All systems go! Your Edge Node is operating normally.
- : Attention needed. There’s a potential issue with this Edge Node.
- : Stop! This Edge Node has encountered a critical error.
The way you view Edge Node statuses depends on the size of your Fleet:
Fewer than 1000 Edge Nodes: All Edge Nodes are conveniently displayed on the Status tab, along with their statuses. Use the Status checkboxes at the top to filter the list by health (healthy, warning, error).
Clicking on any Edge Node row dives deeper, providing specific details to help diagnose issues. The specific set of information provided depends on the Destination type. Keep in mind that this data only reflects process
0for each Edge Node.More than 1000 Edge Nodes: With a larger Fleet, you can select a specific Edge Node from the drop-down menu (showing up to 100 Nodes). You can search by
hostnameorGUIDto find a specific Node. You can also use the Status checkboxes to filter which Edge Nodes appear in the drop-down list.
The content of the Status tab is loaded live when you open it and only displayed when all the data is ready. With a lot of busy Edge Nodes in a group, or Nodes located far from the Leader, there may be a delay before you see any information.
The statistics presented are reset when the Edge Node restarts.
Charts Tab
The Charts tab presents a visualization of the recent activity on the Destination. The following data is available:
- Events in
- Thruput in (events per second)
- Bytes in
- Thruput in (bytes per second)
- Blocked status
This data (in contrast with the status tab) is read almost instantly and does not reset when restarting an Edge Node.