


These docs are for Cribl Edge 4.9 and are no longer actively maintained.
See the latest version (4.17).
Data Preview
Cribl Edge’s Sample Data and Data Preview features enable you to visually inspect events as they flow into and out of a Pipeline. Preview helps you shape and control events before they’re delivered to a Destination, and helps you troubleshoot Pipeline Functions.
Preview works by taking a set of sample events and passing them through the Pipeline, while displaying the inbound and outbound results in a separate pane. Any time a Function is modified, added, or removed, the Pipeline changes, and so does its displayed output.
The Preview pane is shown below, to the right of the Pipelines pane.
You can press the
](right-bracket) shortcut key to toggle the visibility of the Preview pane. (This shortcut works when no field has focus.)
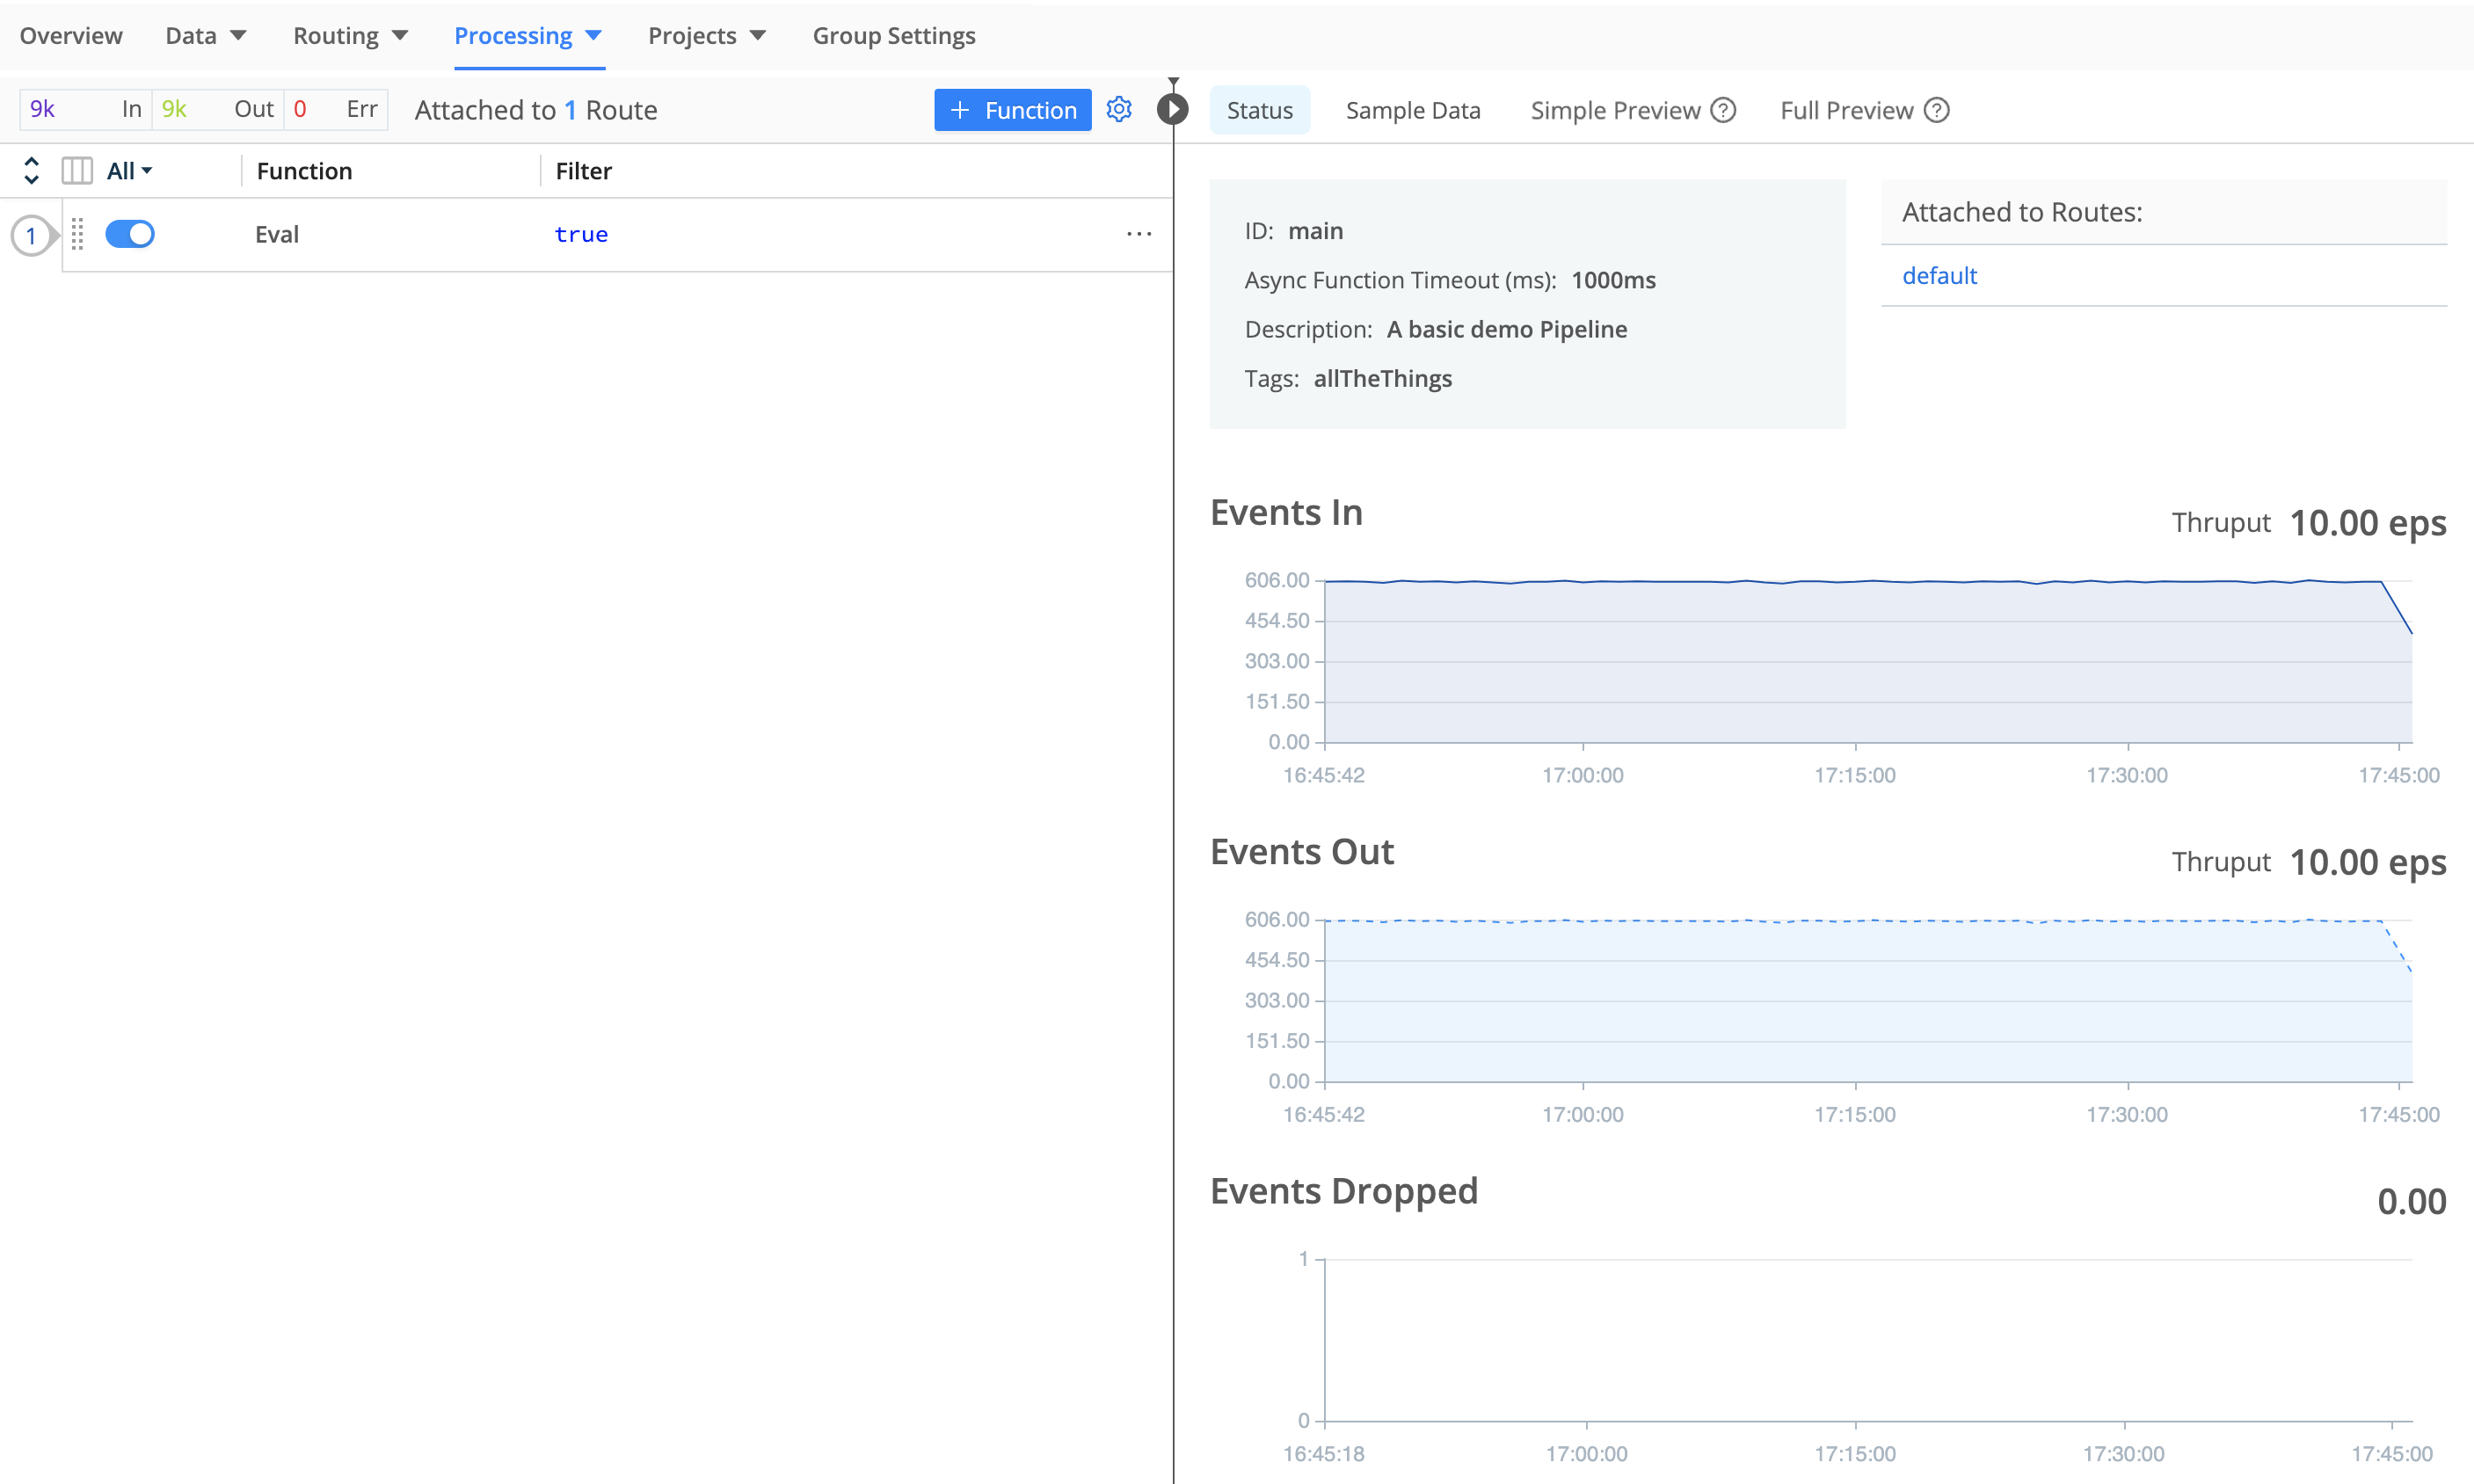
Check Pipeline Status
From the Pipelines page, select any Pipeline at left to display a Status tab in the right Preview pane. Select this tab to reveal graphs of the Pipeline’s Events In, Events Out, and Events Dropped over time, along with summary throughput statistics (in events per second).
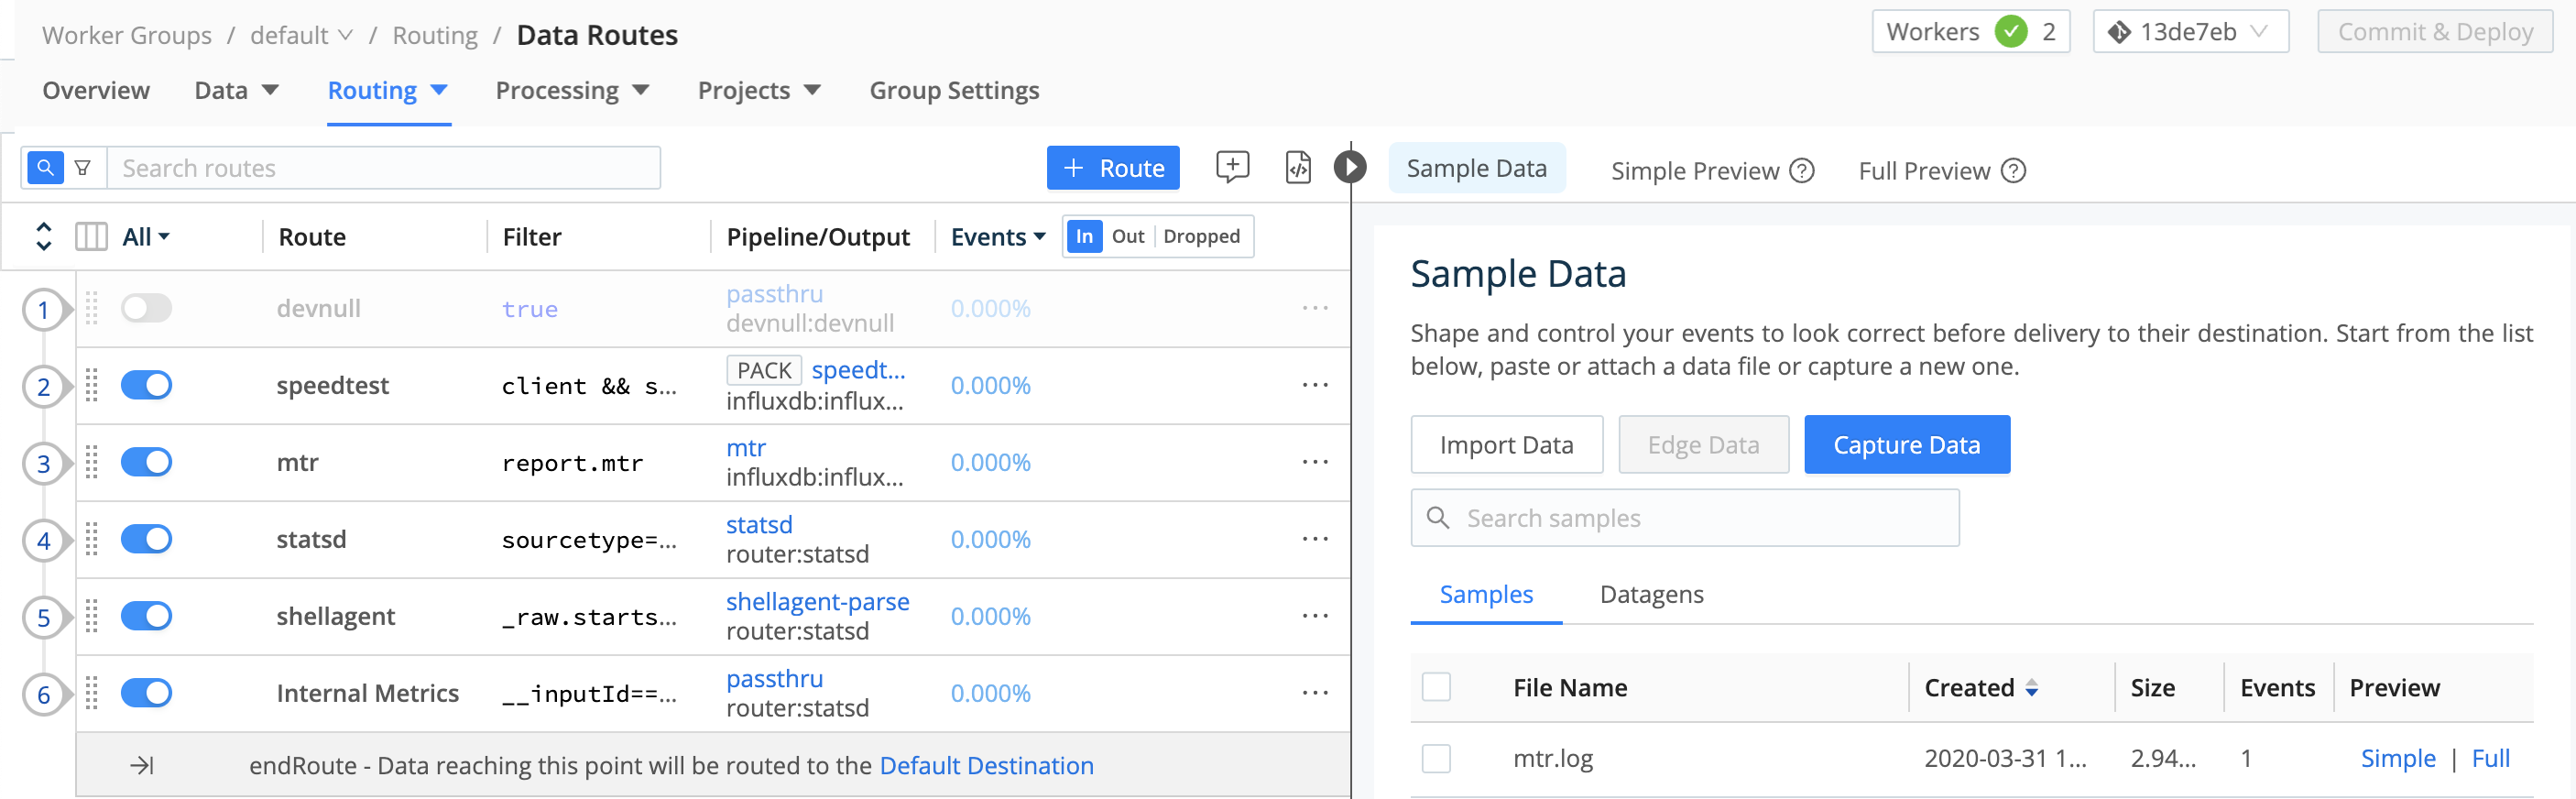
Add Sample Data
When you’re on the Pipelines or Routes page, you can add samples through any of the Preview pane’s supported options:
- Import Data: Opens a modal where you can paste data from your clipboard or use the Upload File button
- Edge Data: Lets you import data from any Edge Nodes deployed on your account
- Capture New
The Import Data options work with content that needs to be broken into events, while the Capture New option works with events only.
The Edge Nodes option requires at least one working Edge Node, and is not available when you’ve teleported to the Node.
Paste Area
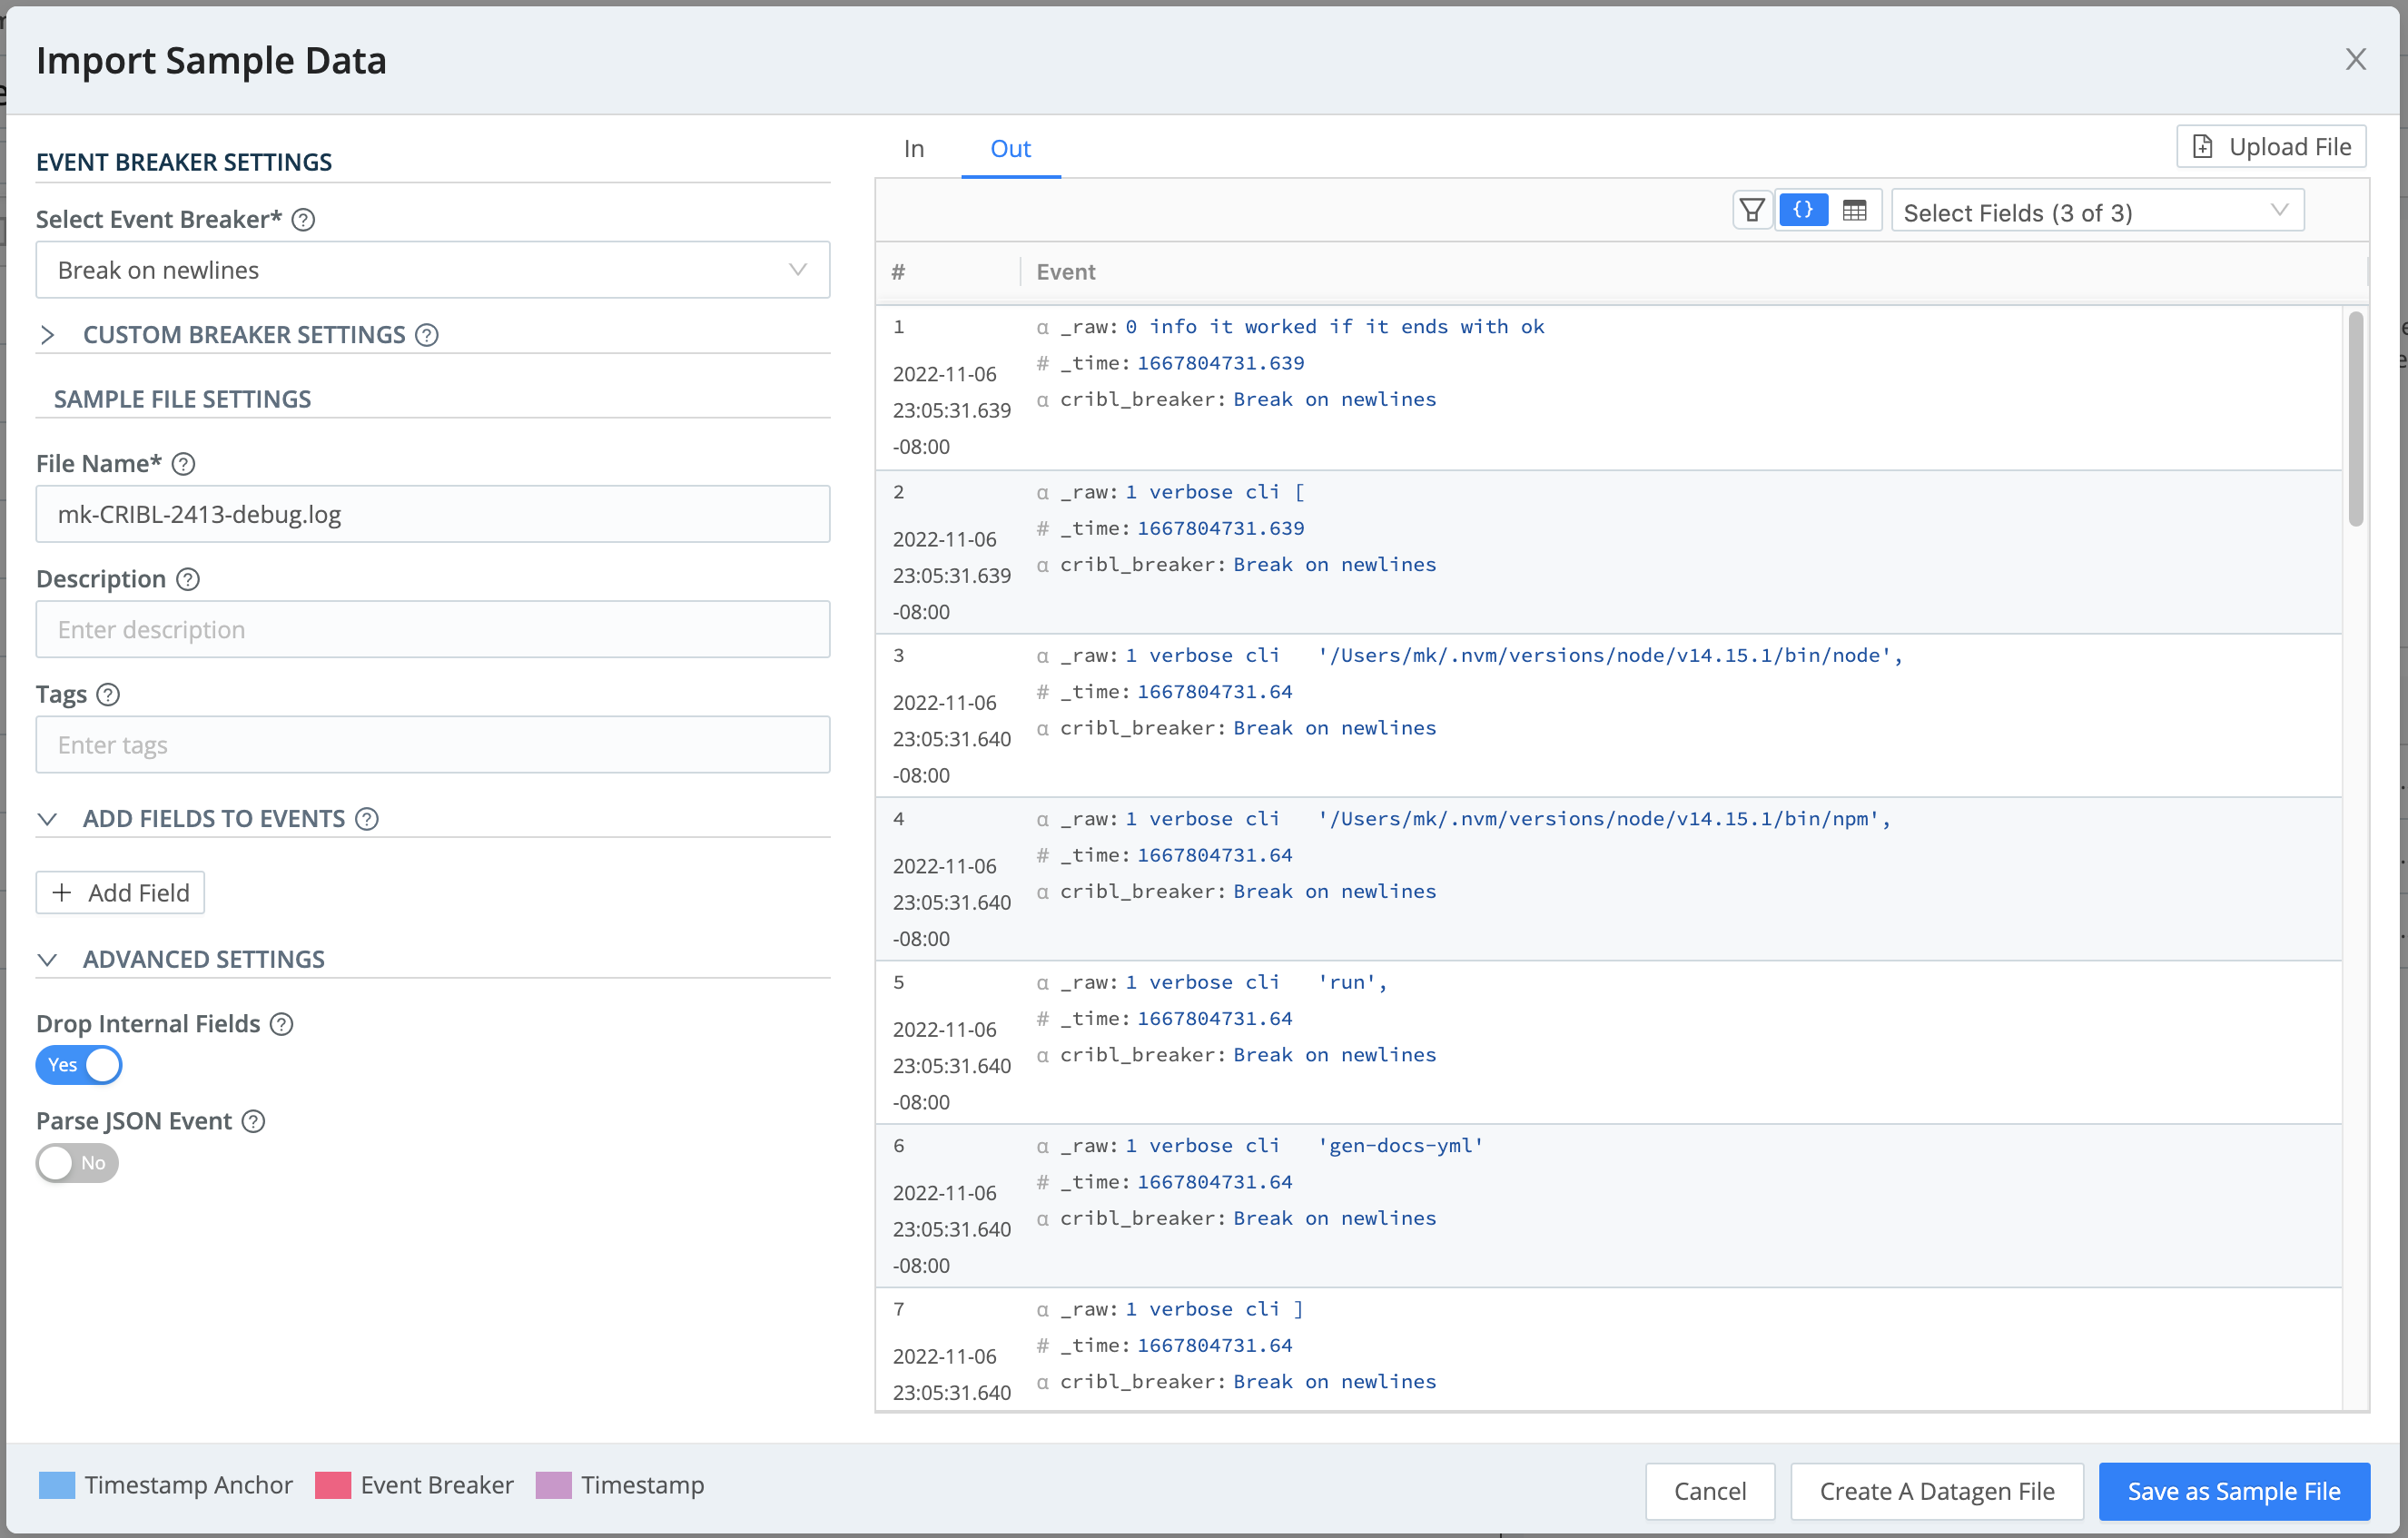
Once you’ve selected Import Data or imported Edge data, you’ll see an Import Sample Data modal, where you can paste data or upload a file.

Once your data is onboard, you have options to modify it using Event Breakers, to add and drop fields, and to save it to a file.
Edge Data
To upload data from a file on an Edge node:
Select Edge Data and navigate to the Edge node where the file is stored.
Selecting the Edge Node opens the Select a file modal.
In Manual mode, use the available filters to narrow the results:
- Path: Sets the location from which to discover files.
- Allowlist: This filter supports wildcard syntax (as shown in the screenshot above), and supports the exclamation mark (
!) for negation. - Max depth: Sets which layers of files to return highlighted in bold typeface. By default, this field is empty, which implicitly specifies
0. This default will boldface only the top-level files within the Path.
Once you find the file you want, select its name to add its contents to the Add Sample Data modal, where you’ll finish configuring the data sample.
Event Breaker Settings
Cribl Event Breakers are regular expressions that tell Cribl Edge how to break the file or pasted content into events. Breaking will occur at the start of the match. Cribl Edge ships with several common breaker patterns out of the box, but you can also configure custom breakers. The UI here is interactive, and you can iterate until you find the exact pattern.
Troubleshoot Event Breakers
If you notice fragmented events, check whether Cribl Edge has added a __timeoutFlush internal field to them. This diagnostic field’s presence indicates that the events were flushed because the Event Breaker buffer timed out while processing them. These timeouts can be due to large incoming events, backpressure, or other causes.
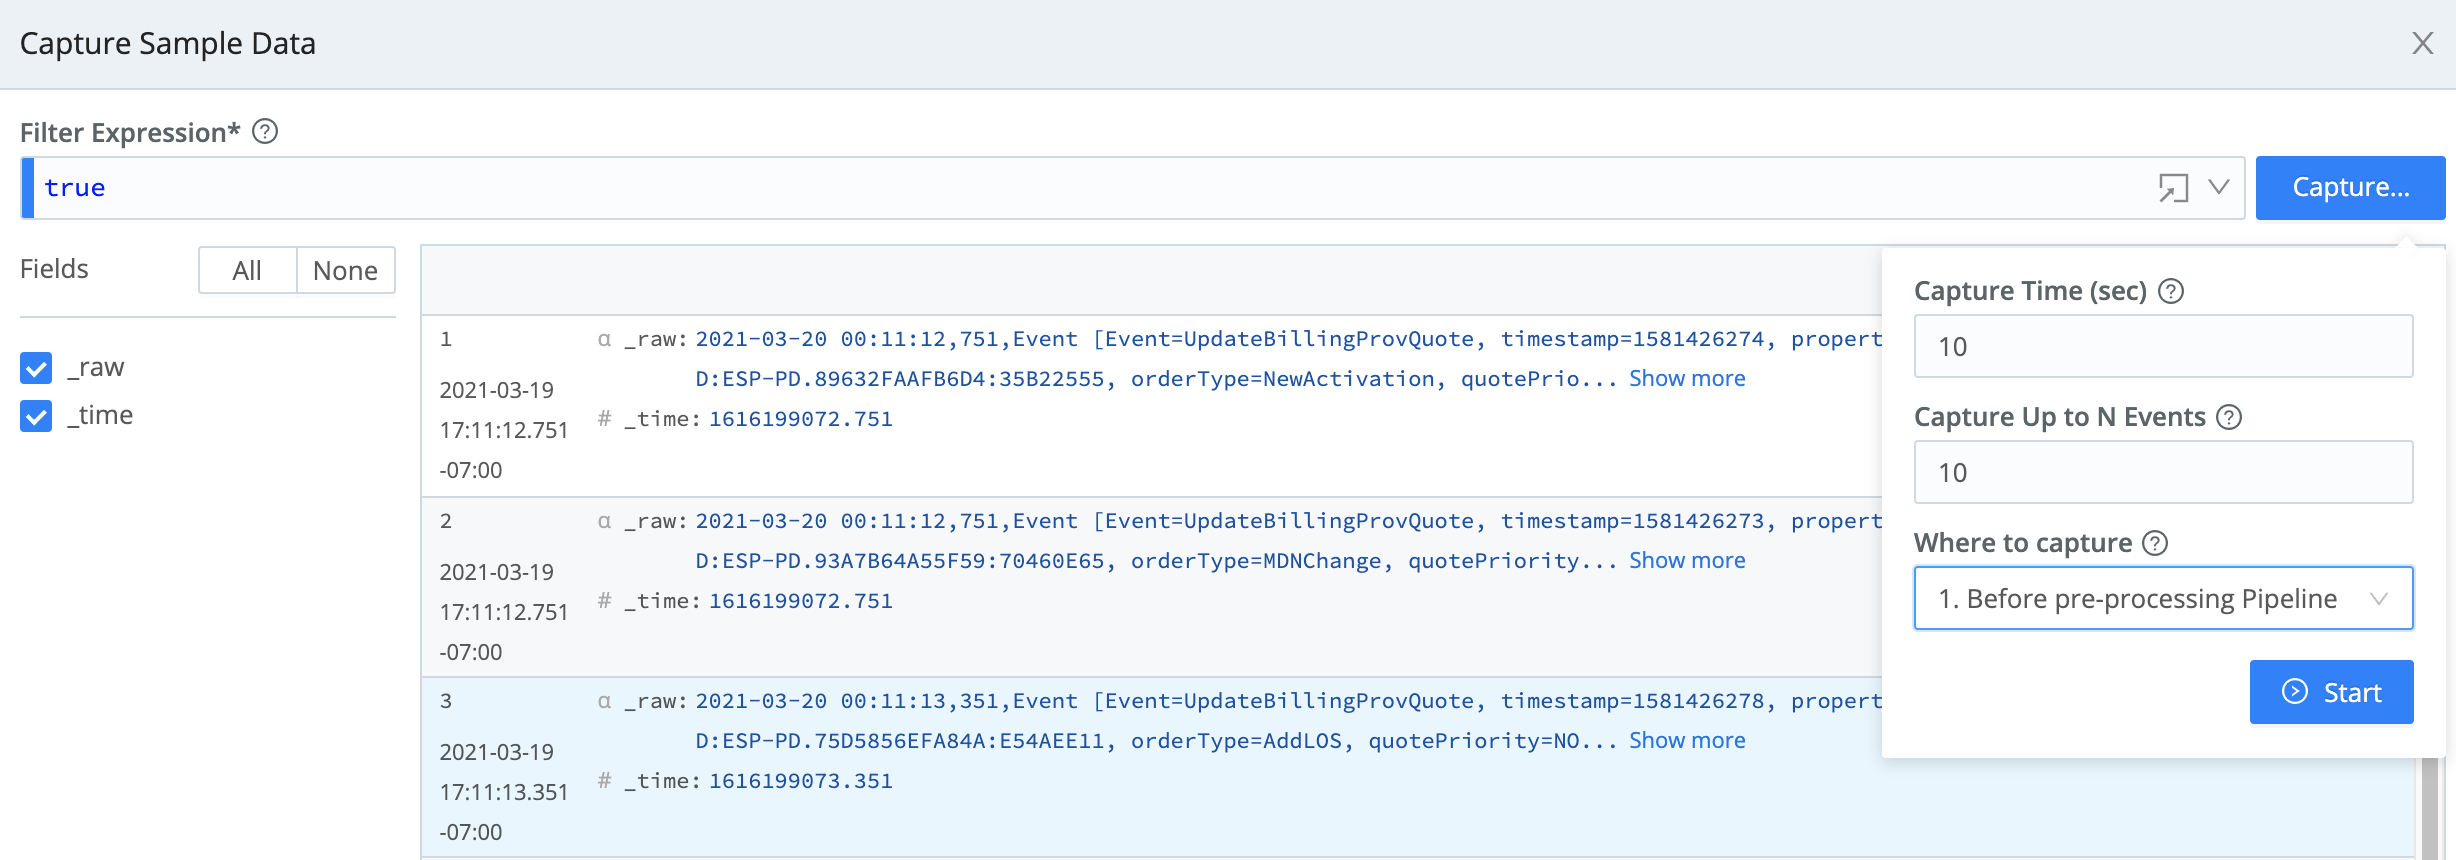
Capture Sample Data
The Capture Data button opens a slightly different modal - it does not require event breaking.
In order to capture live data, you must have Edge Nodes registered to the Fleet for which you’re viewing events. You can view registered Edge Nodes from the Status tab in the Source.
In the composite screenshot below, we’ve already captured some events using the Capture drop-down.
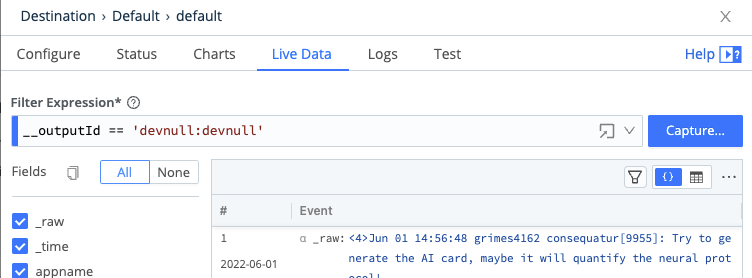
Capture from a Single Source or Destination
To capture data from a single enabled Source or Destination, it’s fastest to use the Sources or Destinations UI instead of the Preview pane. You can initiate an immediate capture by selecting Live on the Source’s or Destination’s configuration row.

You can similarly start an immediate capture from within an enabled Source’s or Destination’s configuration modal, by selecting the modal’s Live Data tab.
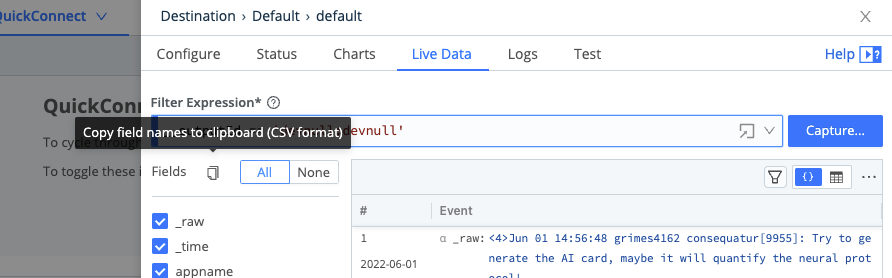
Beside the Live Data tab’s Fields selectors is a Copy button, which enables you to copy the field names to the clipboard in CSV format. The Logs tab also provides this copy button.
Control Sample Size
To prevent in-memory samples from getting unreasonably large, samples that you input by any means (Import Data, Edge Data, or Capture Data) are constrained by a limit set as follows:
- On a single instance at Settings > General Settings > Limits > Storage > Max sample size.
- On distributed Worker Groups (both Cribl-managed and customer-managed) at Fleet Settings > General Settings > Limits > Storage > Max sample size.
In each location, the default limit is 256 KB. You can adjust this upward (to a maximum of 3 MB) or downward.
Very Large Integer Values
Cribl Edge’s JavaScript implementation can safely represent integers only up to the Number.MAX_SAFE_INTEGER constant of about 9 quadrillion (precisely, {2^53}-1). Data Preview will round down any integer larger than this, and trailing 0’s might indicate such rounding.
Fields
In the Capture Data and Live Data modals, use the Fields sidebar (at left) to streamline how events are displayed. You can toggle among All fields, None (to reset the display), and check boxes that enable/disable individual fields by name.
Field Type Symbols
Within the right Preview pane, each field’s type is indicated by one of these leading symbols:
| Symbol | Meaning |
|---|---|
| α | string |
| # | numeric |
| b | boolean |
| m | metric |
| {} | JSON object |
| [] | array |
On JSON objects and arrays, you’ll also see:
| Symbol | Meaning |
|---|---|
| + | expandable |
| - | collapsible |
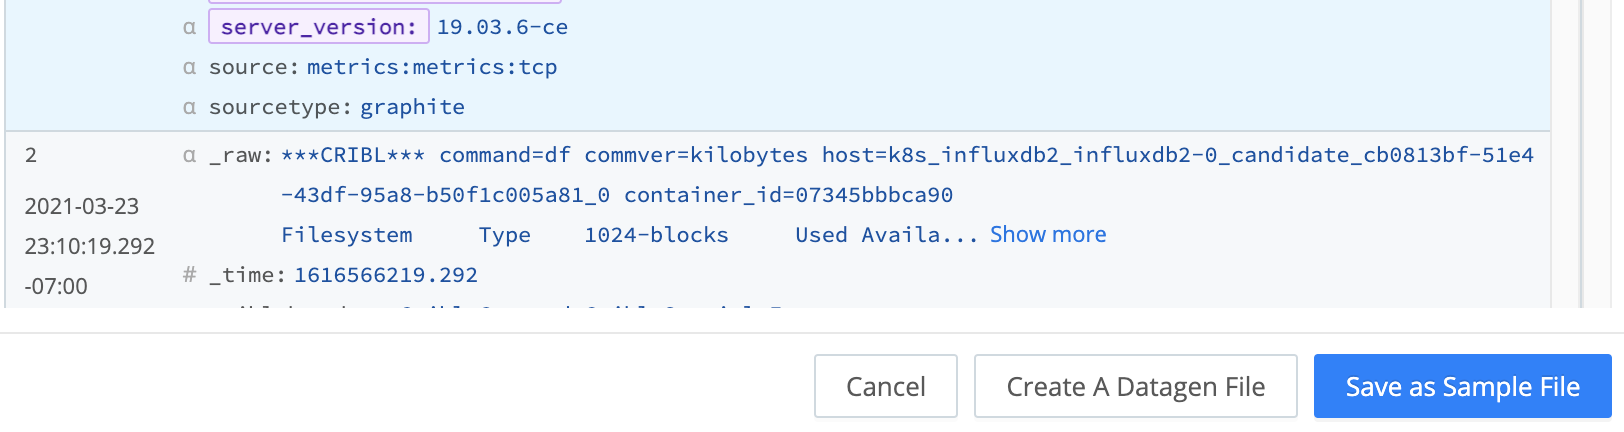
Save Sample Data
The Preview pane’s Import Data or Capture Data modal, once you’ve successfully populated it with data, provides options to save the data as a sample and/or datagen file. Select the appropriate button, accept or modify the default/generated file name and other options, and confirm the save.
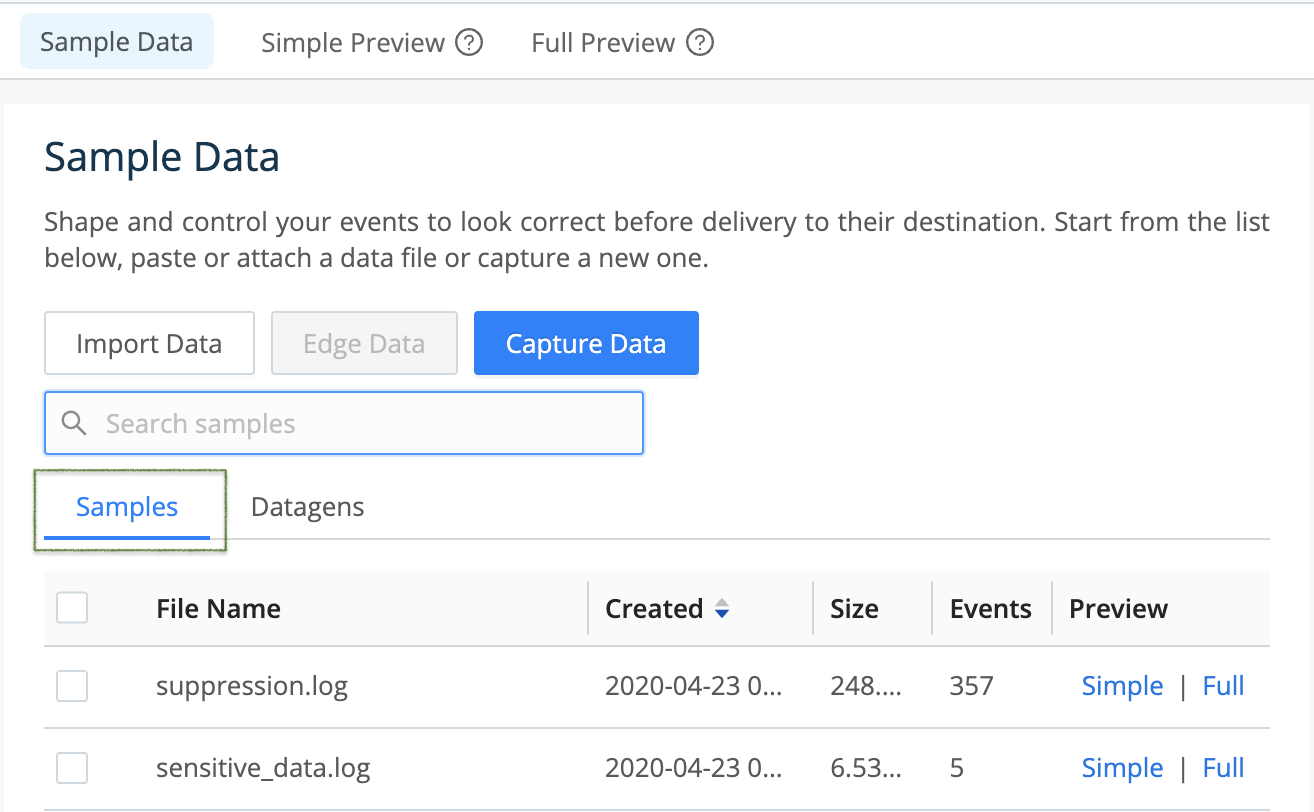
Access and Manage Data Files
As you add more samples to your system, you can easily access them via the Sample data file drop-down. You can also manage and modify sample files via the Samples tab highlighted below.
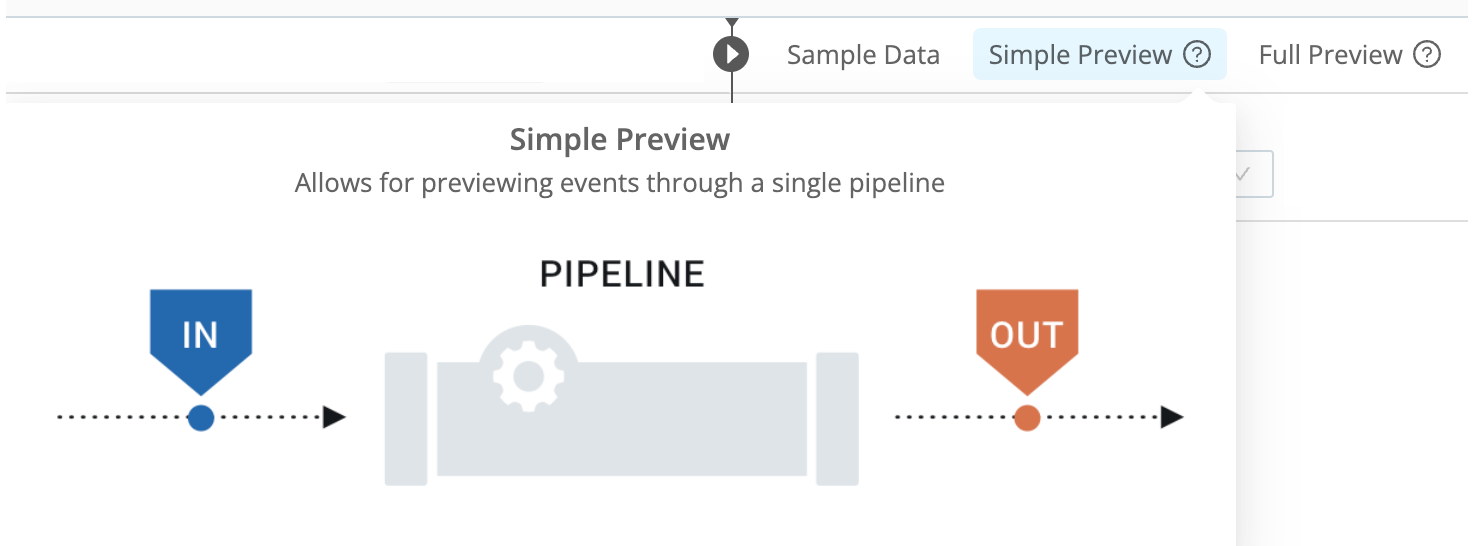
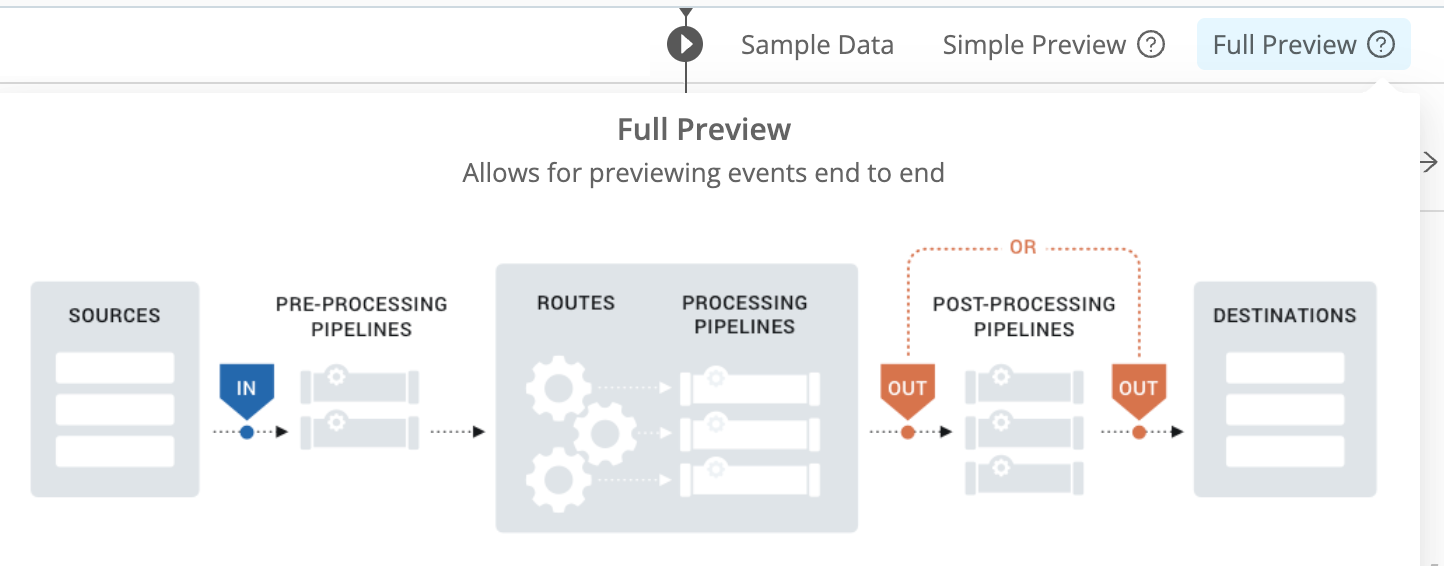
Simple Versus Full Preview
Select Simple or Full beside a file name to display its events in the Preview pane. The Simple Preview option enables you to view events on either the IN or the OUT (processed) side of a single Pipeline.
The Full Preview option gives you a choice of viewing events on the OUT side of either the processing or post-processing Pipeline. Selecting this option expands the Preview pane’s upper controls to include an Exit Point drop-down, where you make this choice.
Modify Sample Files
- In the right Preview pane, select the Samples tab.
- Hover over the file name you want to modify. This displays an edit (pencil) button to its left.
- Select that button to open the modal shown below. It provides options to edit, clone, or delete the sample, save it as a datagen Source, or modify its metadata (File name, Description, Expiration time, and Tags).

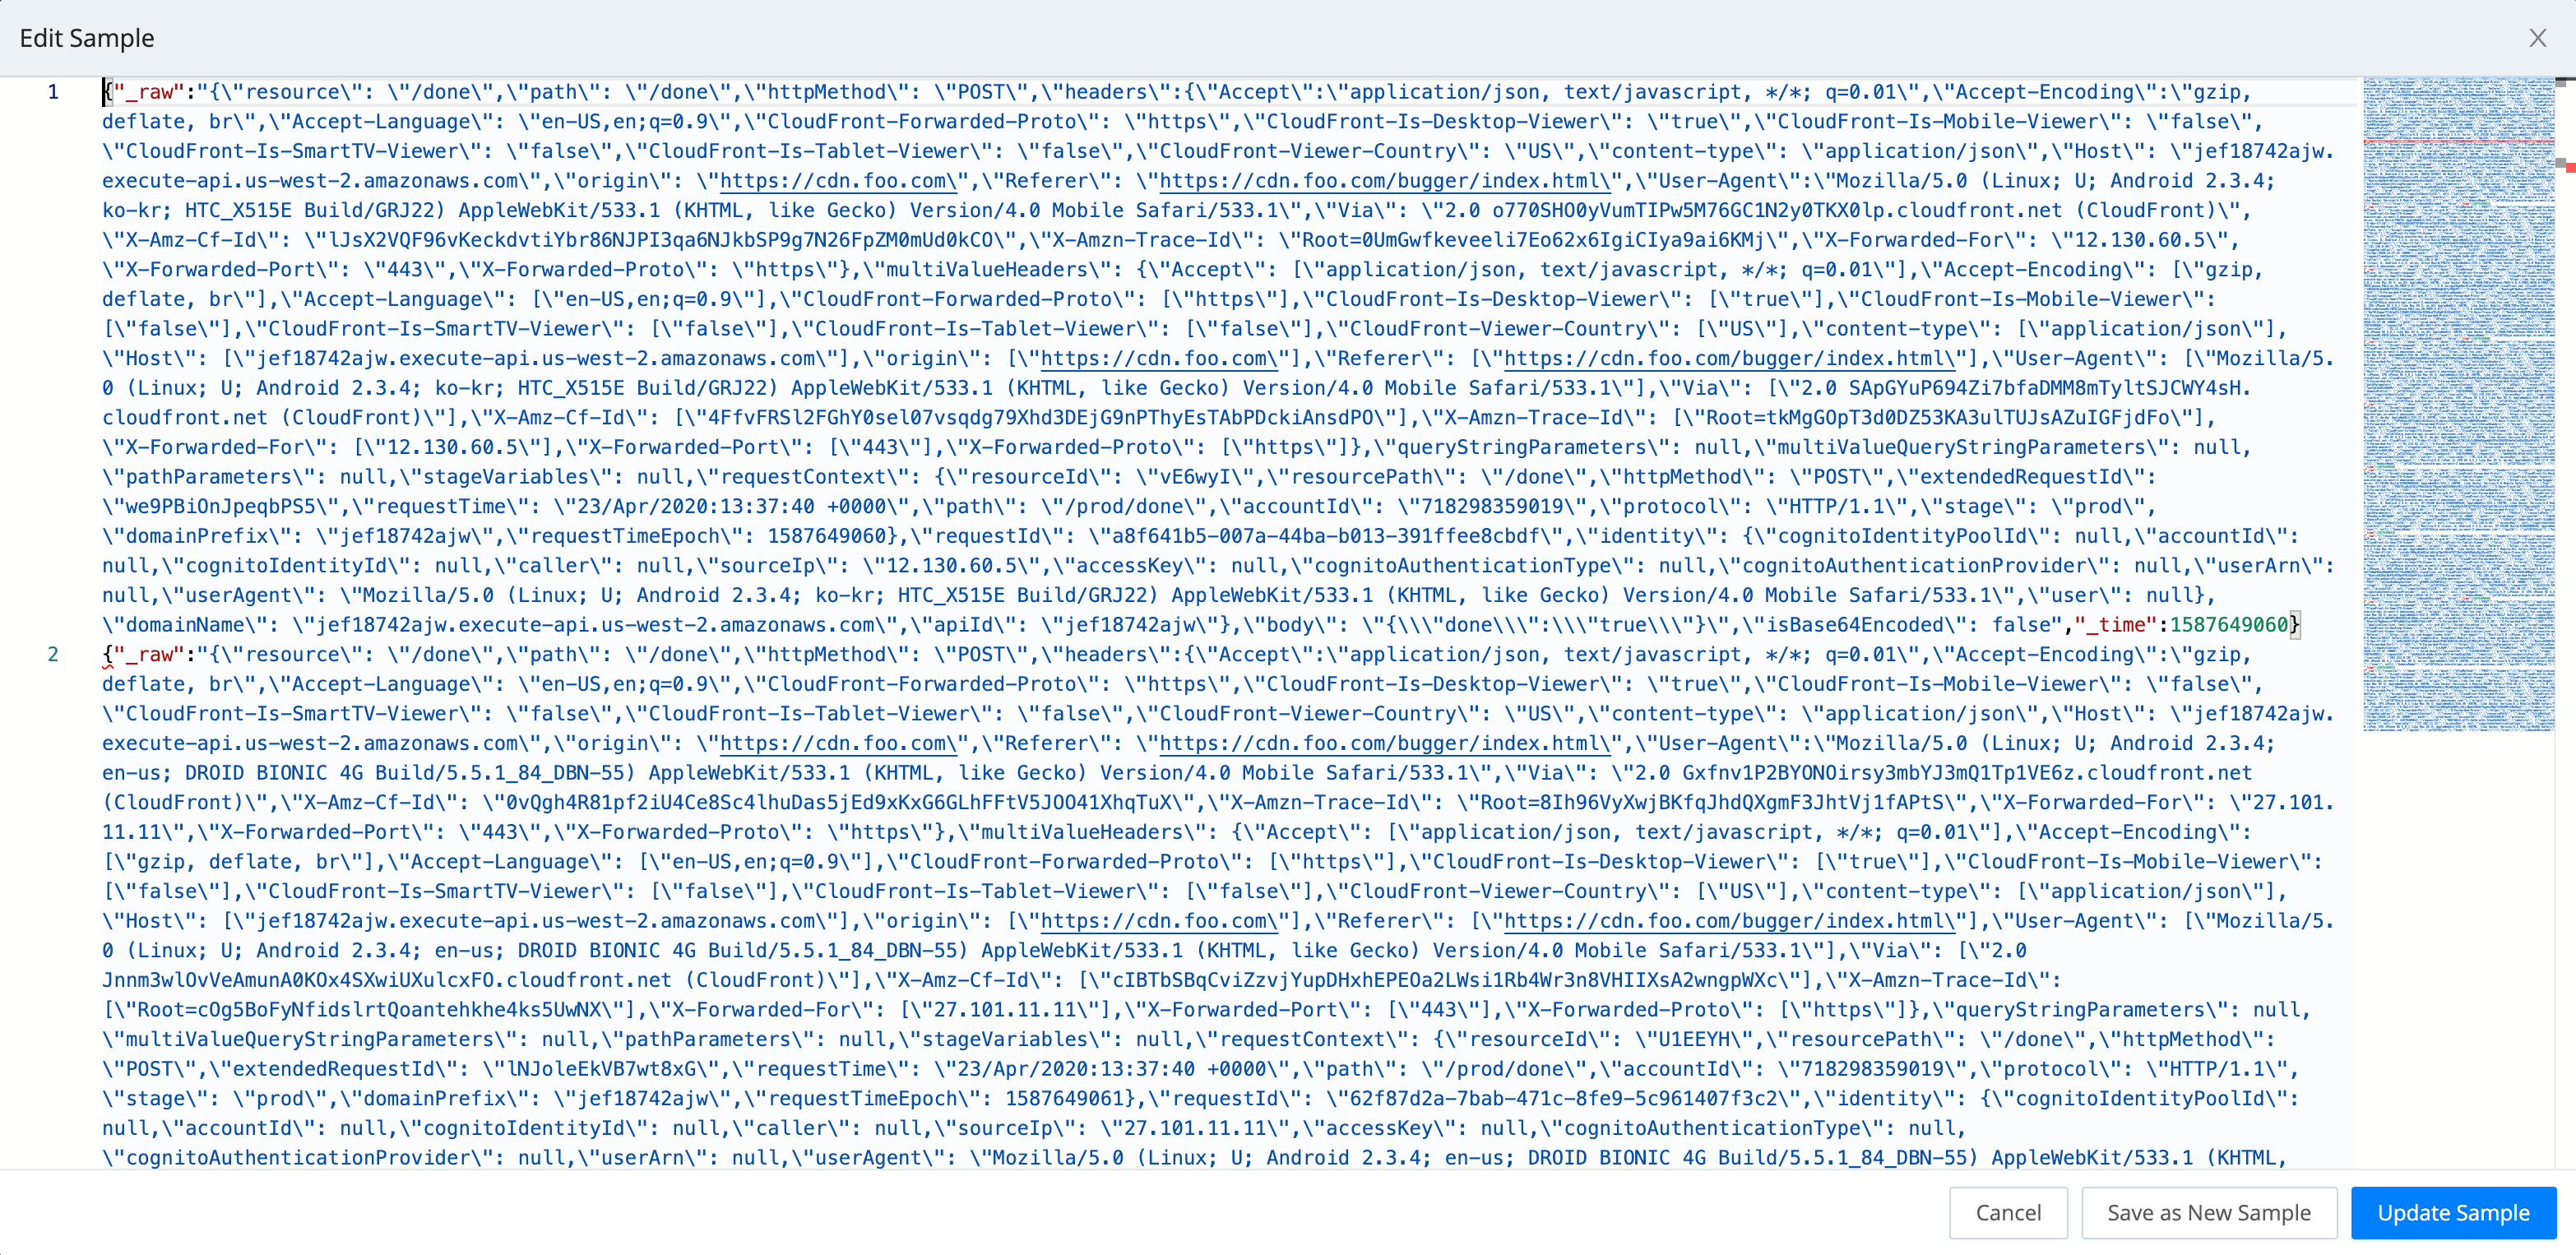
- To make changes to the sample, select the modal’s Edit Sample button. This opens the Edit Sample modal shown below, exposing the sample’s raw data.
- Edit the raw data as desired.
- Select Update Sample to resave the modified sample, or select Save as New Sample to give the modified version a new name.
IN Tab: Display Samples on the Way IN to the Pipeline
The Preview pane offers two display options for events: Event and Table. Each format can be useful, depending on the type of data you are previewing. This screenshot shows Event view:

In the Advanced Settings menu
 at the upper right, the first few toggles are self-explanatory, and are used primarily to filter the OUT tab’s display of processed data. The following subsections cover the less-obvious controls at the menu’s bottom.
Render Whitespace
This toggles between displaying carriage returns, newlines, tabs, and spaces as white space, versus as(respectively) the symbols ␍, ↵, →, and ·.
Timeout (Sec)
If large sample files time out before they fully load, increase this field’s default value of 10 seconds. A blank field is interpreted as the minimum allowed timeout value of 1 second.
Pipeline Profiling
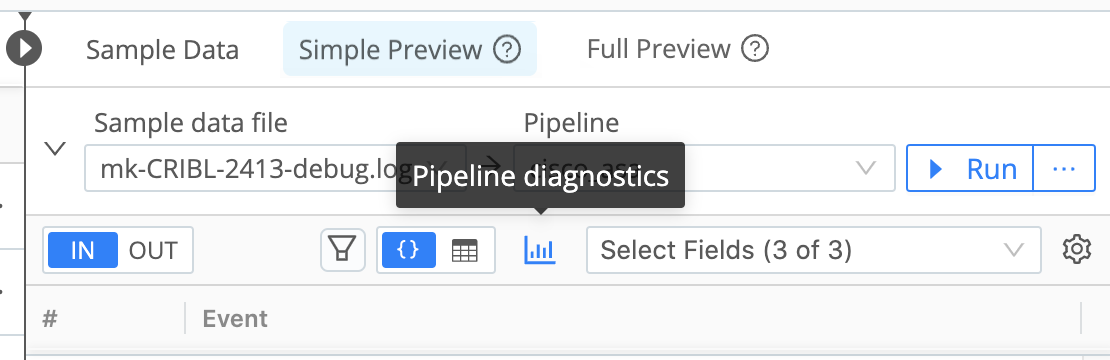
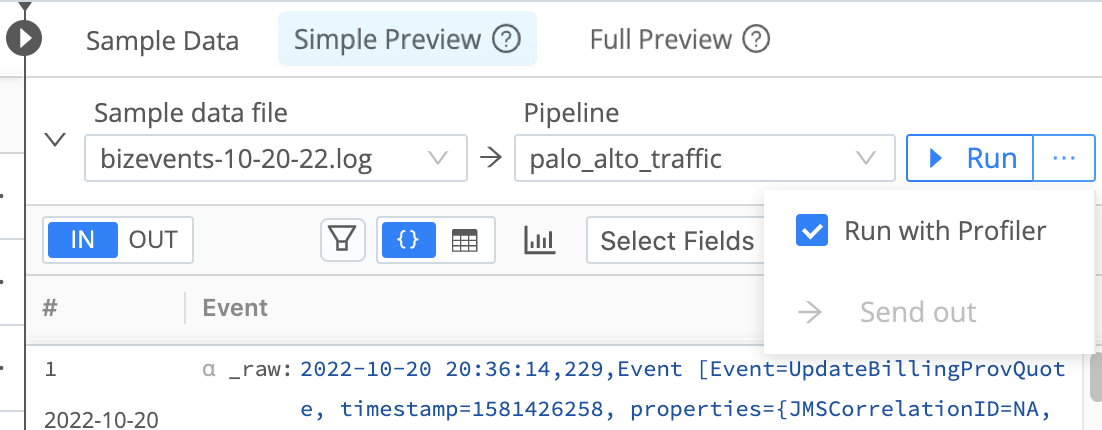
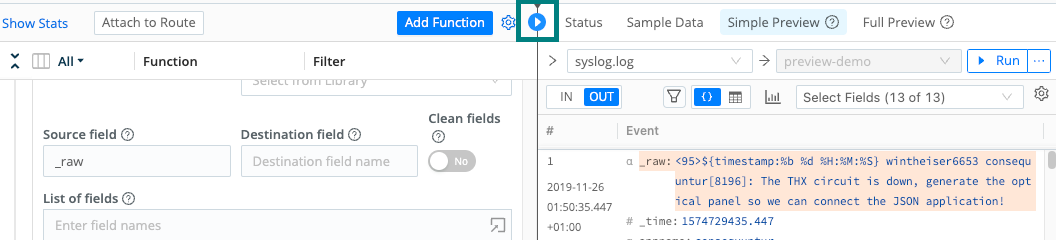
At the Preview pane’s top, you can select a sample data file and Pipeline, then select the Pipeline diagnostics (bar-graph) button to access statistics on the selected Pipeline’s performance. (The same button is available on Pipelines within a Pack.)
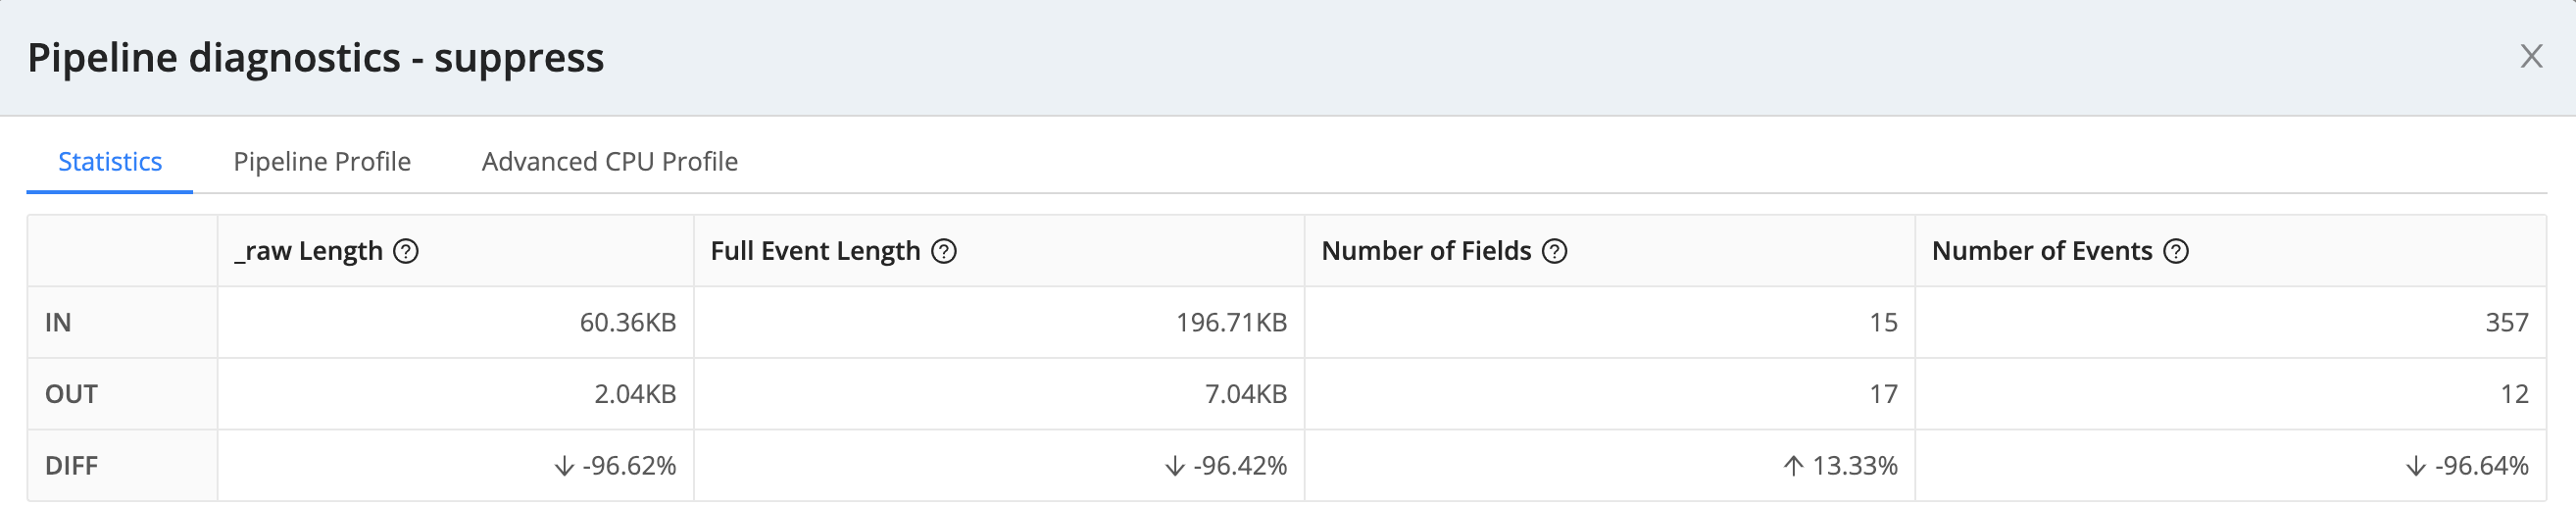
The resulting modal’s Statistics tab displays basic stats about the Pipeline’s processing impact on field and event length and counts.
The Pipeline Profile tab, available from the Simple Preview tab, helps you debug your Pipeline by showing individual Functions’ contributions to data volume, events count, and the Pipeline’s processing time. Every Function has a minimum processing time, including Functions that make no changes to event data, such as the Comment Function.
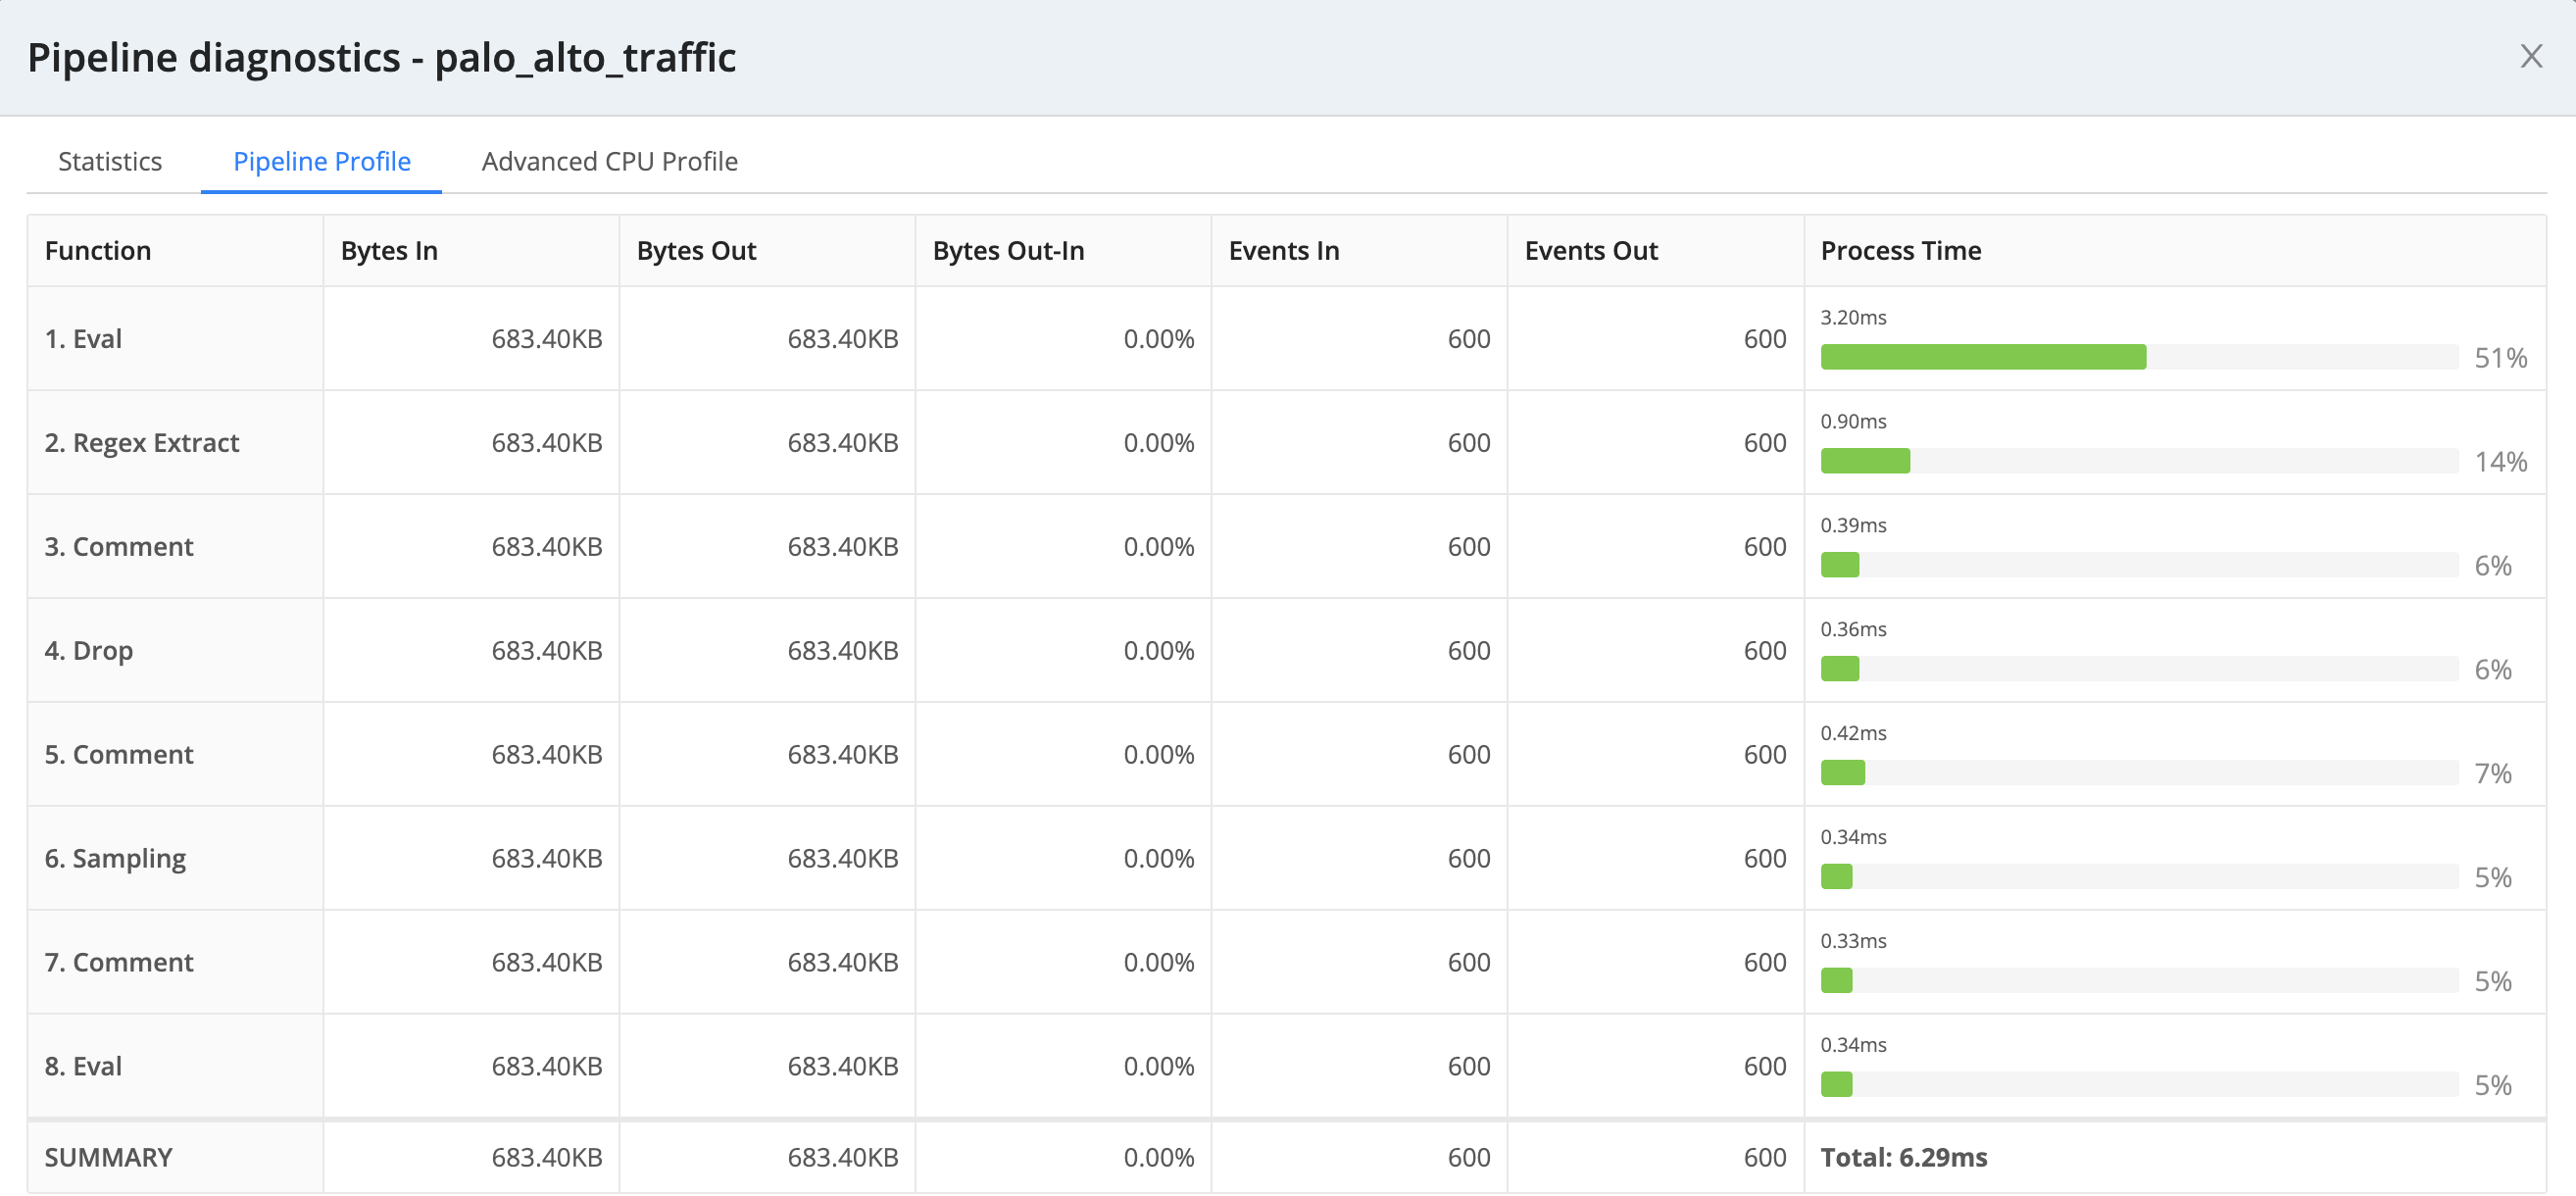
When you profile a Chain Function, this tab condenses all of the chained Pipeline’s processing into a single Chain row. To see individual statistics on the aggregated Functions, profile the chained Pipeline separately.
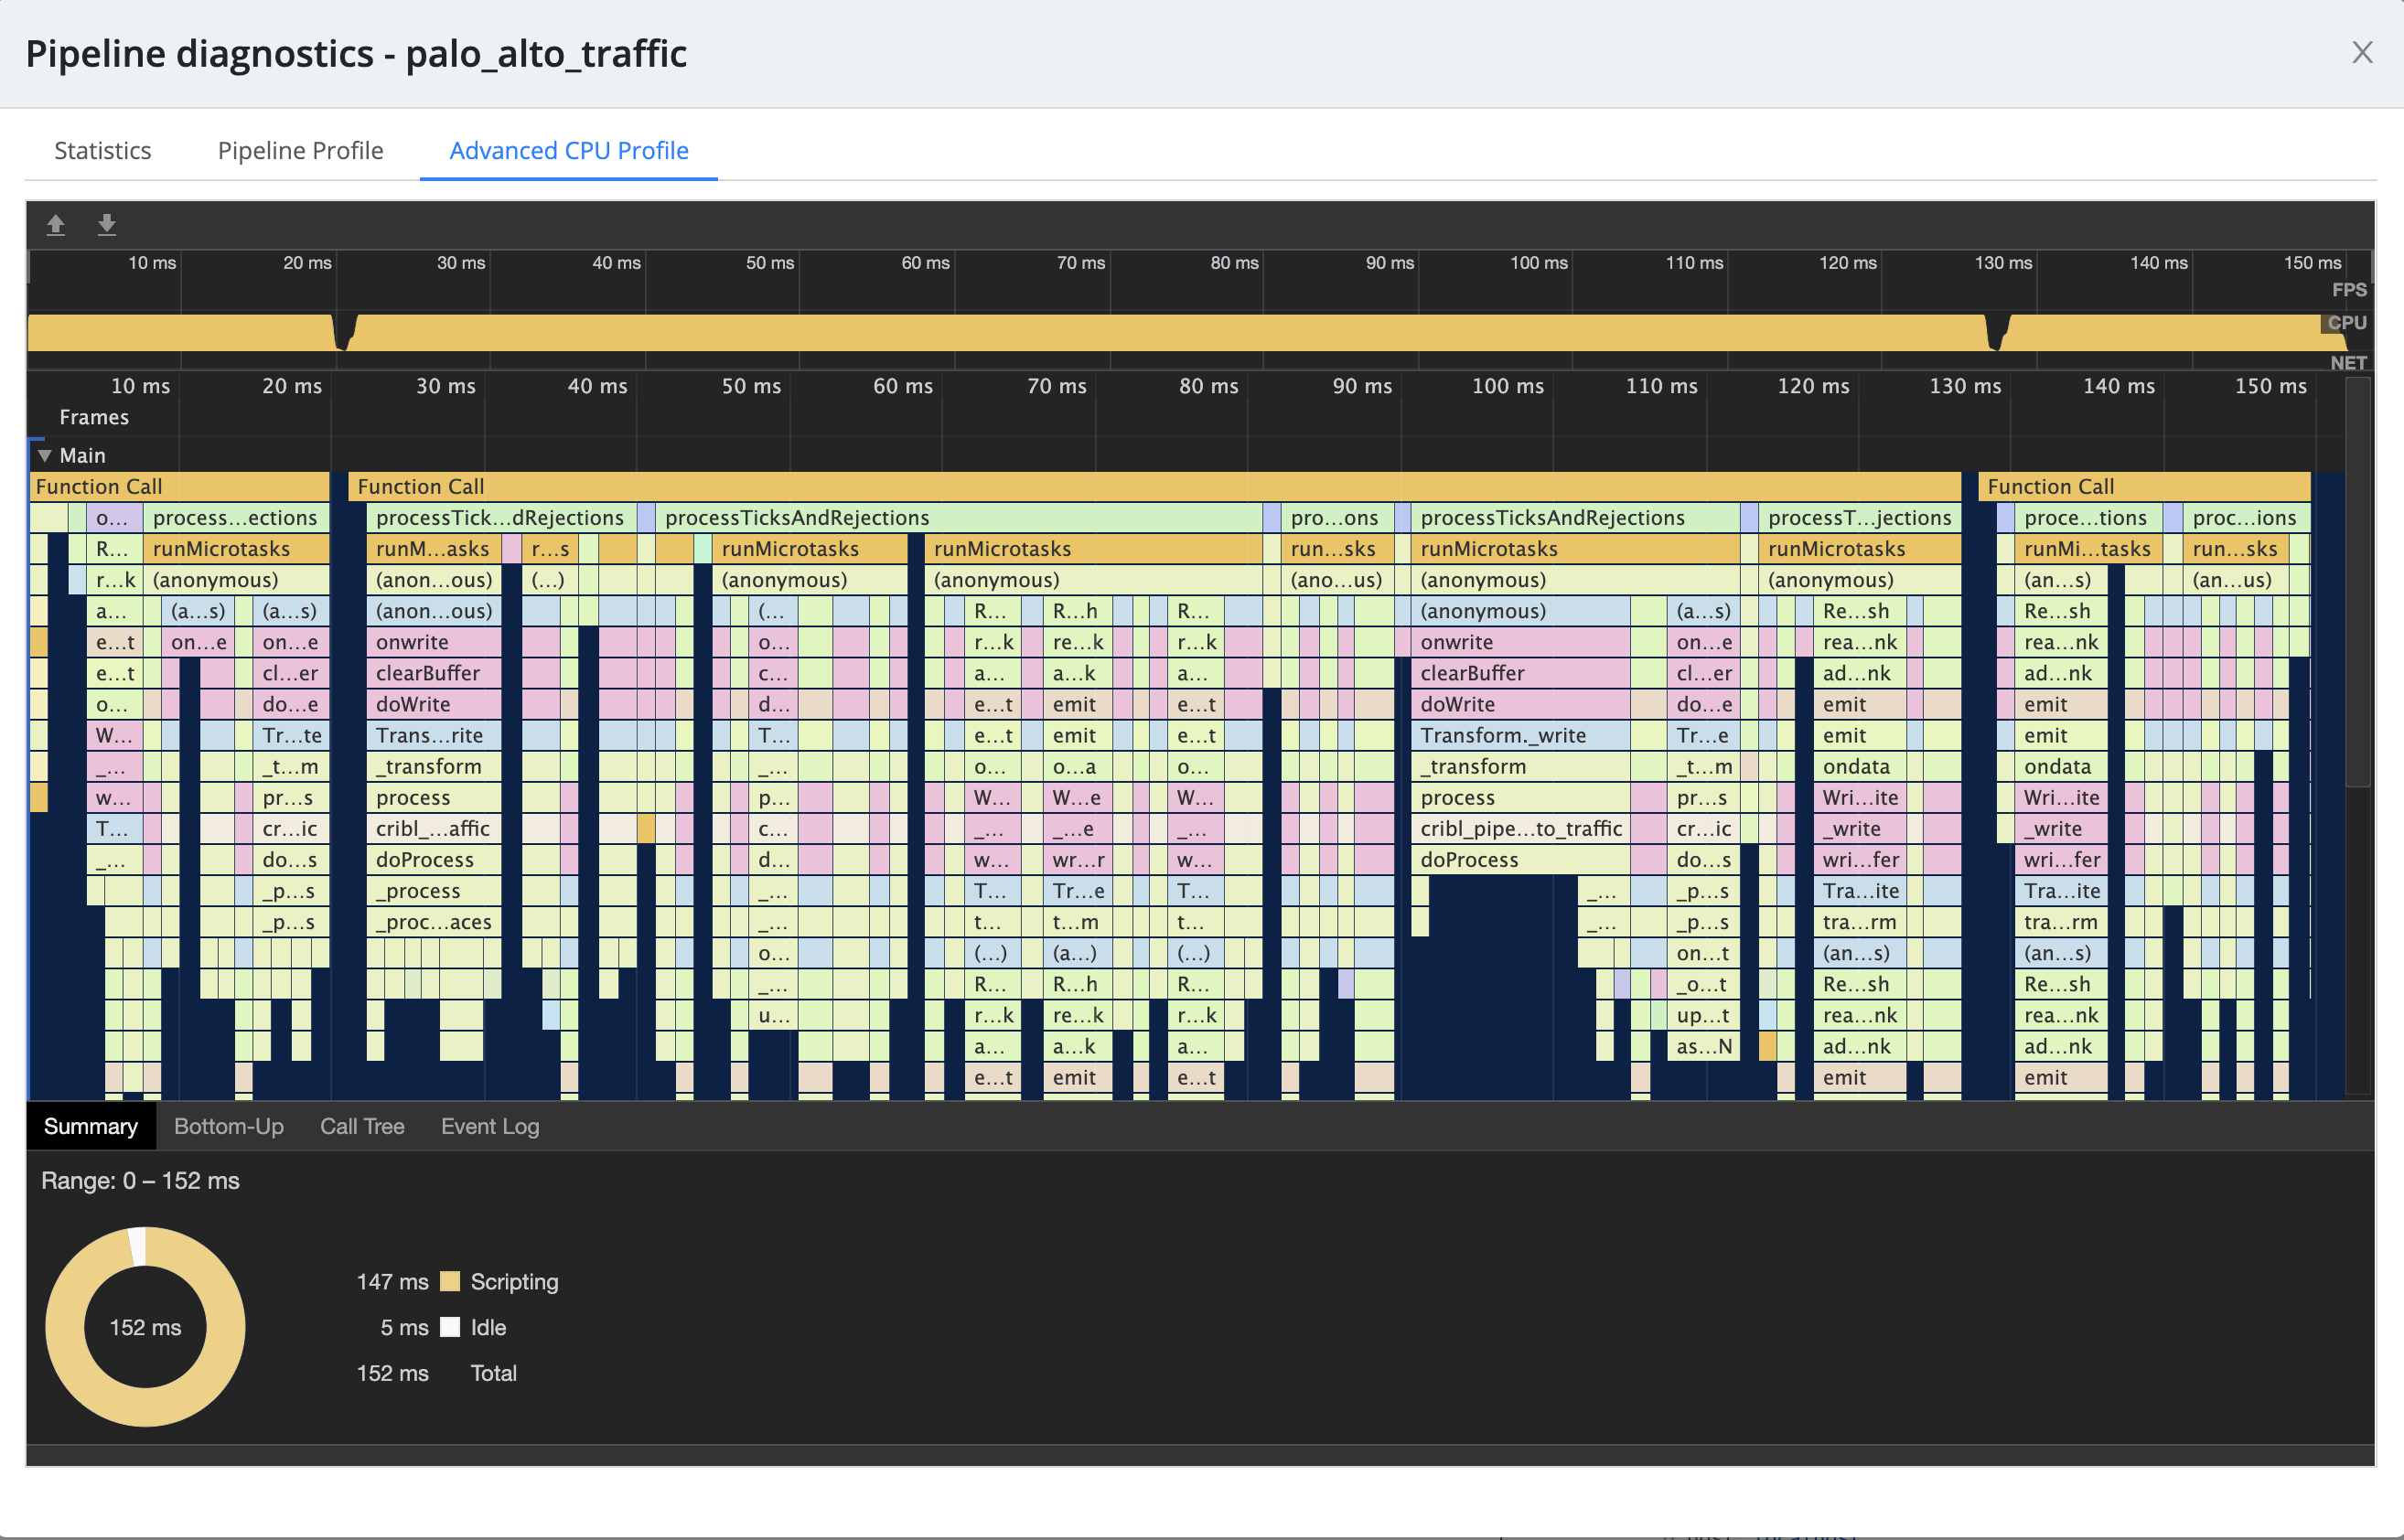
The Advanced CPU Profile tab, available from the Simple Preview tab, displays richer details on individual Function stacks.
You can disable the profiling features - and regain their own (minimal) resources - by selecting the drop-down list beside the Run button and clearing the Run with Profiler check box.
Save
The Save submenu enables you to save your captured data to a file, using either the Download as JSON or the Download as NDJSON (Newline-Delimited JSON) option.
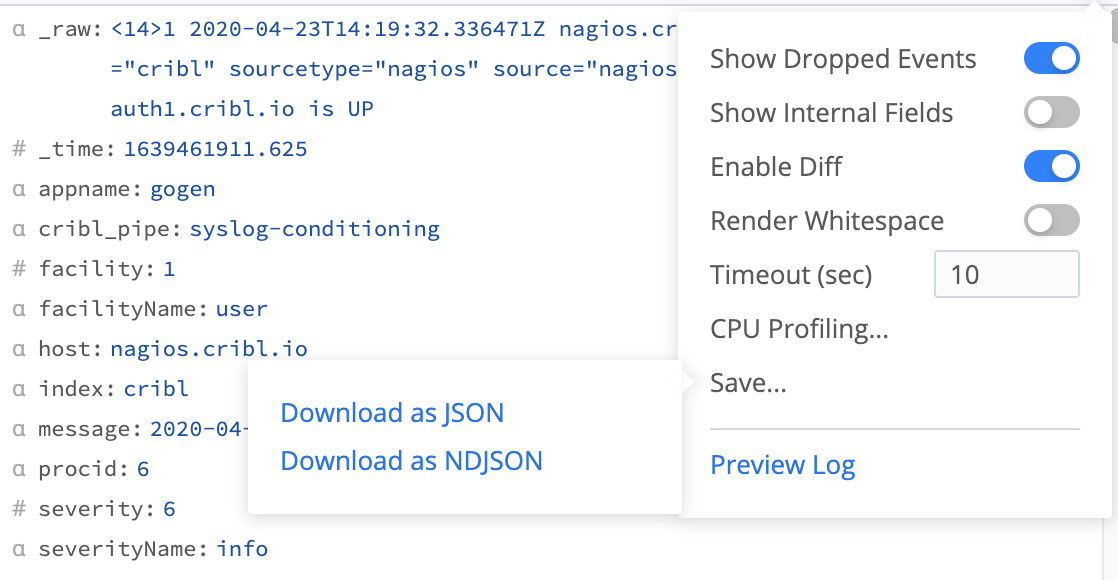
Preview Log
The final option on the Advanced Settings menu
opens a modal where you can preview Cribl Edge’s internal logs summarizing how this data sample was processed and captured.
OUT Tab: Display Samples on the Way OUT of the Pipeline
As data traverses through a Pipeline’s Functions, events can be modified or even dropped altogether. The OUT tab displays the same Event and Table buttons as the IN tab. Use the Select Fields drop-down menu to control which fields the OUT tab displays.
The Advanced Settings menu
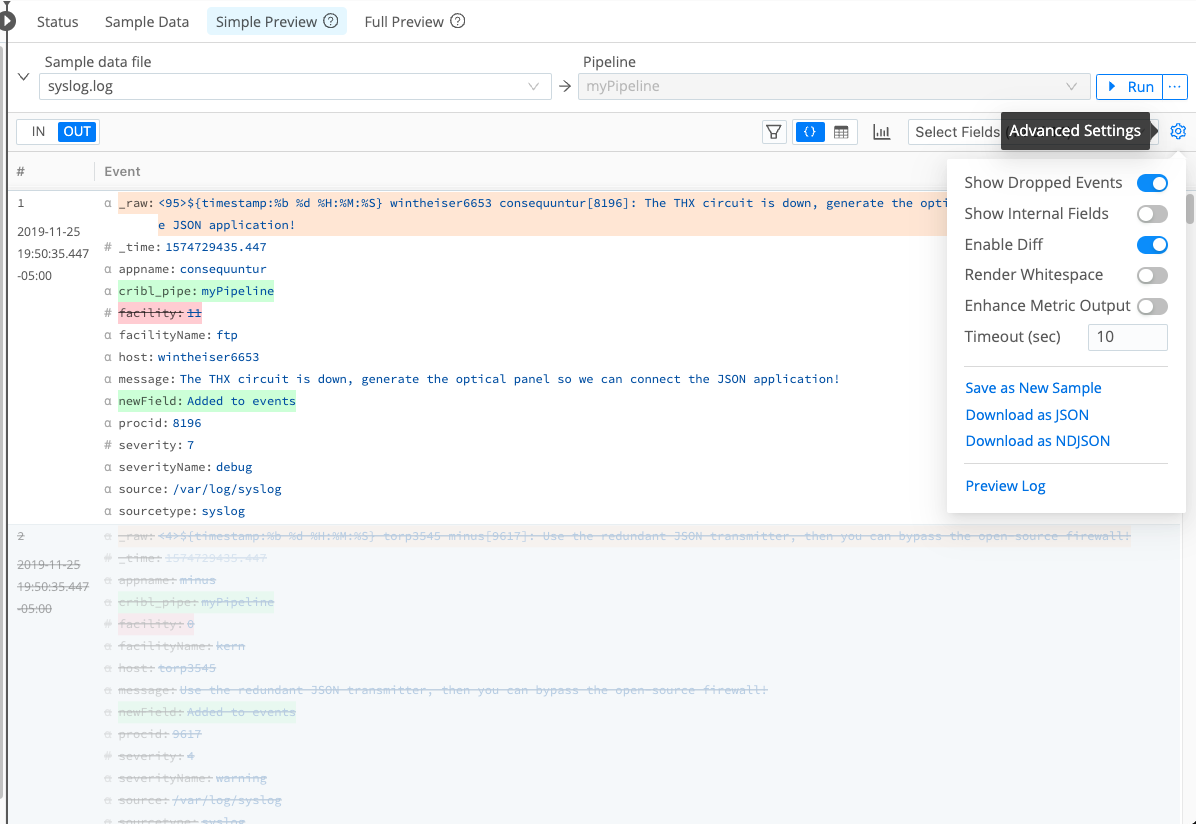
includes Show Dropped Events, Show Internal Fields, and Enable Diff toggles, which control how the OUT tab displays changes to event data.
If you enable the Show Dropped Events and Enable Diff toggles, the OUT tab displays event data as follows:
- Modified fields are highlighted in amber.
- Added fields are highlighted in green.
- Deleted fields are highlighted in red and displayed in strikethrough text.
- Dropped events are displayed in strikethrough text.
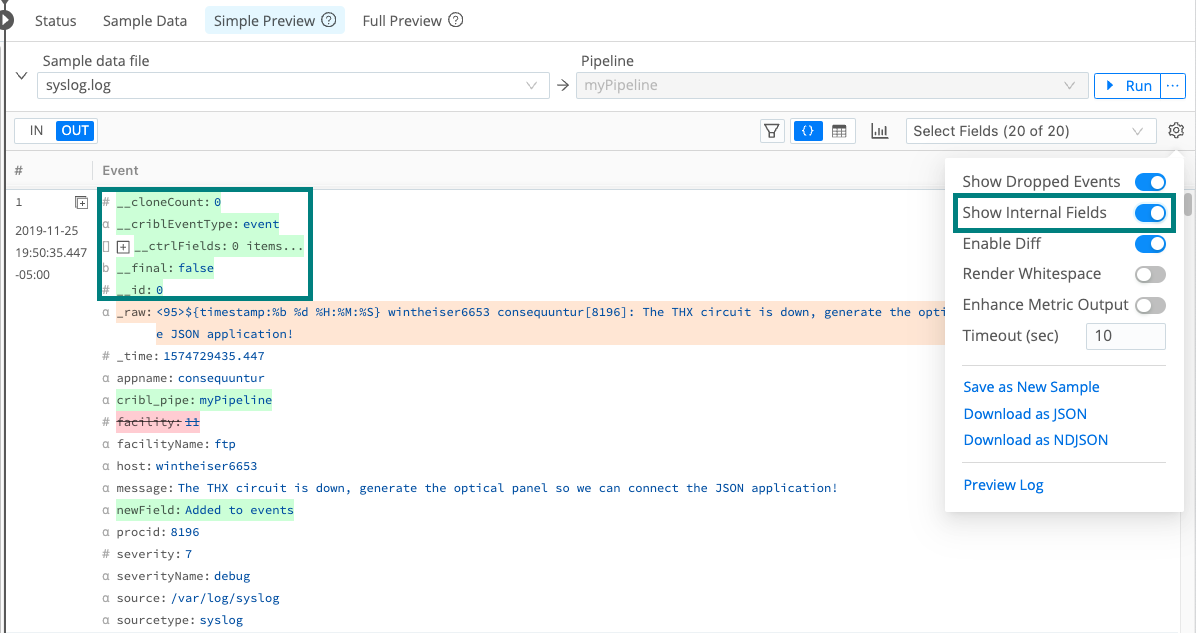
Enable Show Internal Fields in the Advanced Settings menu
to display fields that Cribl Edge adds to events, as well as Source-specific fields that Cribl Edge forwards from upstream senders.
Use Enhance Metric Output in the Advanced Settings menu
to control how the OUT tab presents the Metric name expression resulting from the Publish Metrics Function. When the setting is disabled (default), the Metric name expression is represented as literal expression string. Enable the setting to see the expression evaluated in the OUT tab.
Manage the Preview Pane
On the pane divider between Route or Pipeline and the preview, select Collapse to hide the Preview pane. This allows the Route or Pipeline configuration to expand to your browser’s full width. (The Preview pane collapses automatically on narrow viewports.)
Select Expand at your browser’s right edge to restore the split view. The pane divider will snap back to wherever you last dragged it.