


These docs are for Cribl Edge 4.9 and are no longer actively maintained.
See the latest version (4.17).
Monitoring Health and Metrics
Cribl Edge offers you multiple ways to monitor your deployments in order to get an operational view of the health of your Fleets, Edge Nodes, Sources and Destinations, and more.
Within your Cribl Edge deployment, you can individually monitor the data throughput of different components:
- Sources: Data sources that Cribl Edge is receiving data from.
- Destinations: The locations Cribl Edge will send processed data.
- Routes: The paths that data takes through Cribl Edge.
- Pipelines: The collections of Routes that Edge uses to process data.
- Packs: Prebuilt Pipelines and configurations you can use to accelerate deployment.
- Data Fields (Edge Nodes only): The specific fields within your data that you can monitor.
Cribl Edge Monitoring Overview
When you first log into Cribl, you’ll see the Cribl Edge tile on the Cribl Home page. This tile displays basic Edge configuration details, including number of Fleets, Subfleets, Edge Nodes, and events and bytes over time.
To monitor health and metrics of your Cribl Edge deployment, select Manage.
Monitor Health on the Edge Home Page
Once you select Manage, you’ll be on the Edge Home page. This page shows aggregate data for all Fleets, Subfleets and Edge Nodes. The charts display information about traffic in and out of the system.
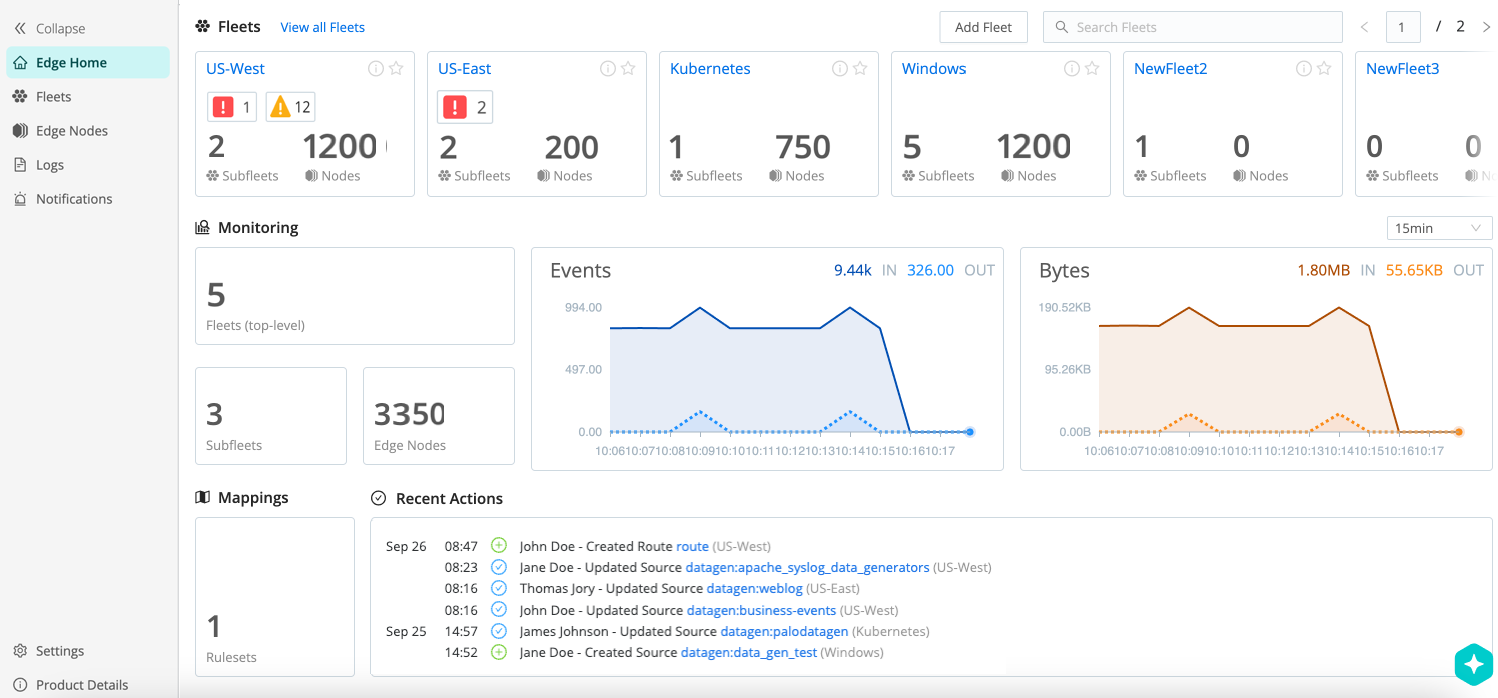
You can change the time granularity for the Bytes chart from the
default 15 min. Select a variety of time ranges from 1 min up to
1 day (covering the preceding 24 hours).
Understand the Health Status Icons
You’ll see icons next to Sources and Destinations which indicate the health of the resource. Here’s what each icon means:
 Green checkmark: Everything is good! All Sources and
Destinations are healthy.
Green checkmark: Everything is good! All Sources and
Destinations are healthy. Yellow warning icon: Attention needed. One or more Sources or
Destinations are in a warning state.
Yellow warning icon: Attention needed. One or more Sources or
Destinations are in a warning state. Red exclamation point: Critical issue! One or more Sources or
Destinations have encountered an error.
Red exclamation point: Critical issue! One or more Sources or
Destinations have encountered an error. Indeterminate: No data available yet for Sources or
Destinations. This usually means you need to enable Basic metrics. See Enable Health Status
for instructions.
Indeterminate: No data available yet for Sources or
Destinations. This usually means you need to enable Basic metrics. See Enable Health Status
for instructions.
Overall Source and Destination Health
When you add or manage configured Sources and Destinations, you’ll see a colored health status (if enabled).
To access the list of configured Sources and Destinations:
- Select a Fleet.
- Select More, then Sources or Destinations.
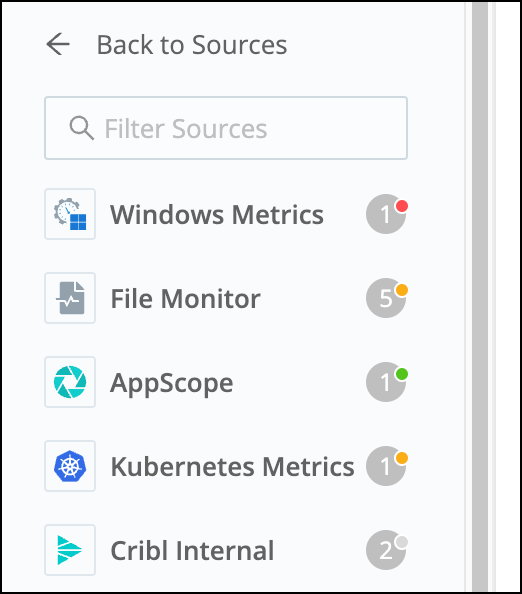
In the list view, the health status is a green, orange, red, or gray dot next to the name, along with a gray circle indicating the number of instances you have configured.
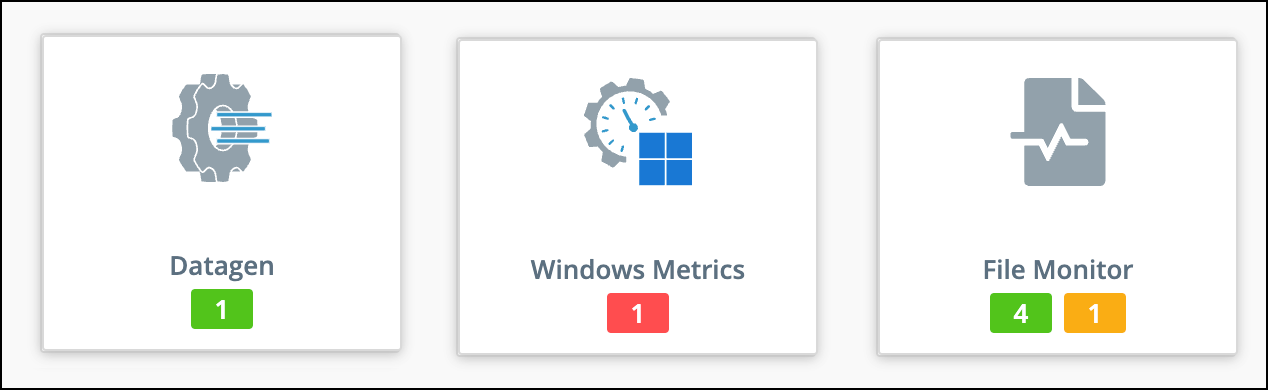
In the tile view, colors are applied to the squares that indicate the number of instances you have configured.
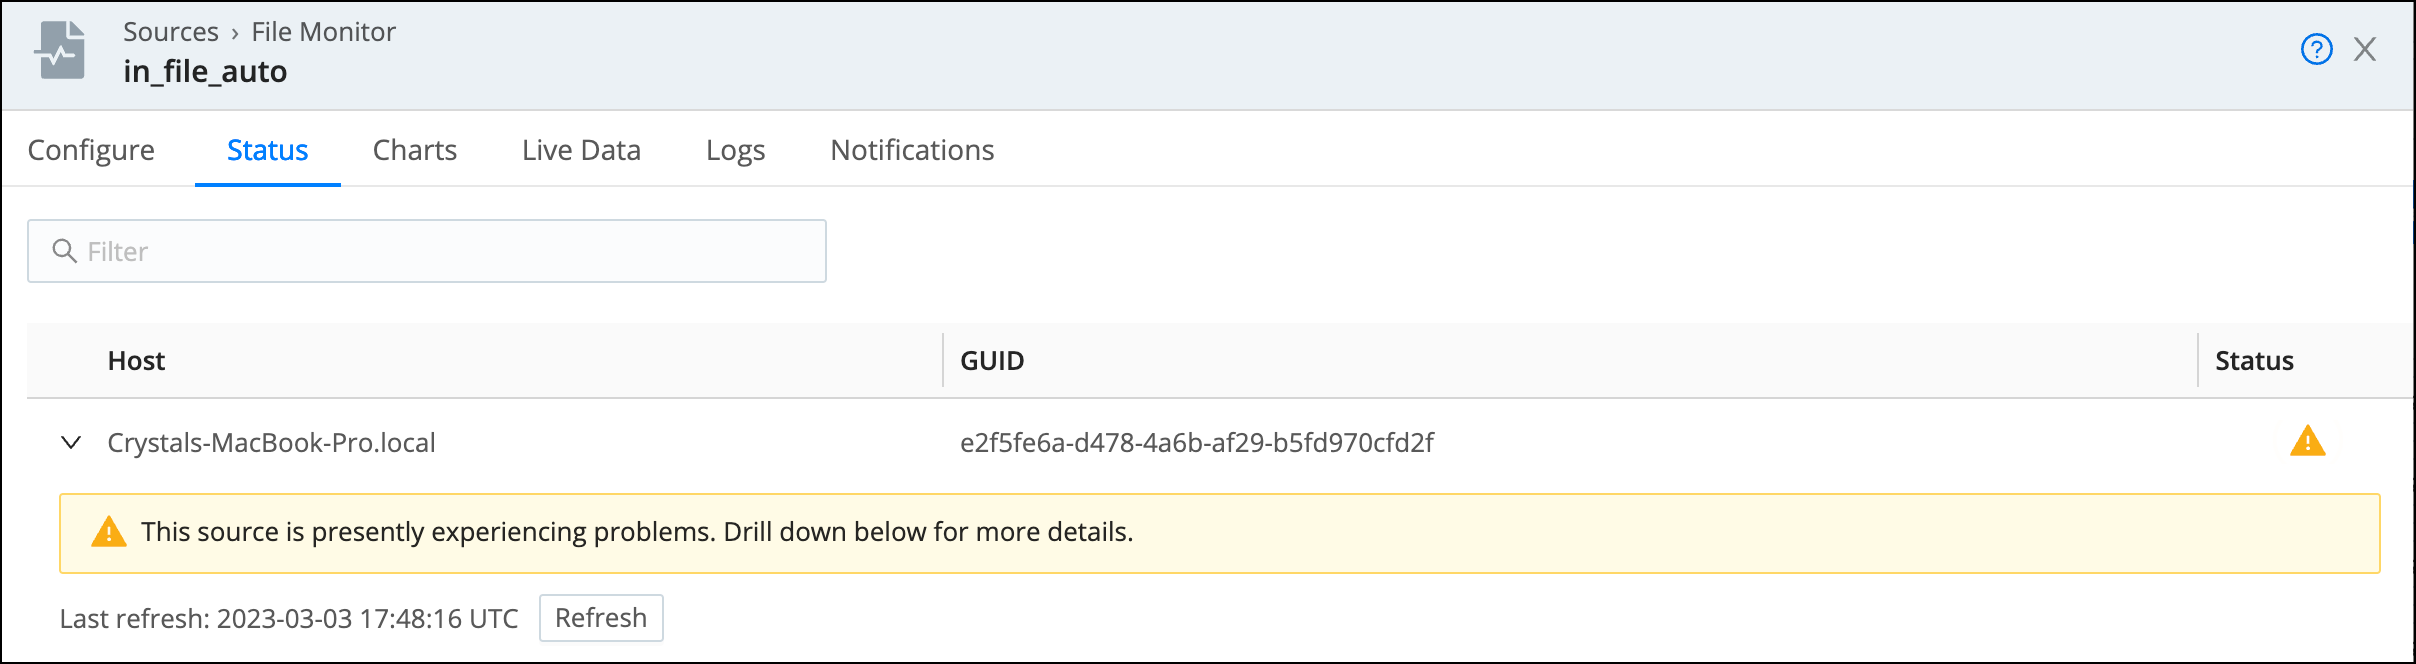
To learn more about the health status of any Source or Destination, select its name to open the list of existing Sources or Destinations, and then select the Status icon for the one you want to examine.
Enable Health Status Metrics
Edge Nodes report the health status of Sources and Destinations to the Leader. To view Source and Destination health status from the More drop-down, you must enable health status independently for each Fleet.
You don’t have to enable health status to view health icons in the Source and Destination columns (on a Node or Fleet).
To enable health status for a Fleet:
- Select a Fleet to open it.
- Select the Fleet Settings tab.
- Navigate to General Settings > Limits > Metrics.
- Under Metrics to send from Edge Nodes, use the buttons to select or create a set of metrics. You must select at least Basic metrics.
- If you select Minimal, Edge Nodes won’t report health status for the Fleet. Health icons will appear white for all Sources and Destinations.
To learn more about these metrics options, see Controlling Metrics.
In the modal that opens, select the Status icon again to see more details.
When there are more than 100 Nodes in the Fleet, the Status column will not be visible in the list of Nodes. To view the status for an individual Node, expand it in the list. You can only expand one Node at a time. Refresh the list of Nodes and their status with the Refresh button.
Monitor Fleet Information
To view monitoring information for your Fleets, select Fleets from the sidebar.
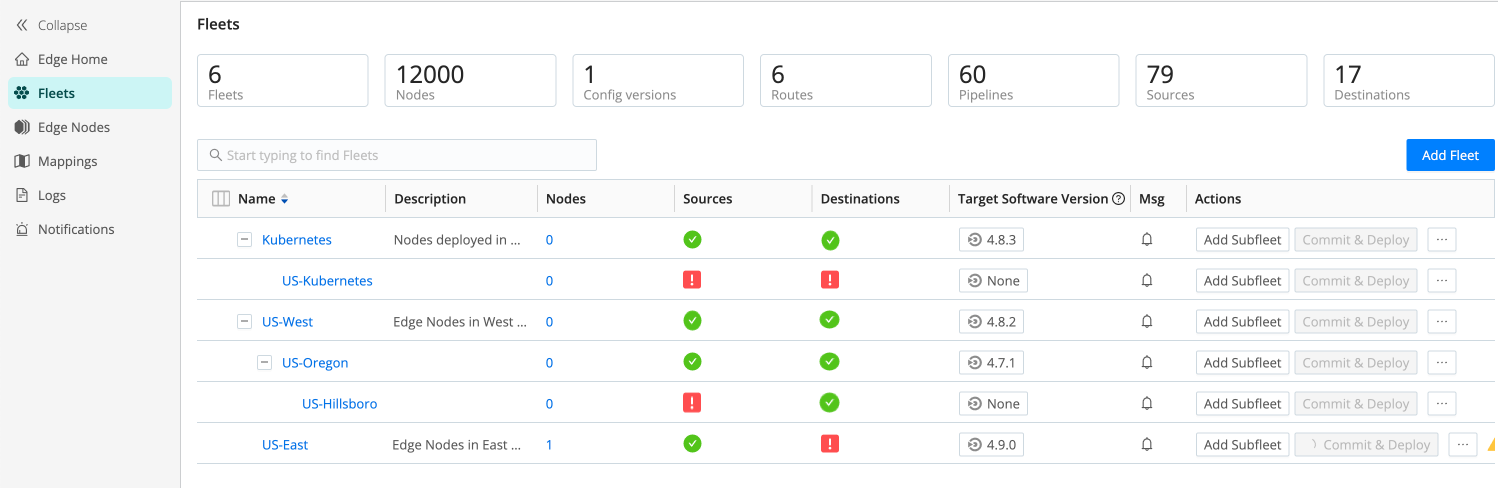
The Fleets page gives you access to more information about each of your Fleets and the health of Sources and Destinations associated with the Fleets.
You can open an individual Fleet using its link, or use the Search field.
View Health Statuses for Resources in a Fleet
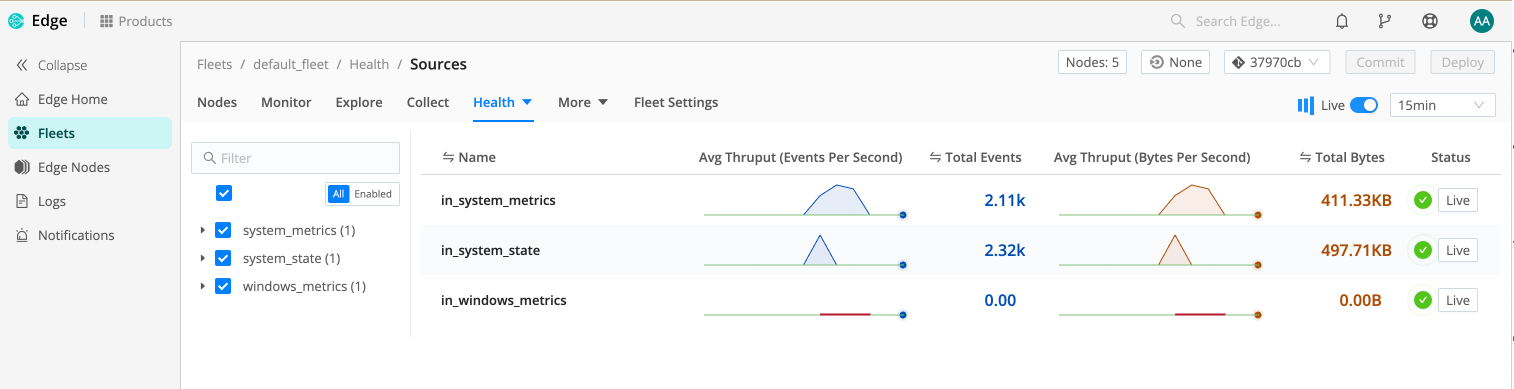
Within any individual Fleet, you can use the Health drop-down to view health data for Sources, Destinations, Data Routes, Pipelines, and Packs.
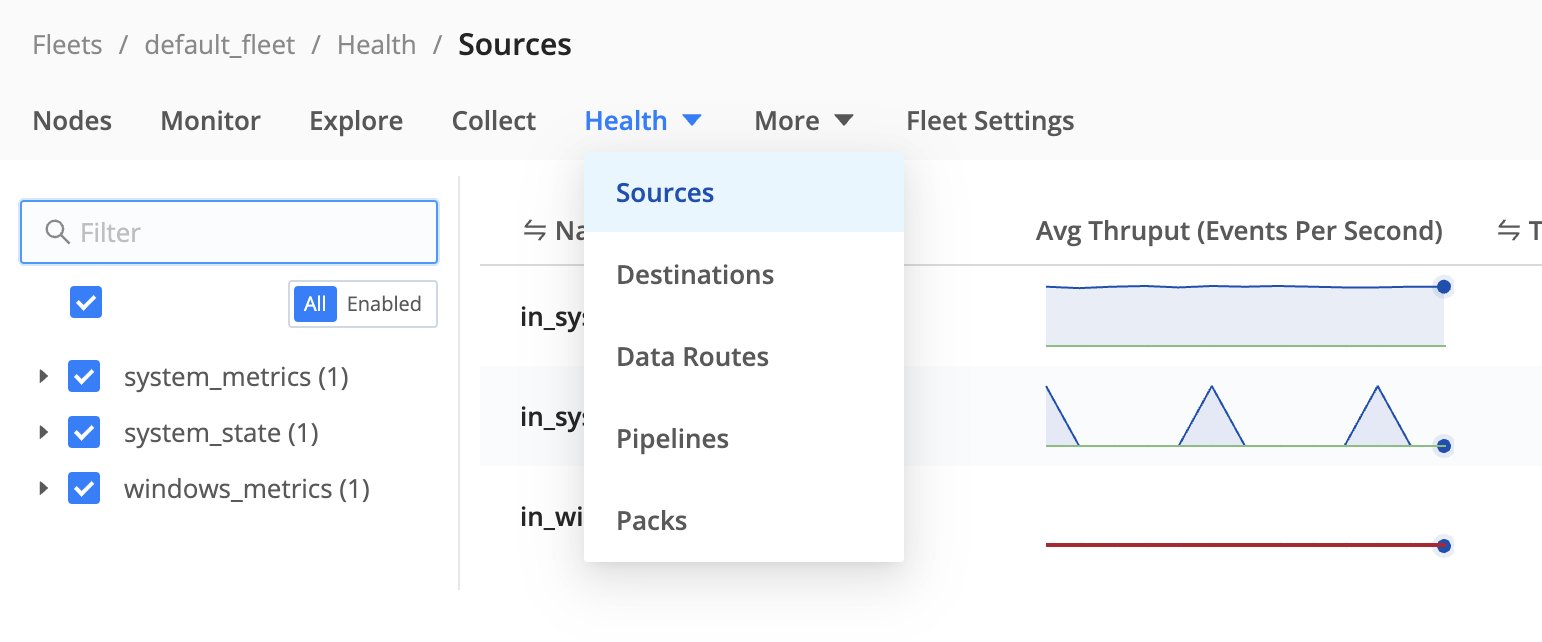
In this view, Cribl Edge condenses busy displays to sparklines for legibility.
The Status column displays the health of each resource with a colored icon. Select the icon to see more details. If a Fleet’s Health tab is empty, health status might not be enabled because only minimal metrics are being sent. See Enable Health Status for remediation instructions.
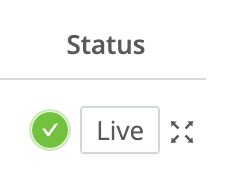
To maximize a graph to its detailed version, hover over the right edge to display and select the Maximize icon.
Once you expand a graph, you can hover over it to display further details.
Fleet-level Source and Destination Health Status
To help you identify Fleets that are experiencing issues with Sources or Destinations, Cribl Edge surfaces Fleet-level Source and Destination health status in several places:
- On the Edge Home page, on each Fleet tile.
- On the Fleets page, in the list of Fleets.
- In each Fleet, in the Monitor tab.
To view high-level Source and Destination health status for Fleets:
- Select Edge Home from the sidebar.
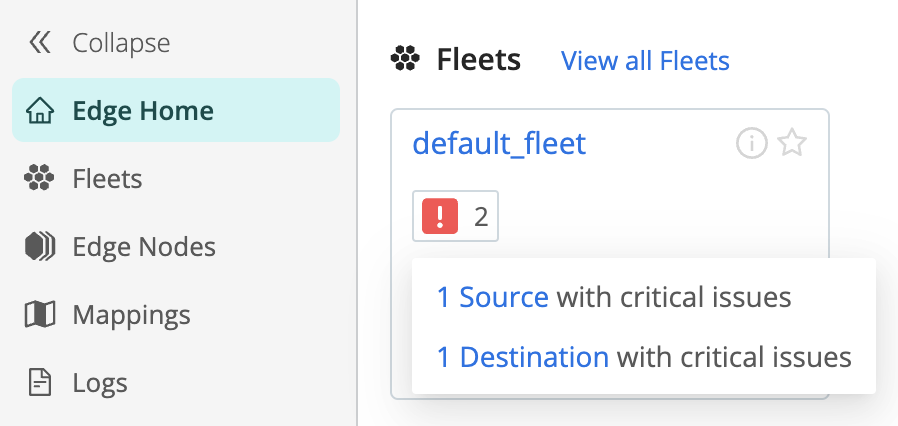
- Select an icon to open the Source or Destination page. The warning and error
icons you see here depend on the Metrics setting for the Fleet:
- Basic metrics: The Fleet tile will display the number of Sources or Destinations that are experiencing issues. Hover over the icons for a detailed view, and select the Source or Destination.
- Minimal metrics: The Fleet tile will display an icon if there is at least one Source or Destination in a warning state. Selecting an icon will open the Source or Destination page, but you won’t see which Sources or Destinations are in a warning or error state.
To view Source and Destination health status on the Monitoring page:
- Select a Fleet, then select Monitor.
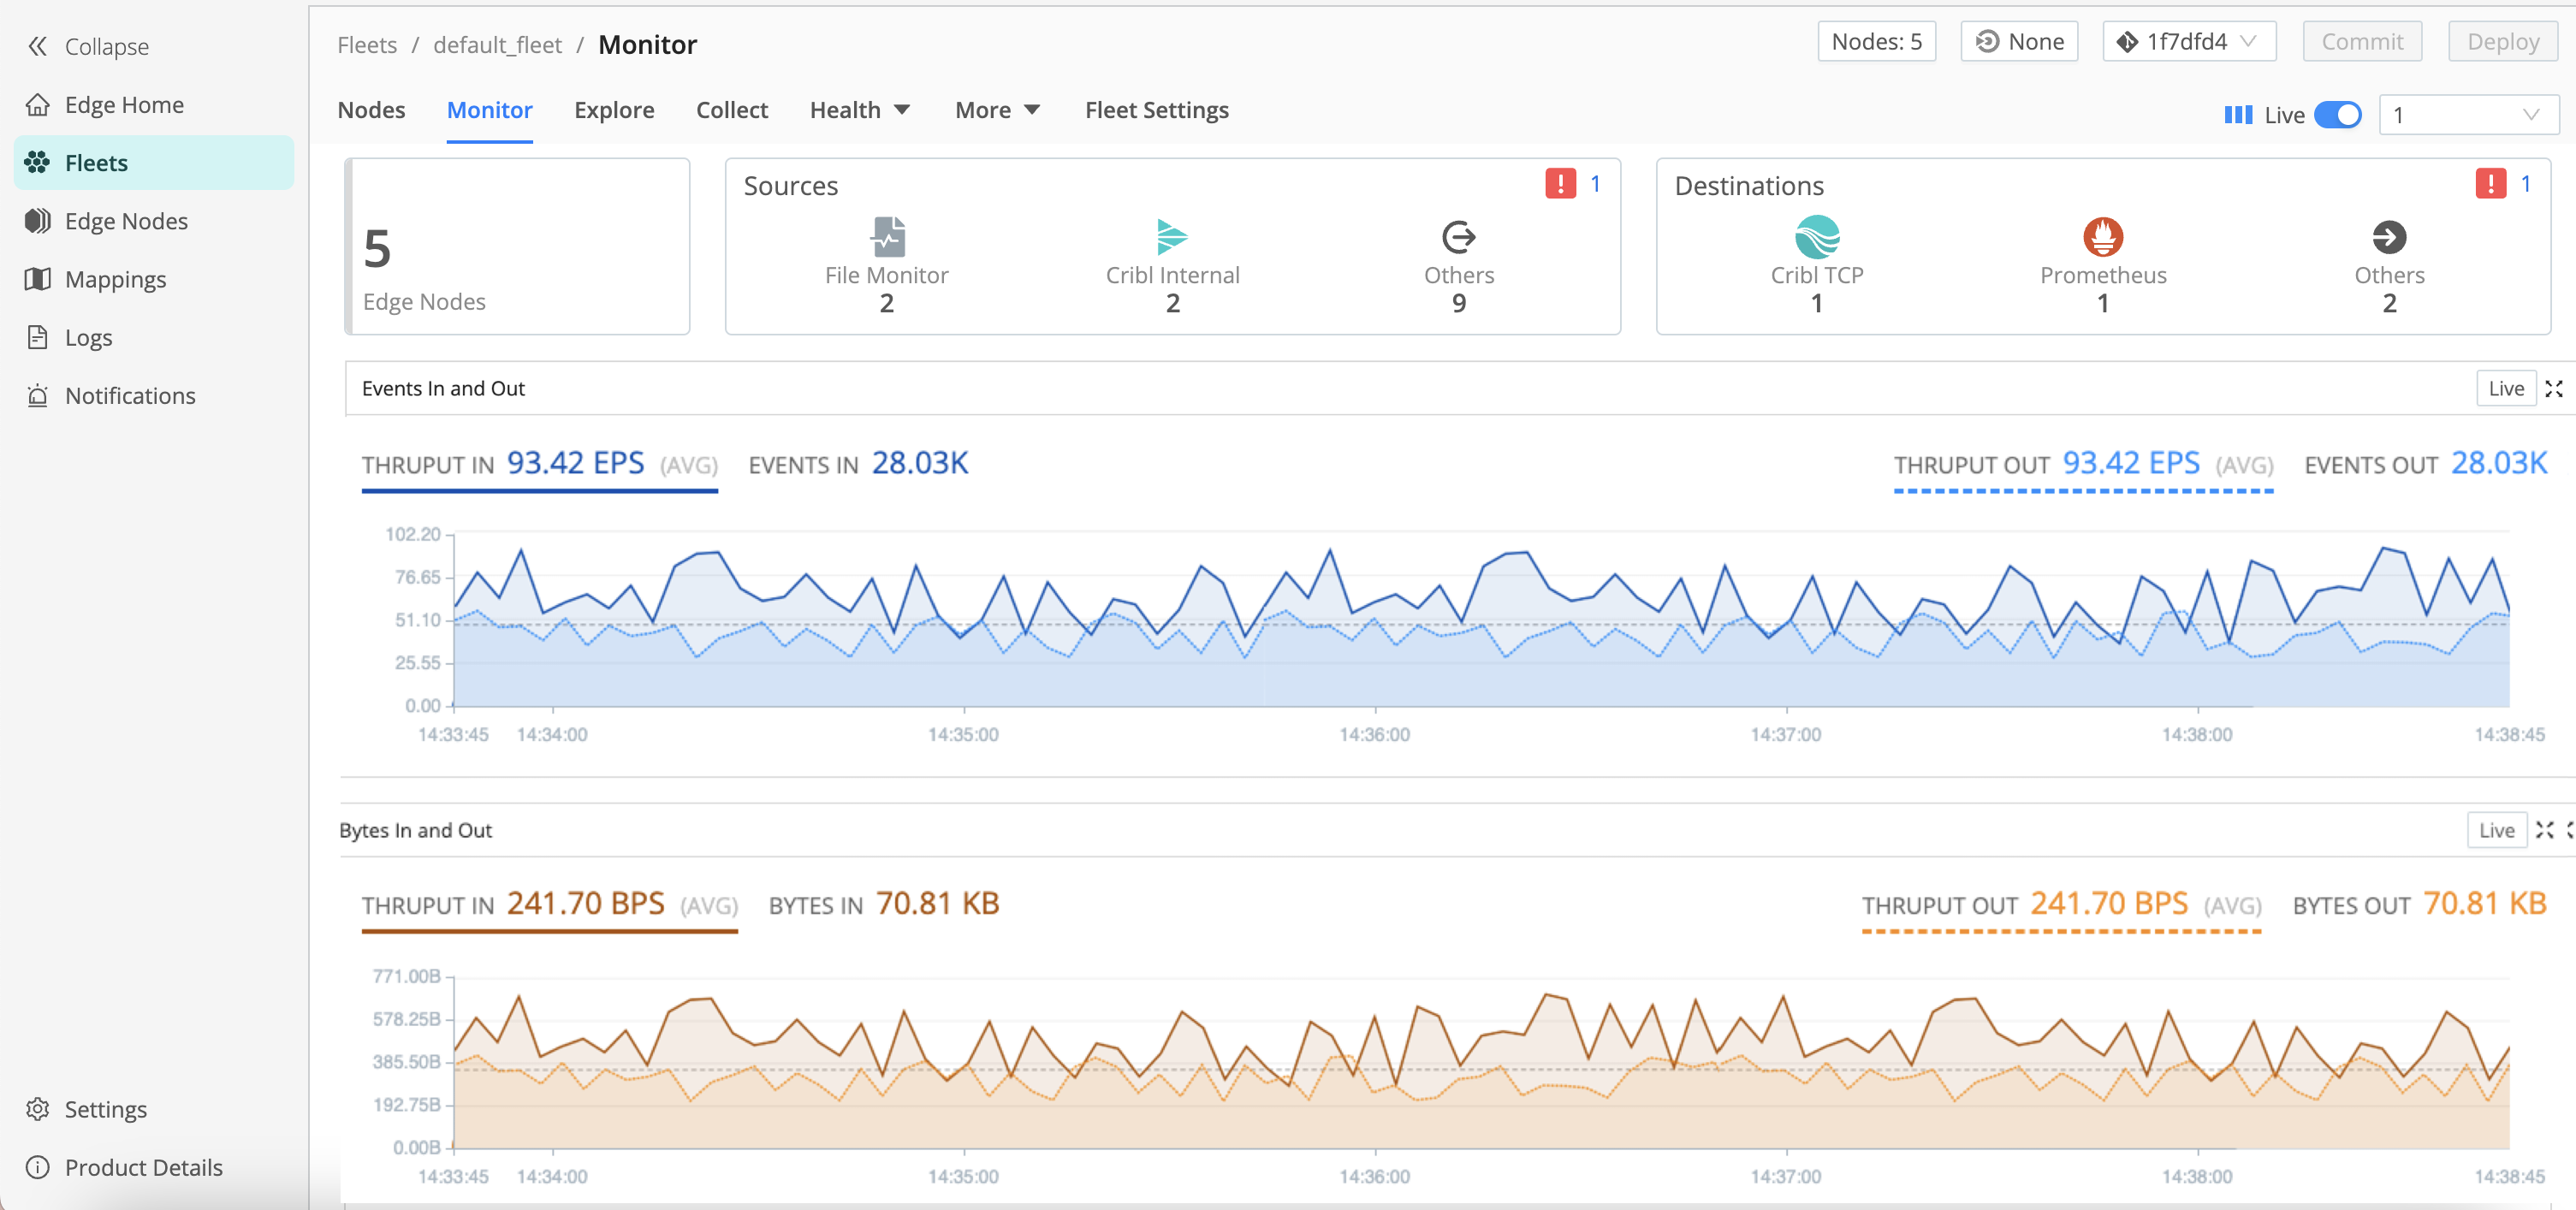
- Use this page to identify whether Sources, Destinations, or both are experiencing issues.
- Select a health status icon to open the Source or Destination list.
Monitor Edge Node Information
To view monitoring information for Edge Nodes, select Edge Nodes from the sidebar. Here, you can view the health of each individual Node, as well as Sources and Destinations.
Individual Edge Node Health
You can review the health status of an Edge Node in two ways: teleport into the Node, or use the Node Info drawer.
Monitor Edge Nodes via Teleport
When you teleport into a Node, you can view monitoring information for Data Fields, System, Reports, and Logs.
To teleport into an Edge Node:
- From the Fleet landing page, select the List View tab.
- Select an Edge Node GUID link to teleport from the Leader into the Edge Node.
- From the top nav of the Edge Node, select the Health tab for monitoring details.
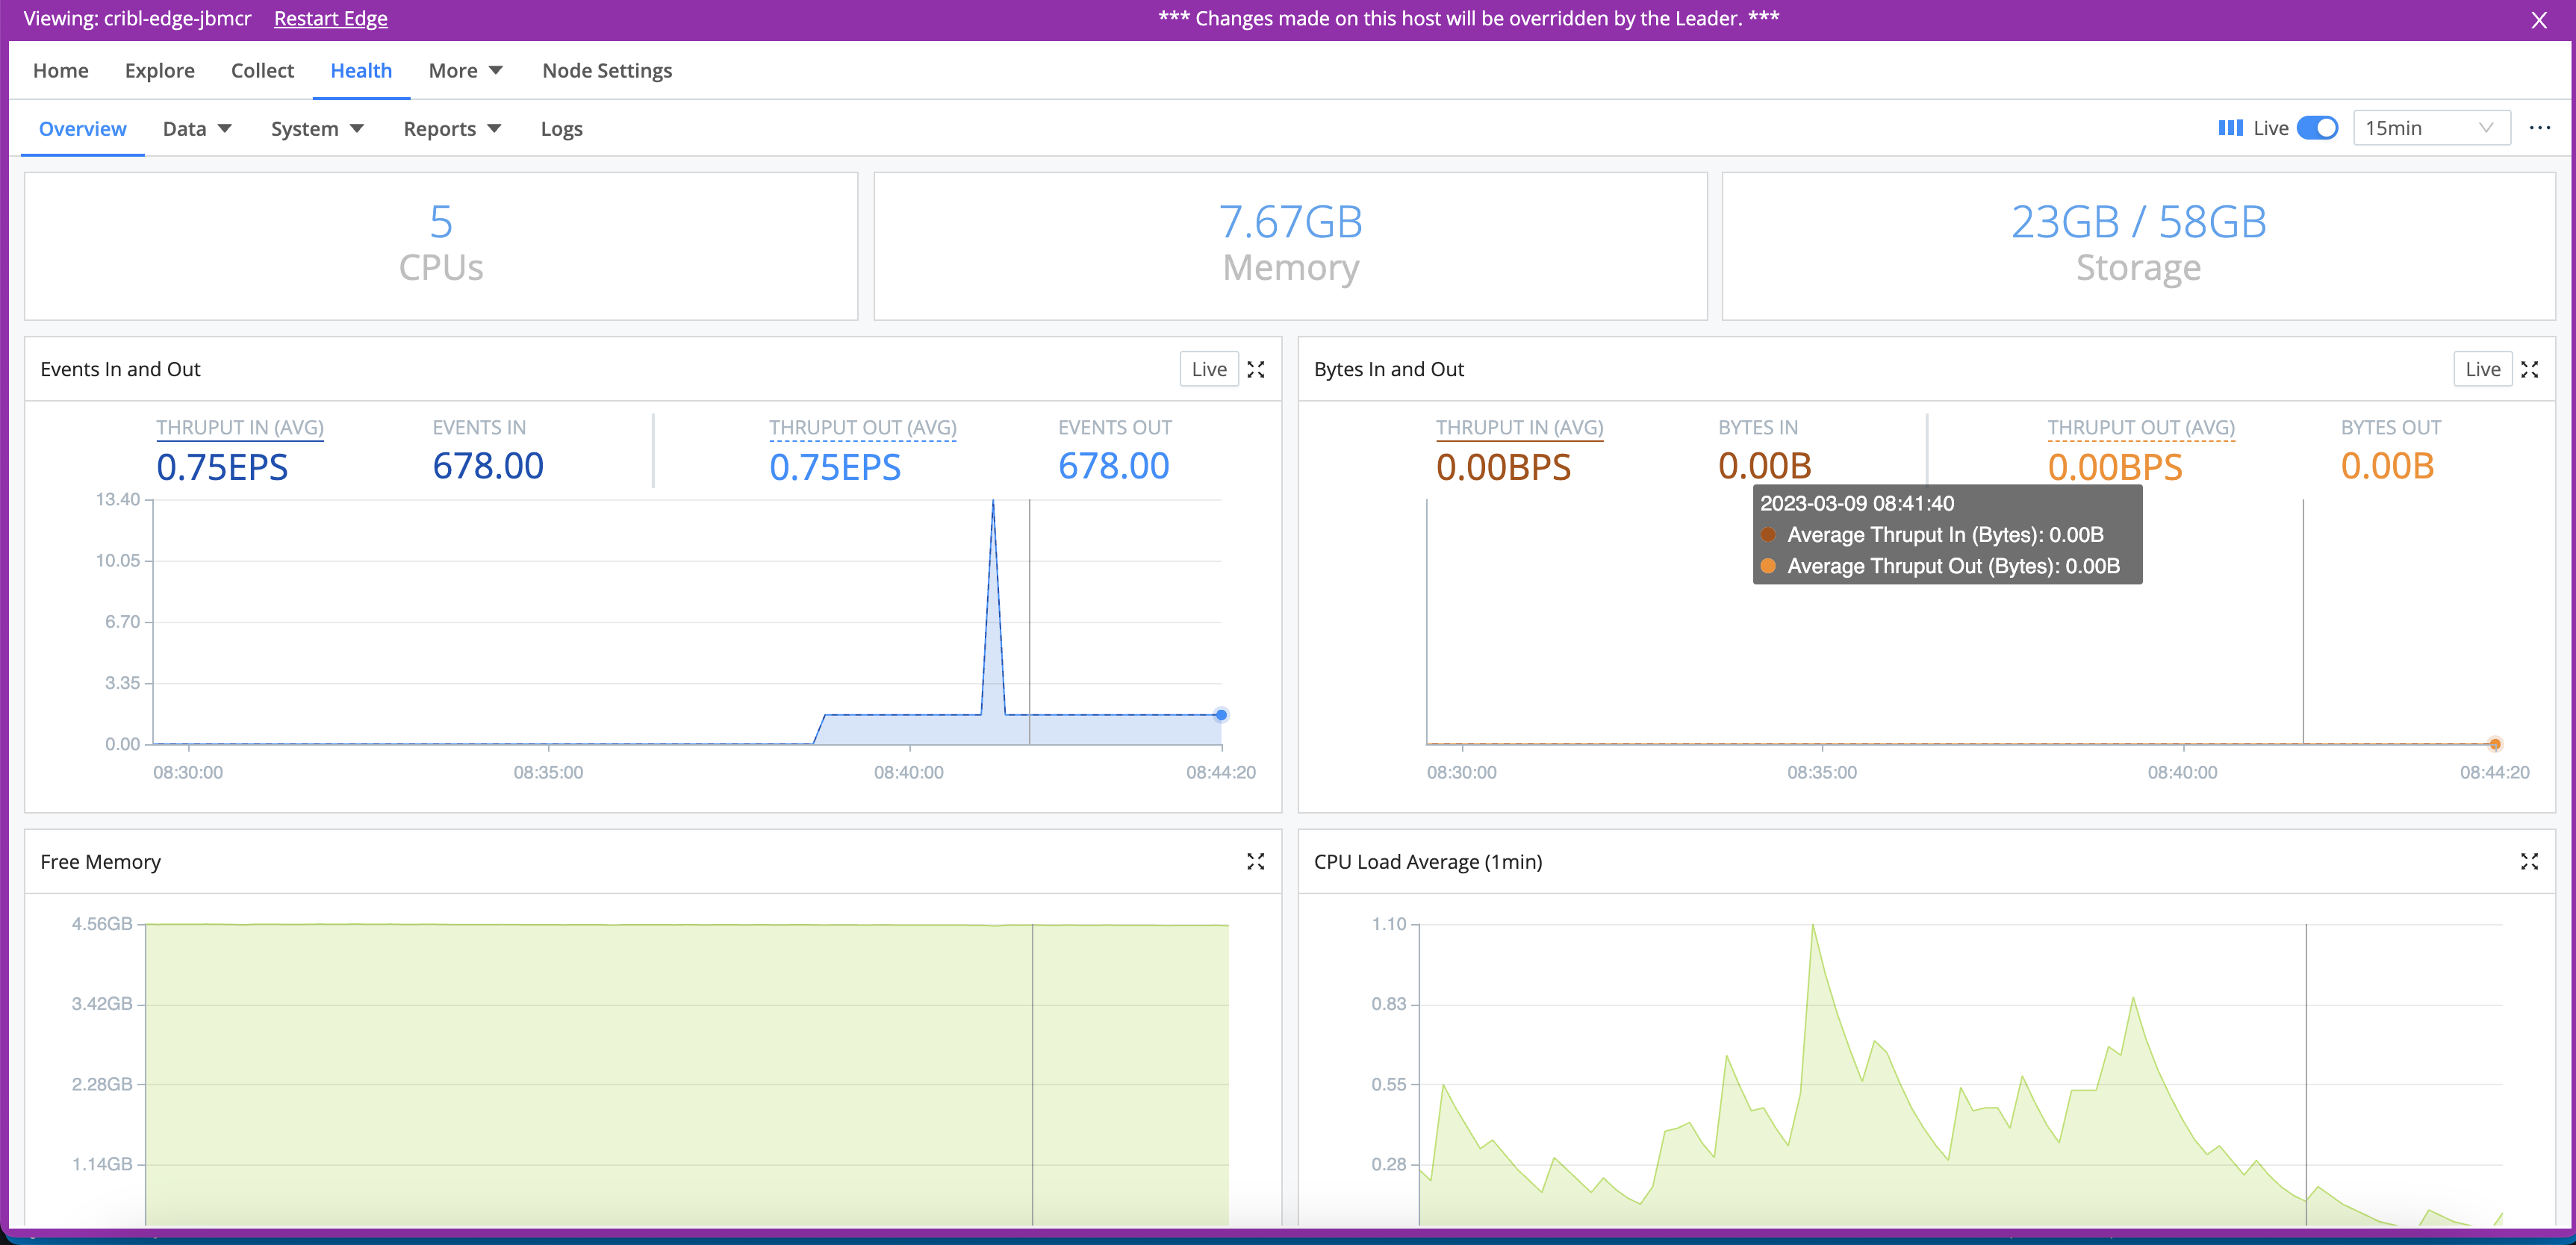
The displayed Storage represents the amount of free storage remaining on the partition where Cribl Stream is installed. (This quantity might not represent the maximum storage available for the selected Edge Node or Fleet. Also, it does not calculate the system free space.)
Similarly, the Free Memory graph reflects only the operating system’s free
statistic, matching Linux’s strict free definition by excluding buff/cache
memory. So this graph indicates a lower value than the OS’ available memory
statistic - and it does not necessarily indicate that the OS is running out of
memory to allocate.
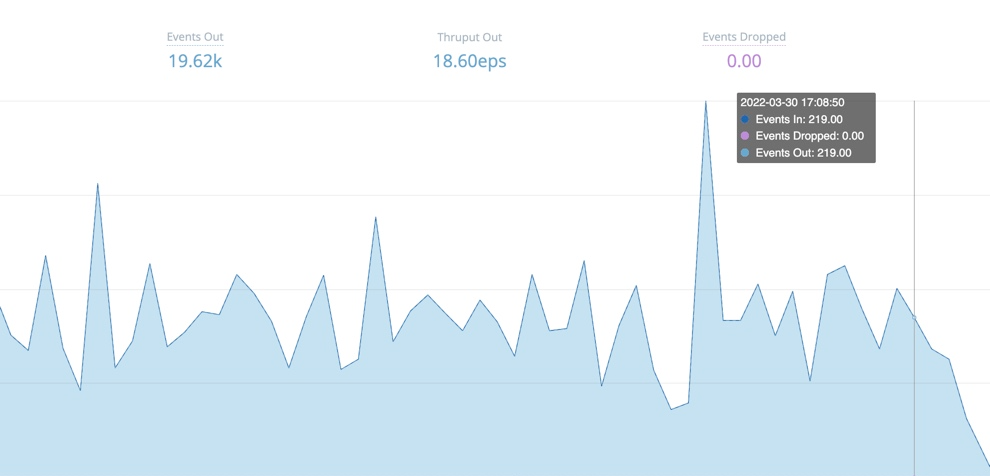
Byte-related charts show the uncompressed amounts and rates of data processed over the selected time range:
- Events (total) in and out
- Events per second in and out
- Bytes (total) in and out
- Bytes per second in and out
We measure bytes in and out based on the size of _raw, if this field is
present and is of type string. Otherwise, we use the size of read
(uncompressed) data.
The displayed CPU Load Average is an average Edge Node Process, updated at 1-minute granularity. (It is not an average for the Edge Node as a whole.)
Monitoring data does not persist across Cribl Edge restarts. Keep this in mind before you restart the server.
Monitor Edge Nodes without Teleporting
To view the Node health status without teleporting, select anywhere on the row to open the Node Info drawer.
System Monitoring
To view System Monitoring information, first teleport into the Node.
From the Health tab, open the System drop-down to view isolated throughput for:
- Queues (Sources)
- Queues (Destinations)
For details, see Persistent Queues.
Reports
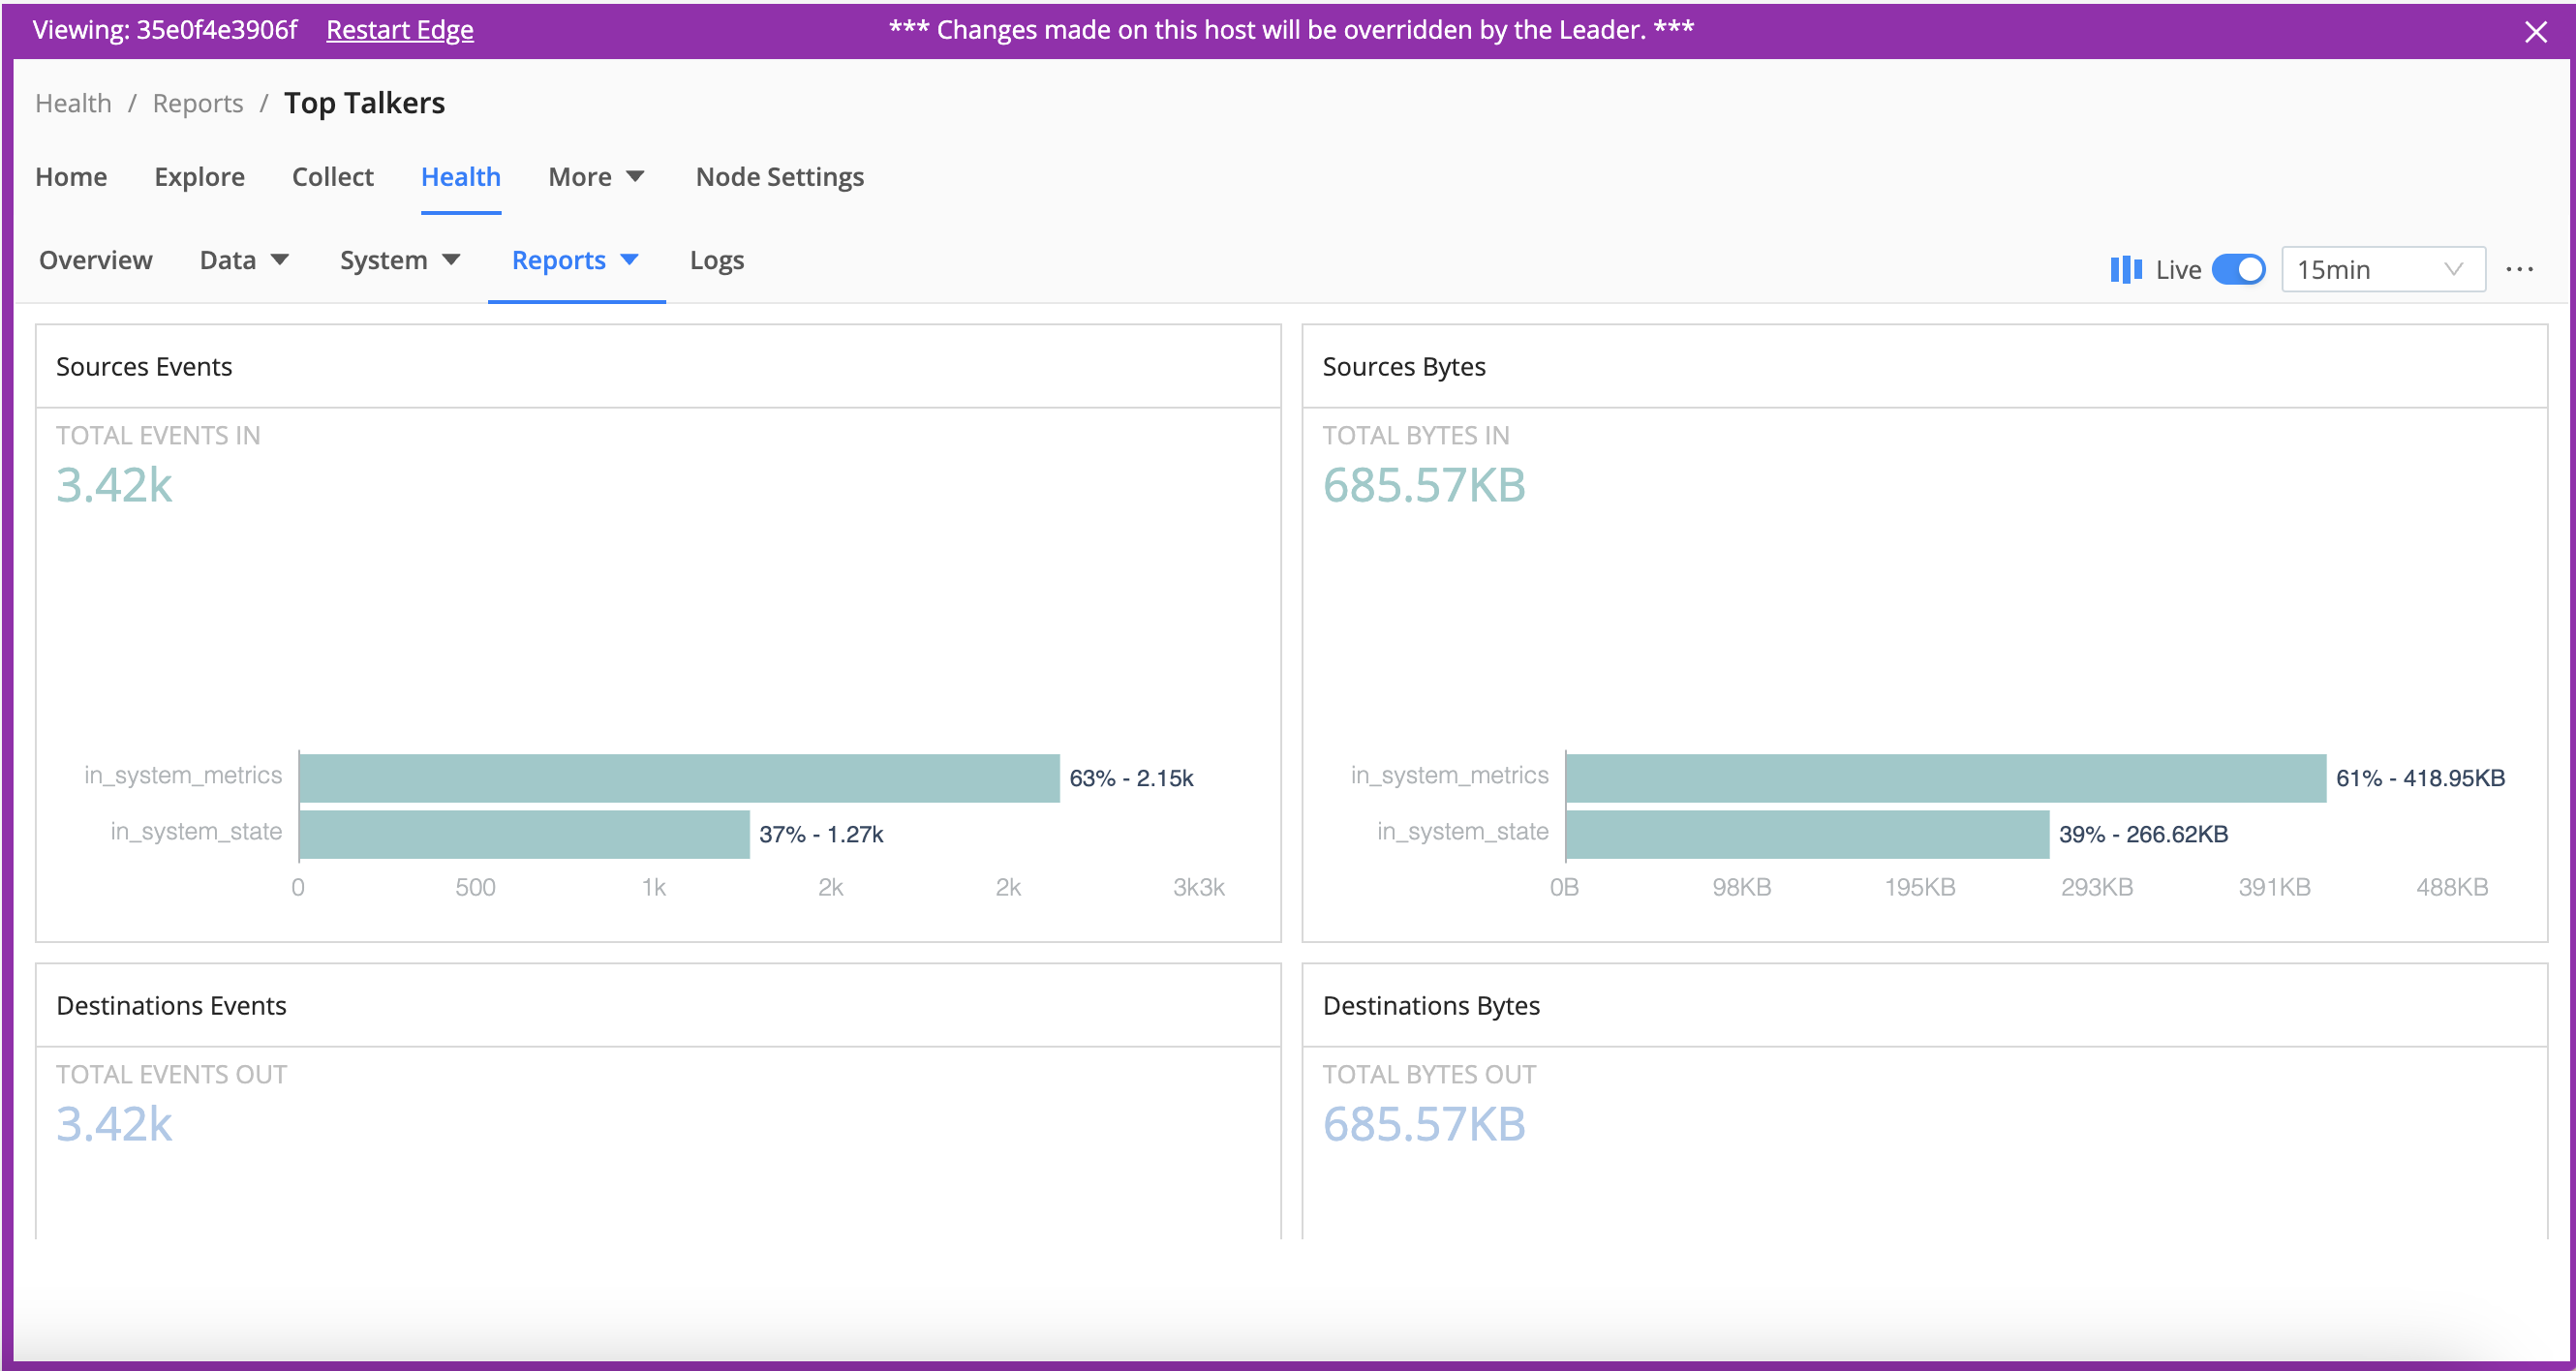
To view reports for Top Talkers, first teleport into the Node.
Select Health > Reports > Top Talkers, where you can examine your five highest-volume Sources, Destinations, Pipelines, Routes, and Packs. All components are ranked by events throughput. Sources and Destinations get separate rankings by bytes in and out, respectively.
Internal Logs and Metrics
To view all logs, select Logs from the sidebar. You can also teleport into a Node to view Node-specific logs.
Internal logs and internal metrics provide comprehensive information about an instance’s status/health, inputs, outputs, Pipelines, Routes, Functions, and traffic.
Cribl Edge displays metrics in units of KB, MB, GB, and TB. At each level, these are multiples of
1024.
Health Endpoint
Each Cribl Edge instance exposes a /health endpoint that is commonly used along with a Load Balancer to support operational decision-making. See Leader High Availability/Failover: Load Balancers for more information.
For many HTTP-based Sources, you can enable a Source-level health check endpoint in the Advanced Settings tab. The request URL format for these endpoints is
http(s)://${hostName}:${port}/cribl_health. Refer to the configuration instructions for a Source to learn whether the health check endpoint is available for it.
Types of Logs
Cribl Edge provides the following log types, by originating process:
API Server Logs - These logs are emitted primarily by the
API/mainprocess. They correspond to the top-levelcribl.logthat shows up on the Diag page. These include telemetry/license-validation logs. Filesystem location:$CRIBL_HOME/log/cribl.logEdge Node Process(es) Logs - These logs are emitted by all the Edge Node Processes, and are very common on single-instance deployments and Edge Nodes. Filesystem location:
$CRIBL_HOME/log/worker/N/cribl.logFleet Logs - These logs are emitted by all processes that help a Leader Node configure Fleets. Filesystem location:
$CRIBL_HOME/log/group/GROUPNAME/cribl.log
For details about generated log files, see Internal Logs. To work with logs in Cribl Edge’s UI, see Search Internal Logs.
Log Rotation and Retention
Cribl Edge rotates logs every 5 MB, keeping the most recent 5 logs. Logs will reach the 5 MB threshold more quickly with verbose logging settings (such as debug) and with high volumes of system activity. In a
Distributed deployment (Edge), all Edge Nodes
forward their metrics to the Leader Node, which then consolidates them to
provide a deployment-wide view.
For long-term retention, Cribl recommends sending logs from the Leader, and the Cribl Internal > CriblLogs Sources on Edge Nodes, to a downstream service of your choice. See the next section for details.
Forward Logs and Metrics Externally
Cribl Edge supports forwarding internal logs and metrics to your preferred external monitoring solution. To make internal data available to send out, go to More > Sources and enable the Cribl Internal Source.
This will send internal logs and metrics down through Routes and
Pipelines, just like another data source. Both logs and metrics
will have a field called source, set to the value cribl, which you can use
in Routes’ filters.
Note that the only logs supported here are Edge Node Process logs (see Types of Logs above). You can, however, use a Script Collector to listen for API Server or Edge Node Fleet events.
For recommendations about useful Cribl metrics to monitor, see Internal Metrics.
CriblMetrics Override
The Disable field metrics setting - in Settings (top nav) > System General Settings > Limits - applies only to metrics sent to the Leader Node. When the Cribl Internal Source is enabled, Cribl Edge ignores this Disable field metrics setting, and full-fidelity data will flow down the Routes.
Search Internal Logs
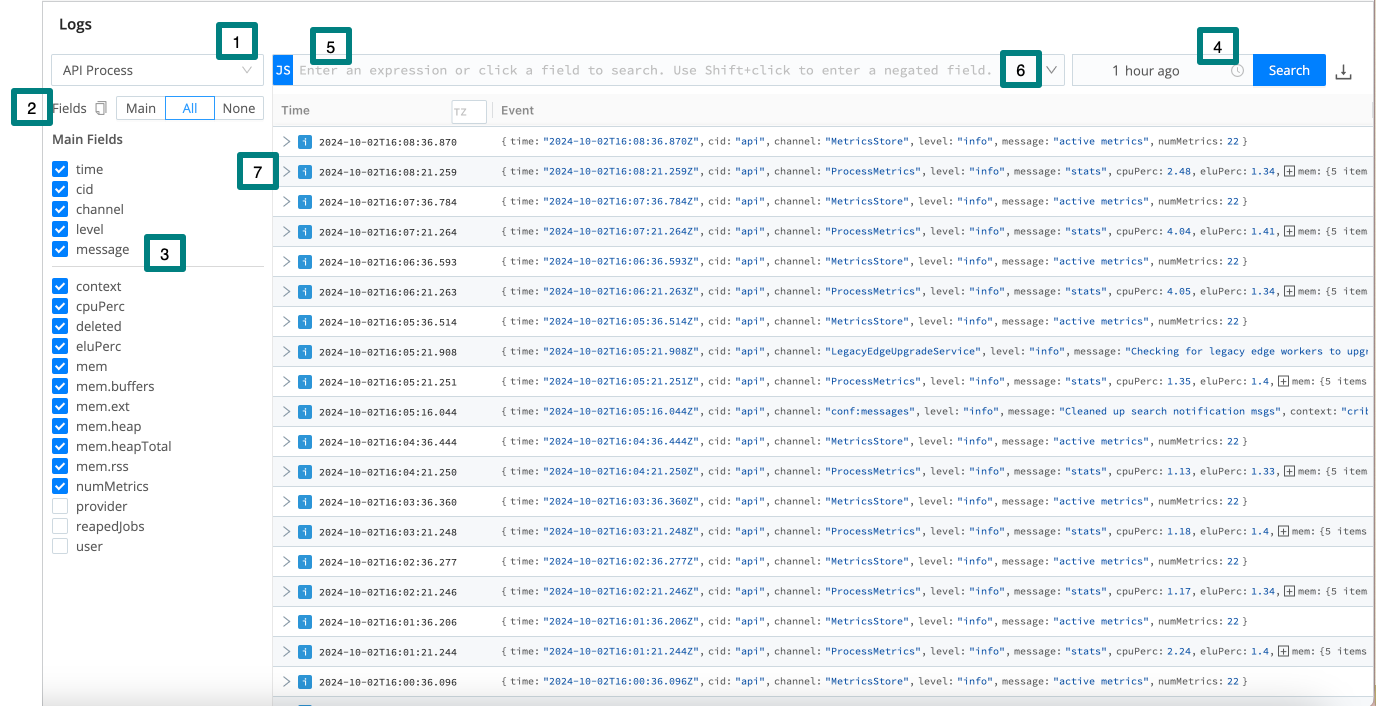
Cribl Edge exists because logs are great and wonderful things! Using Cribl Edge’s Health > Logs page, you can search all Cribl Edge’s internal logs at once - from a single location, for both Leader and Edge Node. This enables you to query across all internal logs for strings of interest.
The labels on this screenshot highlight the key controls you can use (see the descriptions below):
| Callout | Field | Description |
|---|---|---|
| 1 | Log file selector | Choose the types of logs to view. |
| 2 | Fields selector | Select the Main, All, and None toggles to quickly select or deselect multiple check boxes below. Beside these toggles, a Copy button enables you to copy field names to the clipboard in CSV format. |
| 3 | Fields | Select or deselect these check boxes to determine which columns to display in the Results pane at right. (The upper Main Fields group will contain data for every event; other fields might not display data for all events.) |
| 4 | Time range selector | Select a standard or custom range of log data to display. (The Custom Time Range pickers use your local time, even though the logs’ timestamps are in UTC.) |
| 5 | Search box | To limit the displayed results, enter a JavaScript expression here. An expression must evaluate to truthy to return results. You can press Shift+Enter to insert a newline. To modify the depth of information that is originally input to the Logs page, see Logging Settings. |
| 6 | Search box history | Select the history arrow to retrieve recent queries. |
| 7 | Results | This pane displays most-recent events first. Each event’s icon is color-coded to match the event’s severity level. |
Select individual log events to unwrap an expanded view of their fields.
Logging Settings
On Cribl Edge’s Settings pages, you can adjust the level (verbosity) of internal logging data processed, per logging channel. You can also redact fields in customized ways. In a Distributed Deployment, you manage each of these settings on the Edge Node, Fleet Settings, or main Settings for all Fleets.
The logging levels help to categorize the detail and severity of logged information. Choosing the right level ensures you get the information you need for troubleshooting without getting overwhelmed by a flood of data.
Here’s a breakdown of each logging level:
| Code | Description |
|---|---|
critical | Logs unexpected failures that need to be resolved immediately. |
error | Logs only errors which need immediate attention to ensure the system’s integrity. |
warn | Logs warnings about potential issues that might not be critical but warrant attention to prevent future problems. |
info | Logs general information about the system’s operation, providing insights into standard processes and procedures. |
debug | Logs detailed information for diagnosing and troubleshooting potential problems, providing deep insights into the system’s behavior. |
silly | Logs extremely detailed information and metrics, primarily used for in-depth troubleshooting of inputs and other operations.Use it sparingly and only for short debugging bursts, treating it as “use at your own risk.” Enable temporarily, then disable promptly. |
Notes About Logs
- By default, all integration logging levels are set to
info. This means logs of levelinfoand above (includingerrorandwarn) will be displayed. Manual adjustments are needed to seedebugandsillylogs.- Cribl.Cloud users cannot adjust logging levels for Worker Groups or specific integrations.
Change Logging Levels
To adjust logging levels:
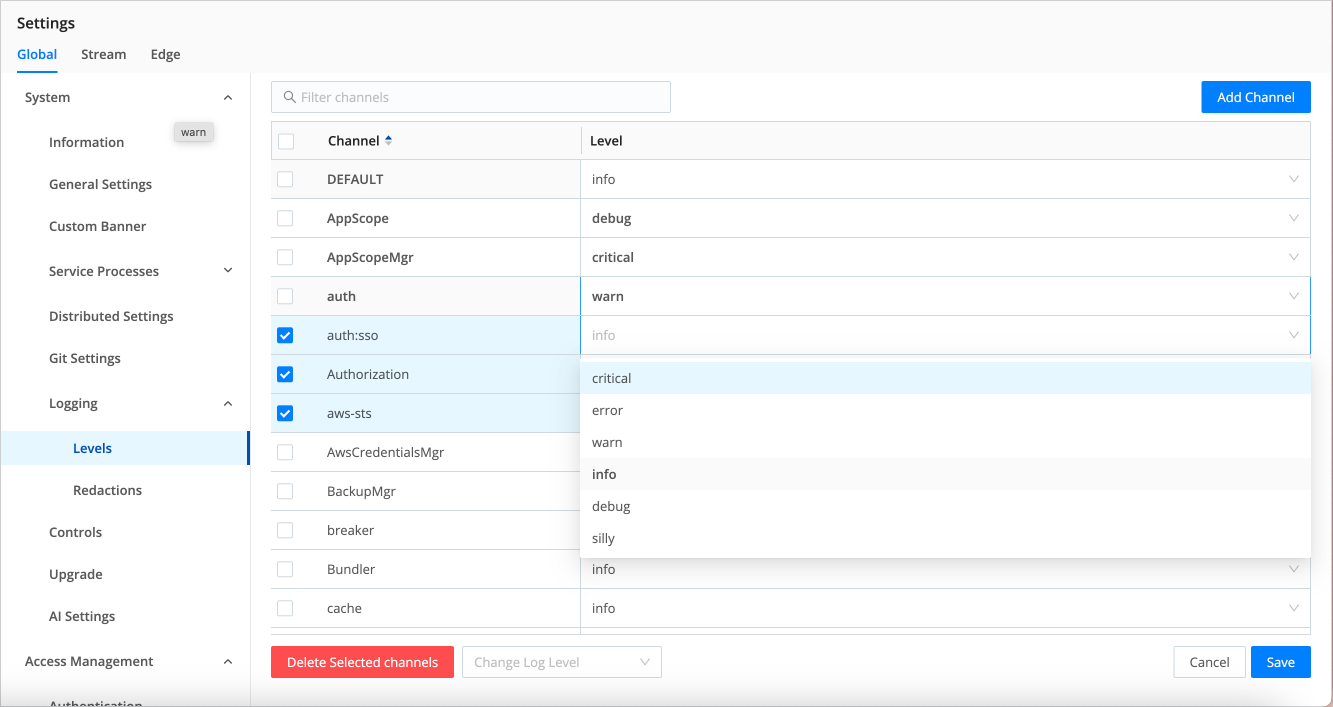
From the sidebar, select Settings > Global > System > Logging > Levels.
To configure log levels on a Fleet-level, select the Fleet you want to configure. Next, select Fleet Settings > System > Logging > Levels.
In a Single-instance deployment you can adjust settings on a specific Edge Node. First teleport into the Node, then select Node Settings > System > Logging > Levels.
On the resulting Manage Logging Levels page, you can:
Modify one channel by selecting its Level column. In the resulting drop-down, you can set a verbosity level ranging from error up to debug. (Top of composite screenshot below.)
Modify multiple channels by selecting their check boxes, then select the Change log level drop-down at the bottom of the page. You can select all channels at once by selecting the top check box. You can search for channels at top right.
Change Logging Redactions
On the Redact Internal Log Fields page, you can customize the redaction of sensitive, verbose, or just ugly data within Cribl Edge’s internal logs. To access these settings:
In a Single-instance deployment, or for the Leader Node’s own logs, select Settings > Global > System > Logging > Redactions.
In a Distributed Deployment, select the Fleet you want to configure. Next, select Fleet Settings > System > Logging > Redactions.
It’s easiest to understand the resulting Redact Internal Log Fields page’s fields from bottom to top:
| Field | Description |
|---|---|
| Default fields | Cribl Edge always redacts these fields, and you can’t modify this list to allow any of them through. However, you can use the two adjacent fields to define stricter redaction. |
| Additional fields | Type or paste in the names of extra fields you want to redact. Use a tab or hard return to confirm each entry. |
| Custom redact string | Unless this field is empty, it defines a literal string that will override Cribl Edge’s default redaction pattern (explained below) on the affected fields. |
Default Redact String
By default, Cribl Edge transforms this page’s selected fields by applying the following redaction pattern:
- Echo the field value’s first two characters.
- Replace all intermediate characters with a literal
...ellipsis. - Echo the value’s last two characters.
Anything you enter in the Custom redact string field will override this
default ??...?? pattern.