


These docs are for Cribl Edge 4.9 and are no longer actively maintained.
See the latest version (4.17).
Tracking Data Activity for an Edge Node
Monitoring and troubleshooting your Edge Nodes guarantees the integrity and reliability of the data you’re collecting from your Nodes.
Monitoring helps you detect failures early and take quick corrective actions. Troubleshooting ensures that any problems are not only fixed but also analyzed for root causes to prevent further occurrences.
Cribl Edge provides you with Edge Node data activity, so you can monitor and troubleshoot any issues. You can use this data activity from the Edge Node to find out if any of the associated Sources, Destinations, Routes, Pipelines, or Packs are having issues. Then, drill down into individual elements to identify the potential issues. You can see all of this information without teleporting into the Edge Node.
Access Additional Node Information in the Node Info Panel
The Edge Node information and activity drawer gives you more information about a specific Node. To display additional details and controls, click each row. The Node Info panel will open.
With Teleport to Nodes enabled in Fleet Settings, the GUID becomes a link. To open the node information panel in this case, click anywhere in the row except the GUID link.
Viewing the System Activity for a Node
To view system activity, click the row for an Edge Node.
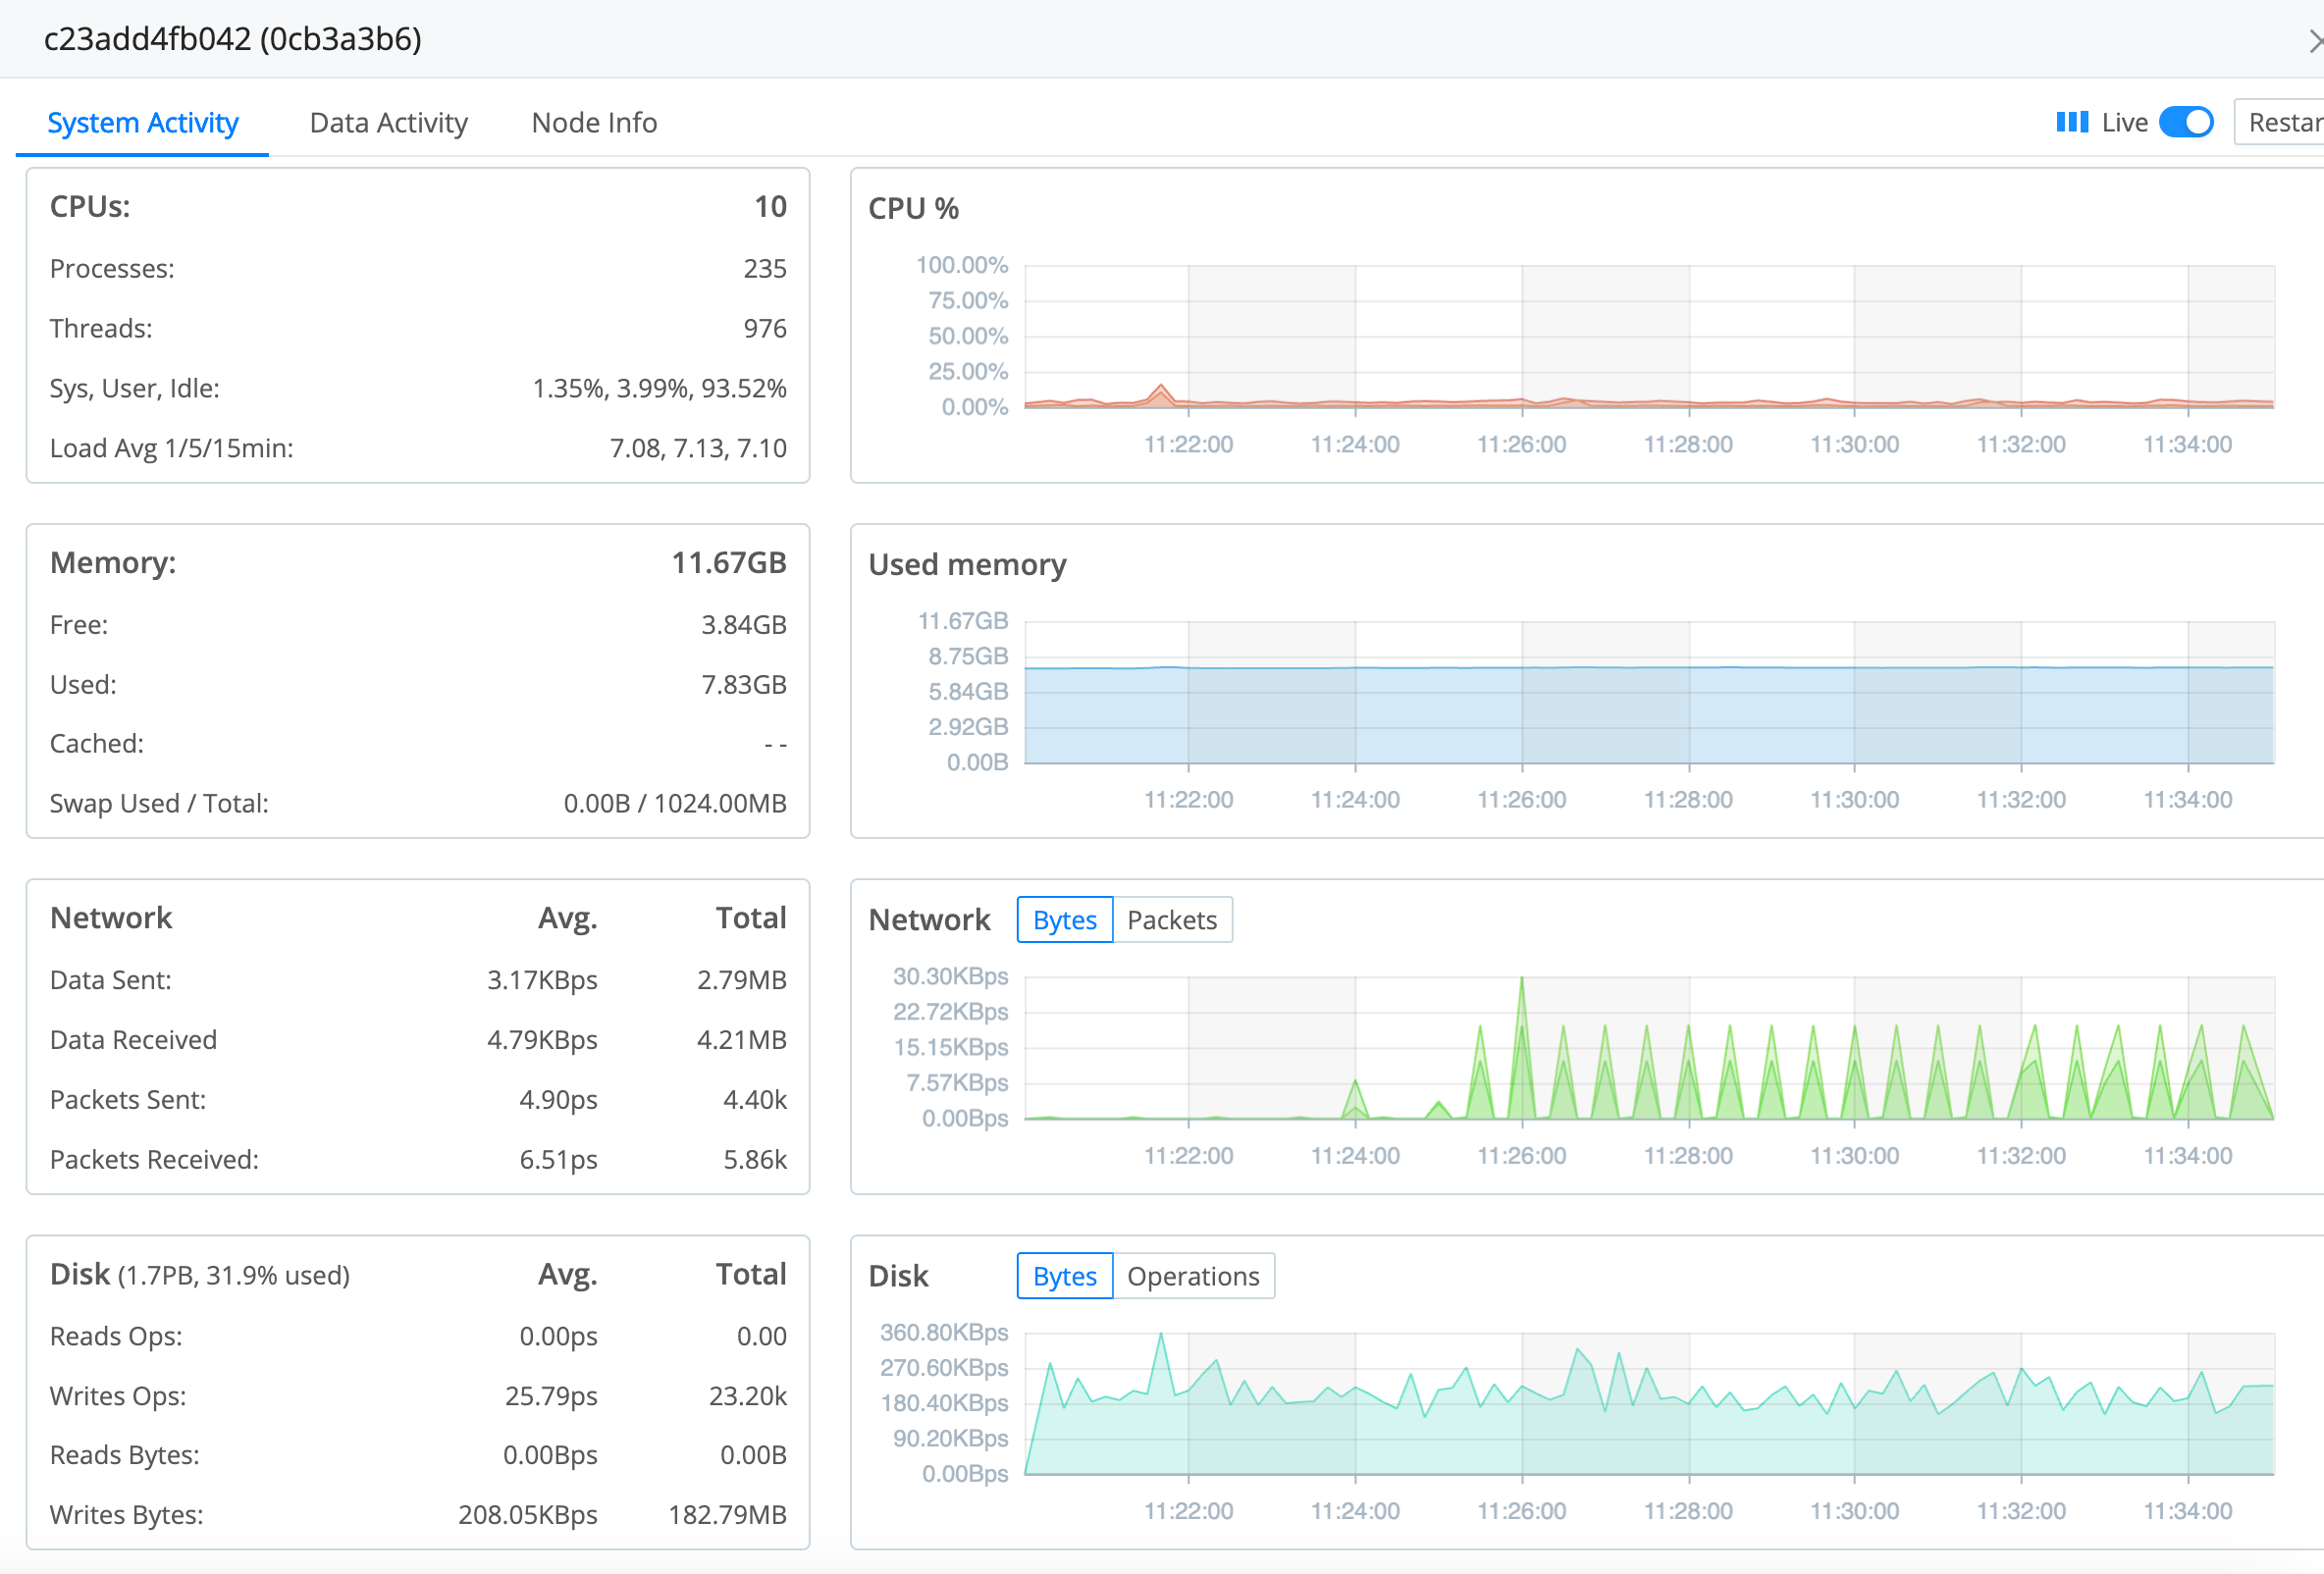
The System Activity tab displays the following system information:
| Field | Description |
|---|---|
| CPUs | Total number of CPUs for this Node, processes, threads, percentages of Sys, User, and Idle, and load average over 1, 5, and 15 minutes. |
| CPU percentage | A graph displaying the total available CPU and CPU usage, in two-minute increments. |
| Memory | Total memory used by this Node, as well as free, used, cached, and swap used/total memory. |
| Used memory | A graph displaying the used memory over two-minute increments. |
| Network | Average and total network data sent and received, and packets sent and received. |
| Network bytes and packets | A graph displaying network bytes and packets sent and received by the Node, in two-minute increments. |
| Disk | Average and total read and write operations and read and write bytes. |
| Disk bytes and operations | A graph displaying disk bytes and operations in two-minute increments. |
Viewing the Data Activity for a Node
To view data activity, click the row for an Edge Node.
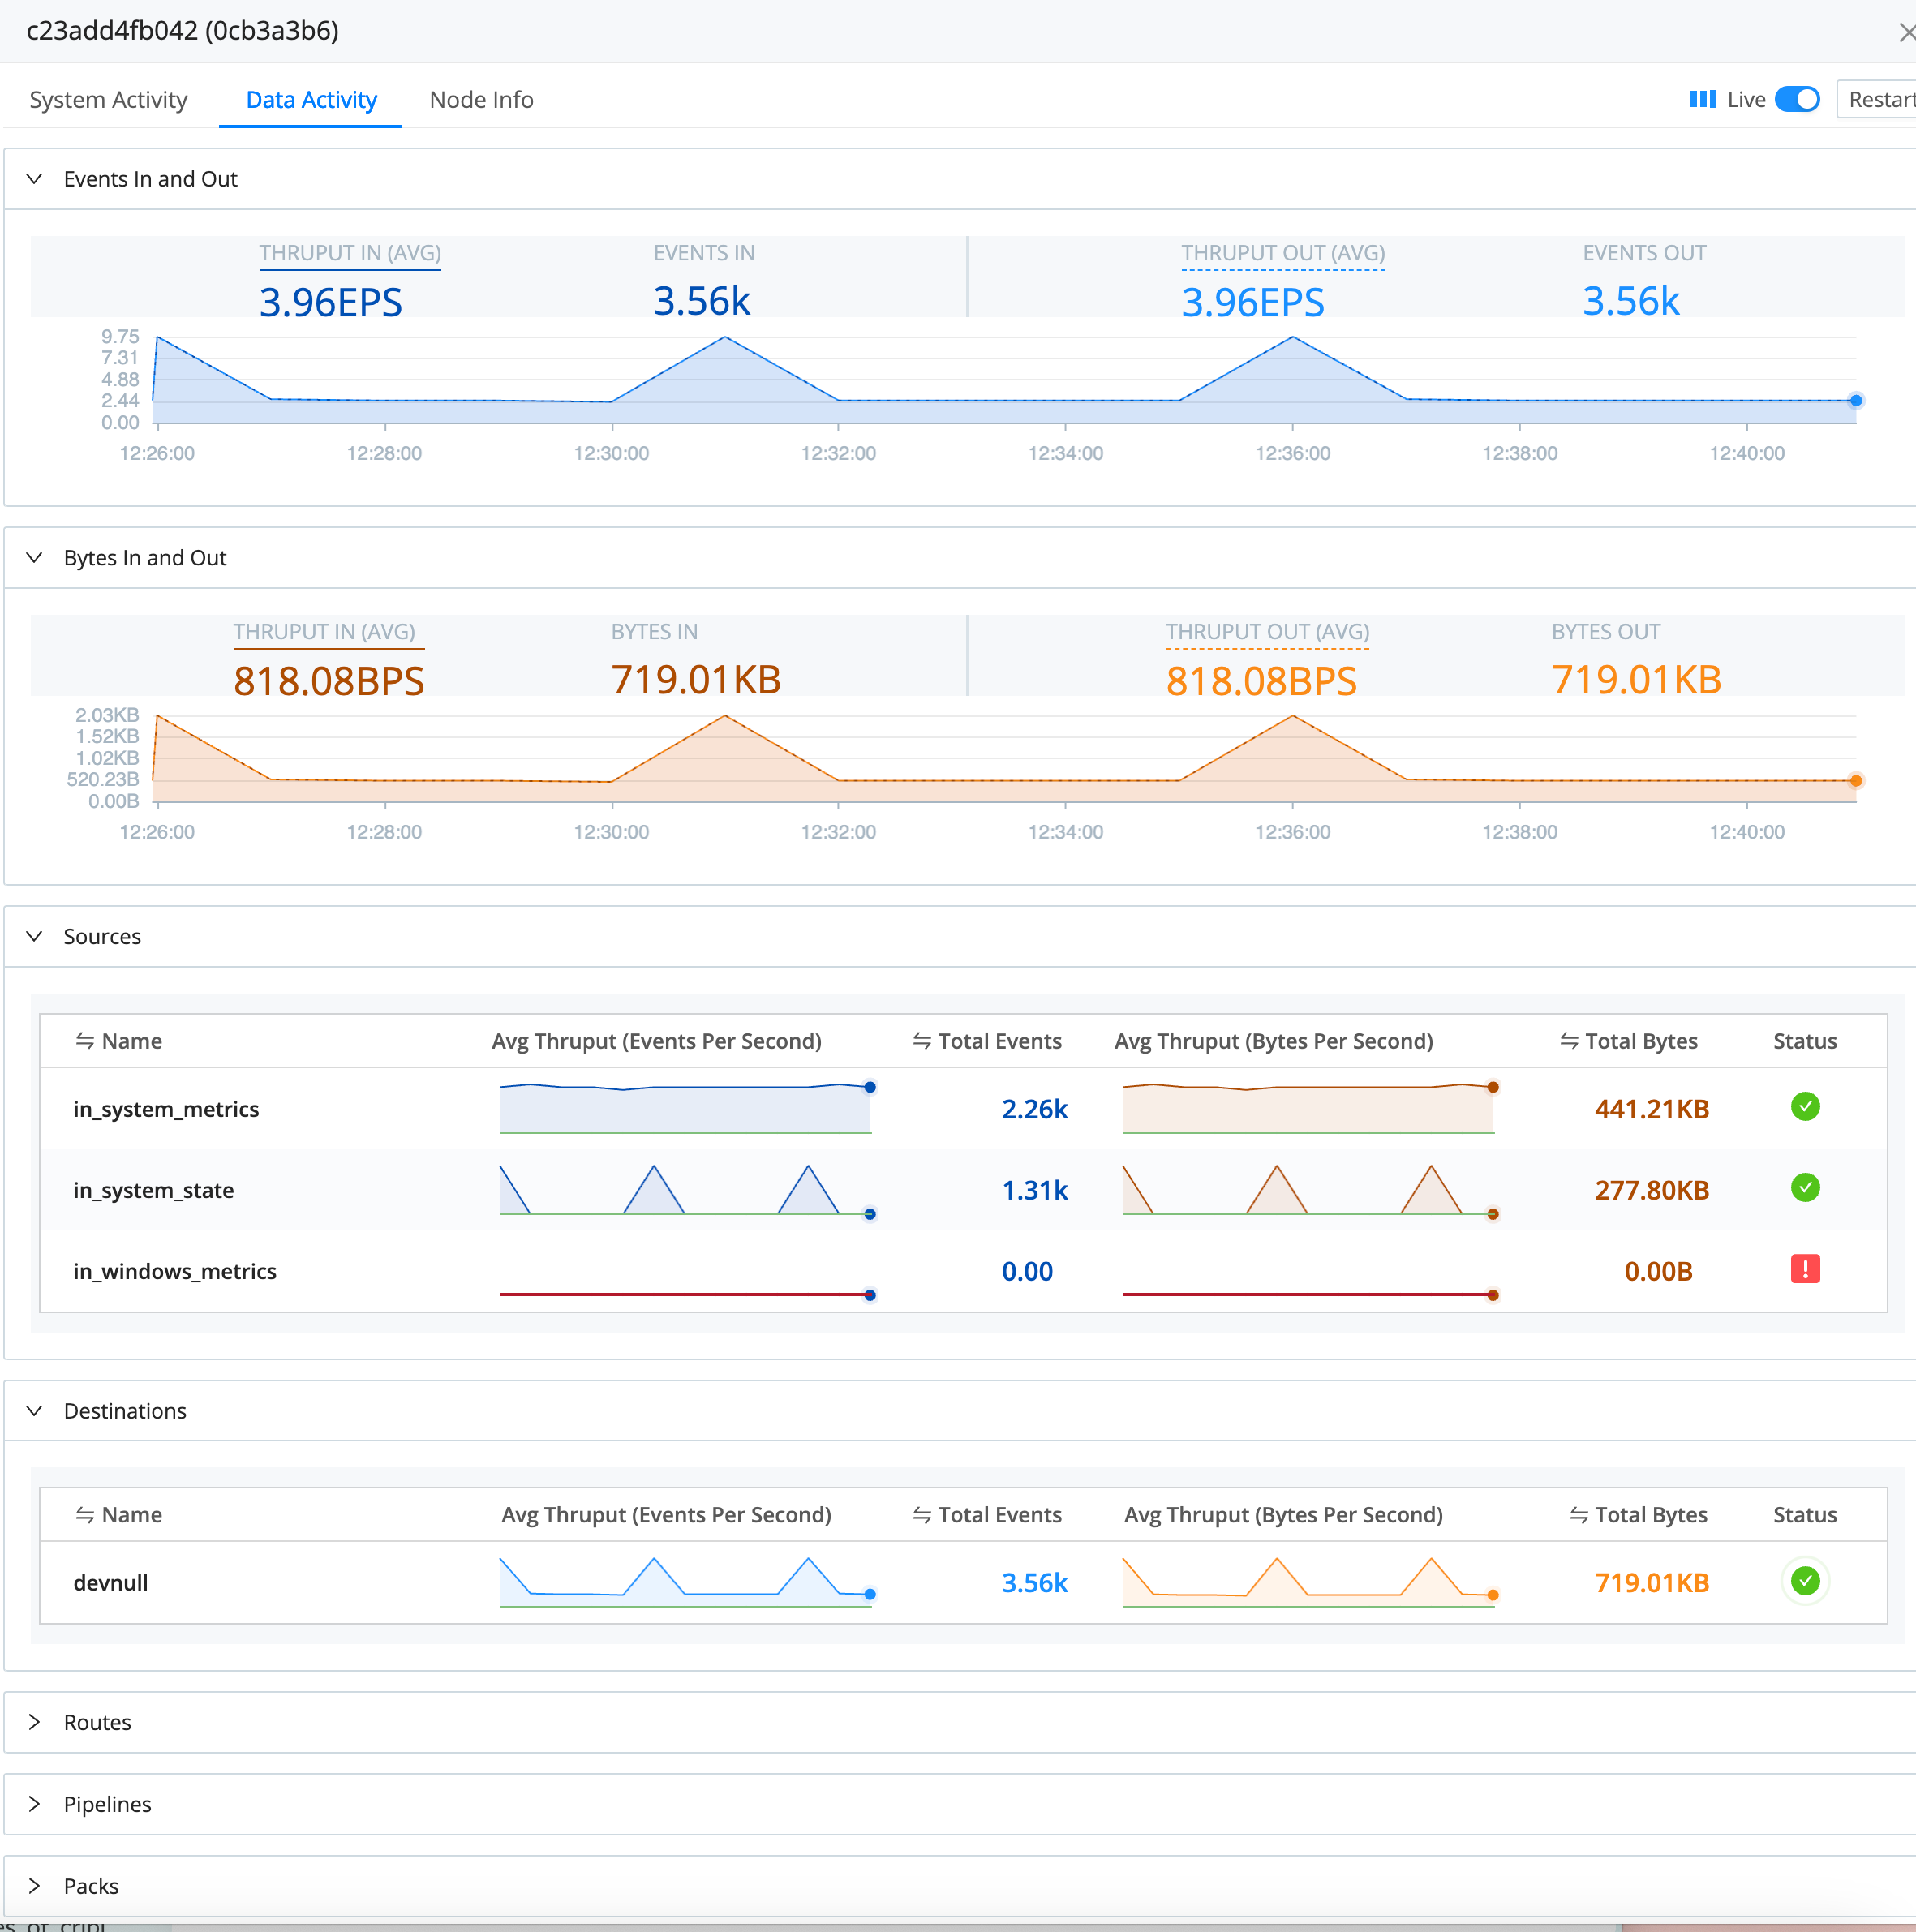
The Data Activity tab displays the following data information:
| Field | Description |
|---|---|
| Events In and Out | A graph displaying event throughput in (avg), events in, throughput out (avg) and events out. |
| Bytes In and Out | A graph displaying bytes throughput in (avg), bytes in, throughput out (avg) and bytes out. |
| Sources | Each Source that this Node is receiving events from, along with:
|
| Destination | Each Destination that this Node is sending events to, along with:
|
| Routes | The Routes configured on this Node, along with average throughput (events per second and bytes per second), total events, and total bytes. |
| Pipelines | The Pipelines this Node sends events through, along with average throughput (events per second in and out) and total events in and out. |
| Packs | The Packs associated with this Node, along with average throughput (events per second in and out) and total events in and out. |
The health status icons indicate the overall health of the Sources, Destinations, Routes, Pipelines, and Packs:
 Green checkmark: Everything is good! All resources are healthy.
 Yellow warning icon: Attention needed. One or more resources are in a warning state.
 Red exclamation point: Critical issue! One or more resources have encountered an error.
 Indeterminate: No data available yet.
Viewing Additional Edge Node Info
To view detailed information, click the row for an Edge Node.
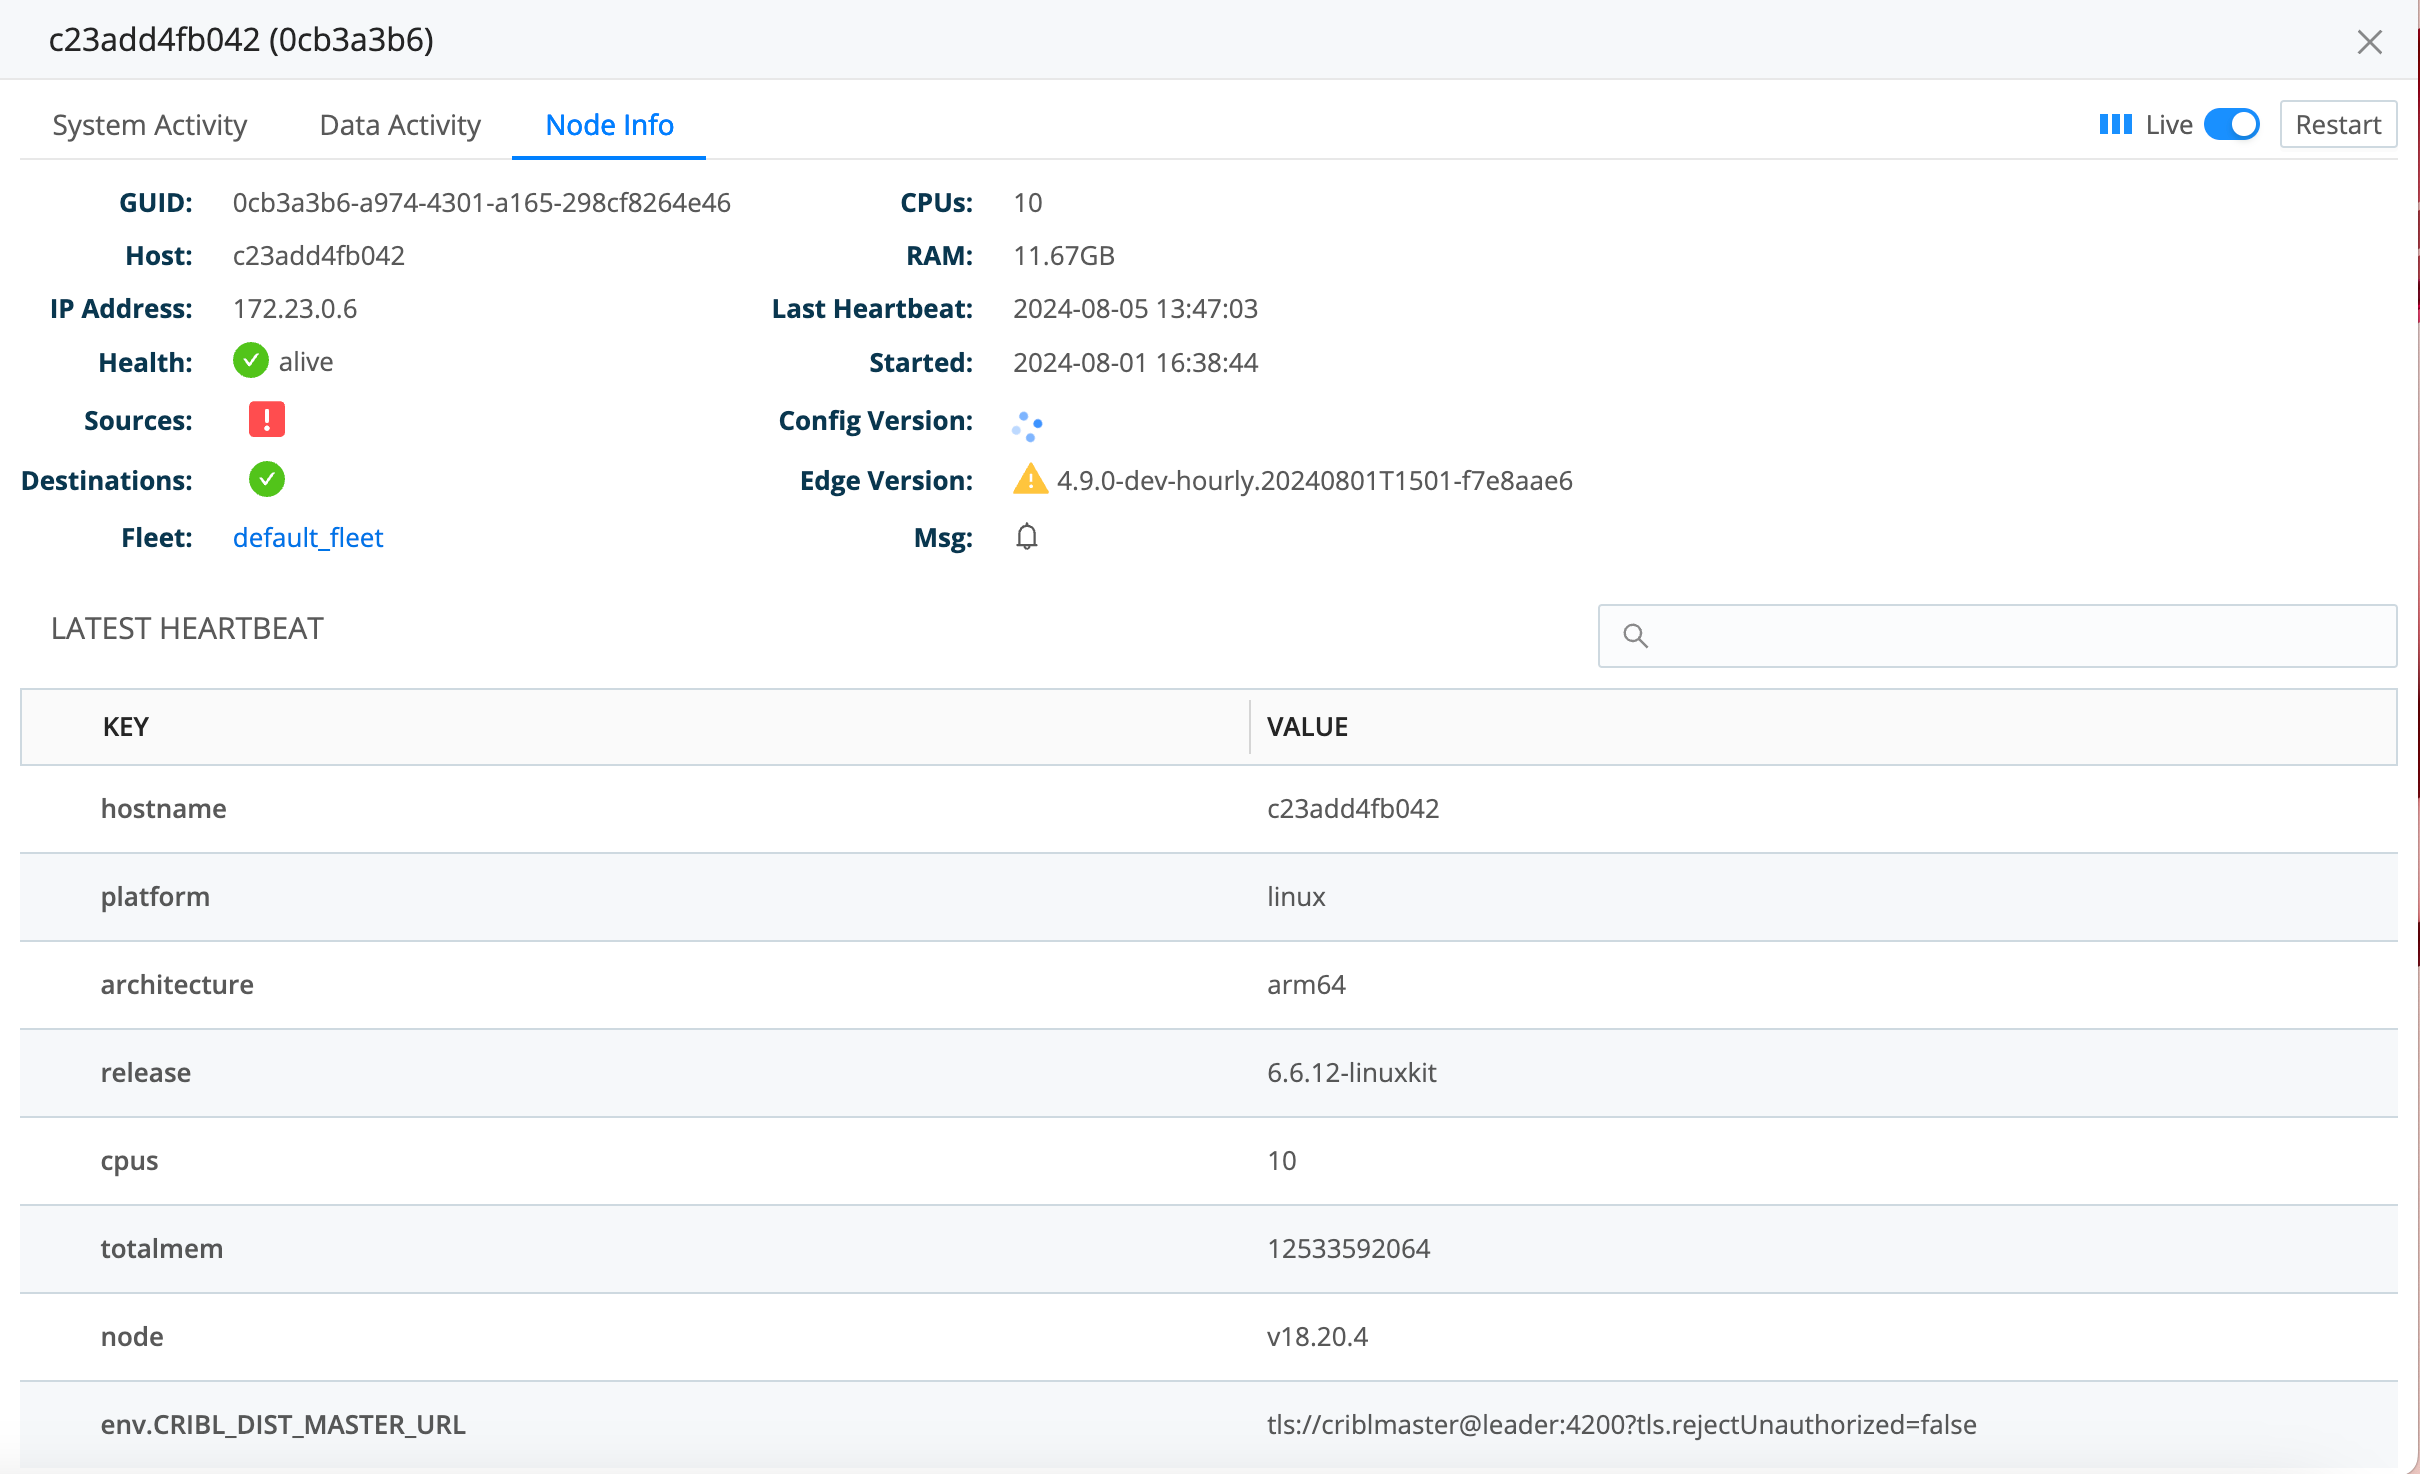
The Node Info tab displays the following Node information:
| Field | Description |
|---|---|
| Node info | Detailed information for this Node:
|
| Key:Value pairs | When an Edge Node first connects to the Leader, it sends an initial report, which is the data shown here. This report includes specifics about the operating system, the underlying infrastructure (such as Kubernetes or EC2), and the Cribl configuration settings. |