Collect and Visualize Nvidia GPU Metrics
Collect Nvidia GPU metrics with Cribl Edge to monitor utilization, temperature, memory, power, and other related metrics on GPU-backed hosts.
GPU-backed workloads need visibility into hardware health and capacity. Cribl Edge can emit structured GPU metrics on a schedule, then route them to Cribl Stream, Cribl Lake, or other Destinations for analysis in Cribl Search or external dashboards.
For a full description and reference of the Source’s settings, see System Metrics Source.
This guide presents how to collect GPU metrics on an Edge Node deployed on Linux. To collect GPU metrics from Windows Edge Nodes, use the Windows Metrics Source instead of the System Metrics Source.
Prerequisites
- A host with an Nvidia GPU and an Edge Node.
- Nvidia drivers installed, including the
nvidia-smiutility (which is usually installed with the drivers).
Collect GPU Metrics With the System Metrics Source
The System Metrics Source includes a GPU Metrics Collector that emits metrics events. Configure Basic for basic, aggregated metrics, All for detailed, aggregated metrics, or Custom to toggle Per GPU metrics and Detailed metrics. See GPU Metrics for the exact options.
On the top bar, select Products, then Edge. Under Fleets, select a Fleet.
Select More > Sources, then System Metrics.
Select Add Source (or open the existing System Metrics Source,
in_system_metrics).Open GPU Metrics and choose Basic for basic, aggregate metrics, All for full detail, or Custom to toggle Per GPU metrics and Detailed metrics.
See GPU Metrics for the exact options.
Select Save, then Commit, enter a commit message, and select Commit & Deploy.
To confirm the Source is working correctly, open the Source and select its Live Data tab to preview a sample of the metrics being collected.
For emitted metric names, types, and modes, see Linux System Metrics Details.
Send Metrics for Shaping, Storage, and Analysis
After GPU events flow from the System Metrics Source, you have a few ways of routing them further:
- You can pair a Cribl HTTP Destination in Cribl Edge with a Cribl HTTP Source in Cribl Stream to send the metrics to Cribl Stream and make use of its data enrichment and routing capabilities. Refer to Cribl Edge to Cribl Stream for more information.
- You can pass the metrics Cribl Lake for longer-term storage. To do it, follow Send Logs and Metrics to Cribl Lake.
- You can also send the data straight to Cribl Search using the Cribl Search Destination to analyze, shape, and visualize this data. See the following section for an example of how to do it and then visualize the metrics in a Search Dashboard.
Visualize GPU Metrics in Cribl Search
You can send GPU metric events from Cribl Edge to Cribl Search, then display them on a Dashboard.
For more details about sending data from Cribl Stream or Cribl Edge into Search Datasets, see Ingest Cribl Stream/Edge Data into Cribl Search.
Send GPU Metrics to Cribl Search
First, you need to send the collected GPU metrics to Cribl Search by using the Cribl Search Destination.
- In your Fleet, create a new Cribl Search Destination. Enter a unique name in Output ID. Accept the default Cribl endpoint value, which is auto-populated for you in Cribl.Cloud.
- Optionally configure Throttling, Backpressure behavior, Tags.
- Confirm with Save.
- Select Collect and connect the System Metrics Source that collects the GPU metrics to the new Cribl Search Destination.
- Commit and deploy your changes.
Create a Search Dataset in Cribl Search
Ensure Cribl Search has a lakehouse engine in Ready status .
On the top bar, select Products > Search > Data > Datasets > Add Dataset. See Create Search Datasets for specific options.
Under New Dataset, enter an ID for your Dataset (further examples use
GPU-metrics), and select type Search Dataset.Under Search Dataset, set Retention period, Engine to your existing Lakehouse Engine, and expected timestamp bounds as needed for your environment.
Select Save.
This procedure uses Auto-Datatyping to parse and structure the ingested data. If you want to learn more about this process, or parse your metrics using a custom Datatype rule, refer to Shape Data with Datatype Rules.
Now, move to Data > Get Data In and select 3. Dataset Rules.
Select Add Dataset Rule.
Enter a Name for the rule, and in Kusto expression to match, enter an expression that will identify the data you want to capture in this Dataset.
To catch the data being sent by the built-in Cribl HTTP Source in Search, use
__inputId = "cribl_http:in_cribl_http".In Send data to, select
Datasetand choose your new Dataset in the Dataset dropdown.You can shape the incoming metrics at the Dataset level by enabling Modify Fields. See Modify Fields in Dataset Rules for more information.
Save the new rule by selecting Add, and confirm with Save again.
At this point the metrics from your GPU in Cribl Edge should be flowing into the new Dataset. Wait a short while, and the charts next to Dataset Rules will show the change.
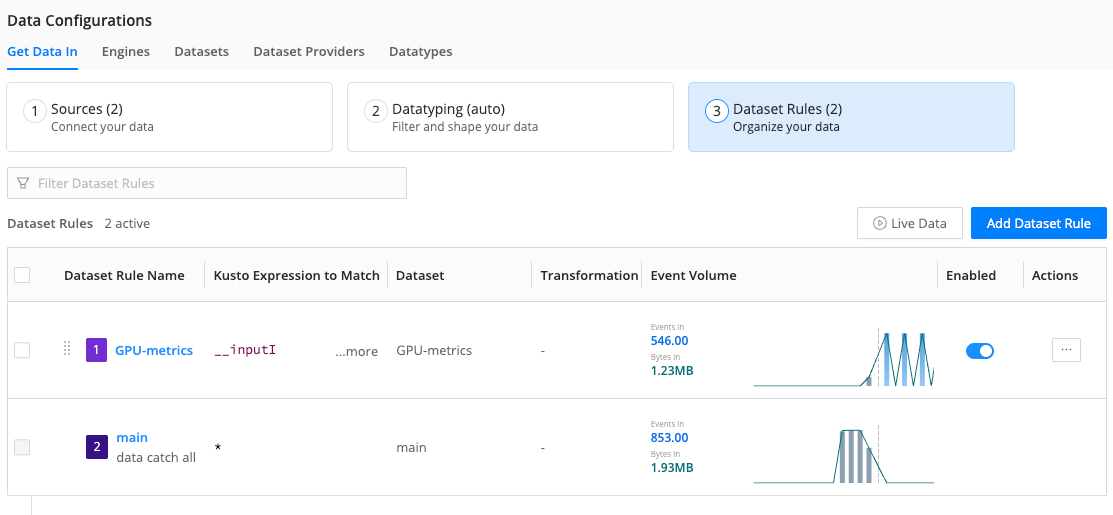
To verify data flow, you can select Live Data to preview the metrics being captured.
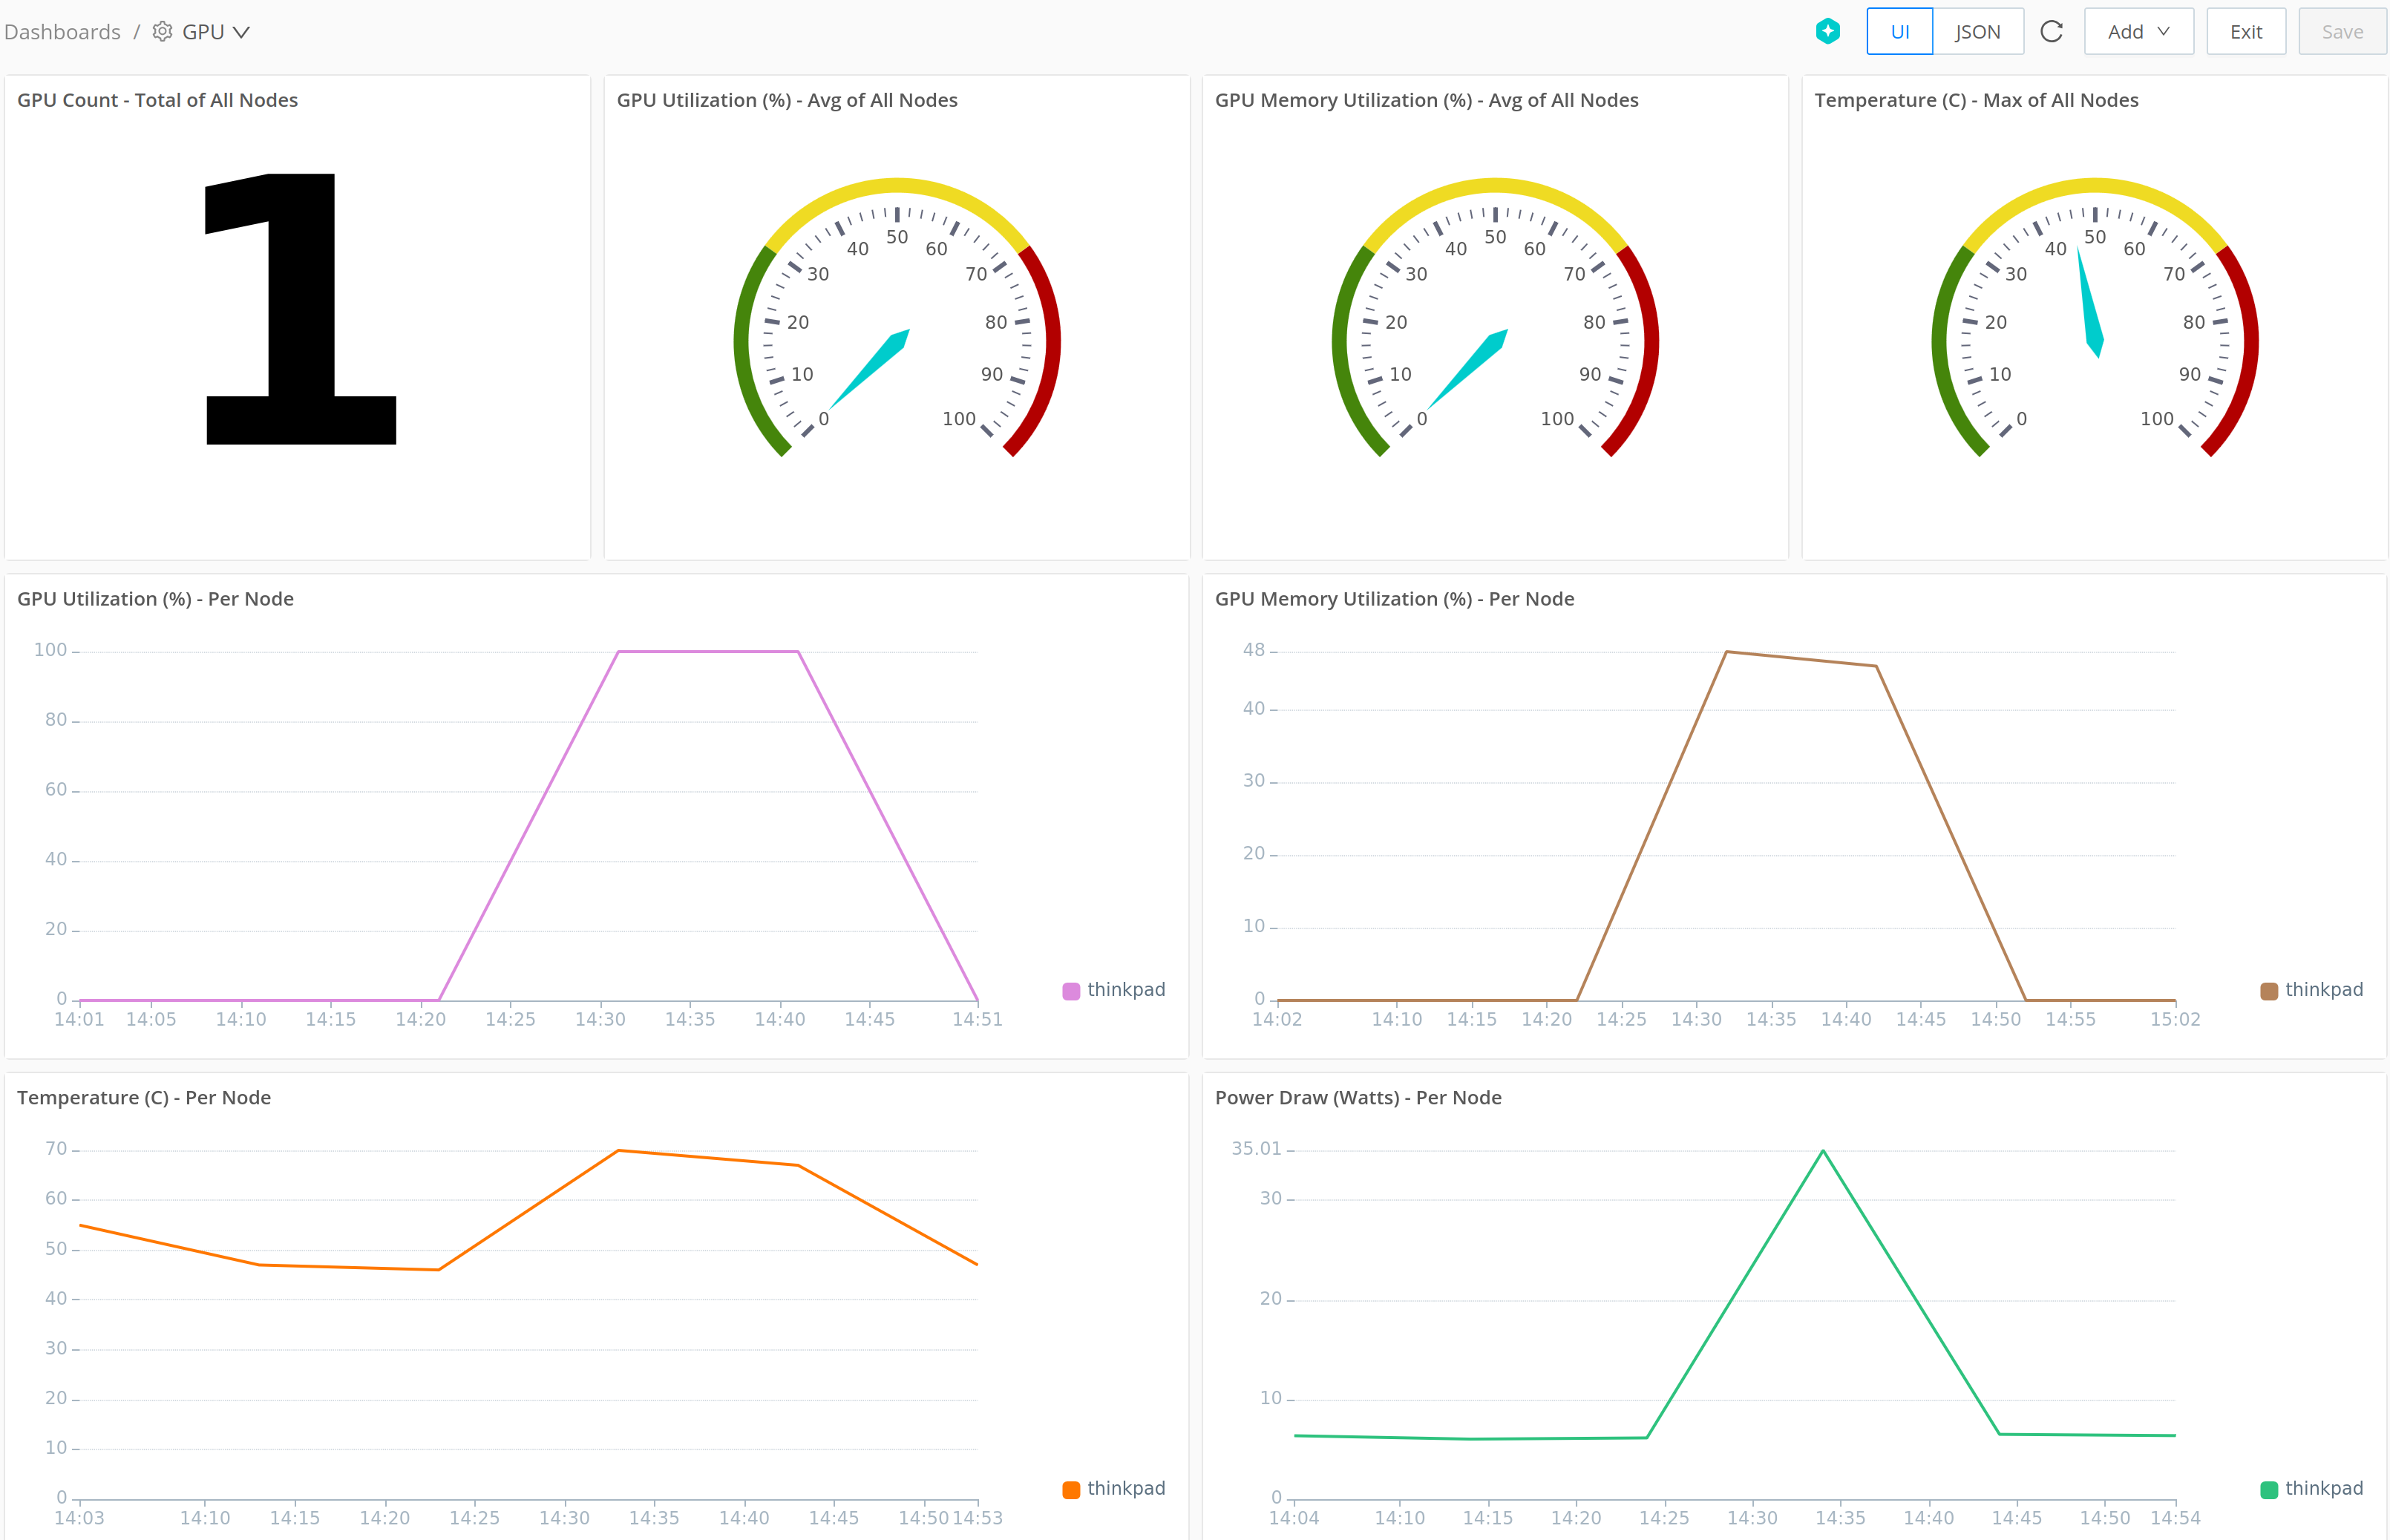
Create a Dashboard and Add Charts
Now that the GPU metrics are being stored in a Search Dataset, you can create a dashboard to visualize them. See Charts for chart types and options.
In Cribl Search, open Dashboards from the sidebar, then select Add Dashboard.
Enter a Name and optional Description, then select Save.
Select Add > Visualization.
To define a panel, choose New Search, enter a query, and select Search
Pick a chart type, then save the panel.
See Create a Dashboard and Edit a Dashboard for details about visualizations.
Example queries (replace GPU-metrics with your Dataset ID):
- GPU count:
dataset="GPU-metrics" node_gpu_count*
| summarize gpu_per_host = max(node_gpu_count) by host
| summarize current_total_gpu_count = sum(gpu_per_host)- Average GPU utilization for all nodes:
dataset="GPU-metrics"
| summarize latest_gpu_util=findlatest (node_gpu_utilization_gpu_percent_all) by host
| summarize avg_latest_gpu_util=avg(latest_gpu_util)- Maximum temperature for all nodes:
dataset="GPU-metrics"
| summarize latest_temperature=findlatest(node_gpu_temperature_celsius_all) by host
| summarize avg_latest_temperature=max(latest_temperature)- Percentage of GPU utilization per node:
dataset="GPU-metrics"
| timestats span=10m temp=max(node_gpu_utilization_gpu_percent_all) by host- Power draw (in watts) per node:
dataset="GPU-metrics"
| timestats span=10m temp=max(node_gpu_power_draw_watts_all) by host