


Explore Cribl Edge
Explore the Cribl Edge UI.
The Cribl Edge UI offers a centralized view to manage, configure, and version-control your Edge Nodes. It also lets you teleport to individual Nodes to locally preview and validate your configurations. Here’s a tour of the Cribl Edge UI in Distributed mode.
The available UI options might differ depending on your deployment type (Cribl.Cloud versus on-prem) and the platform the Edge Node is installed on (Linux versus macOS versus Windows).
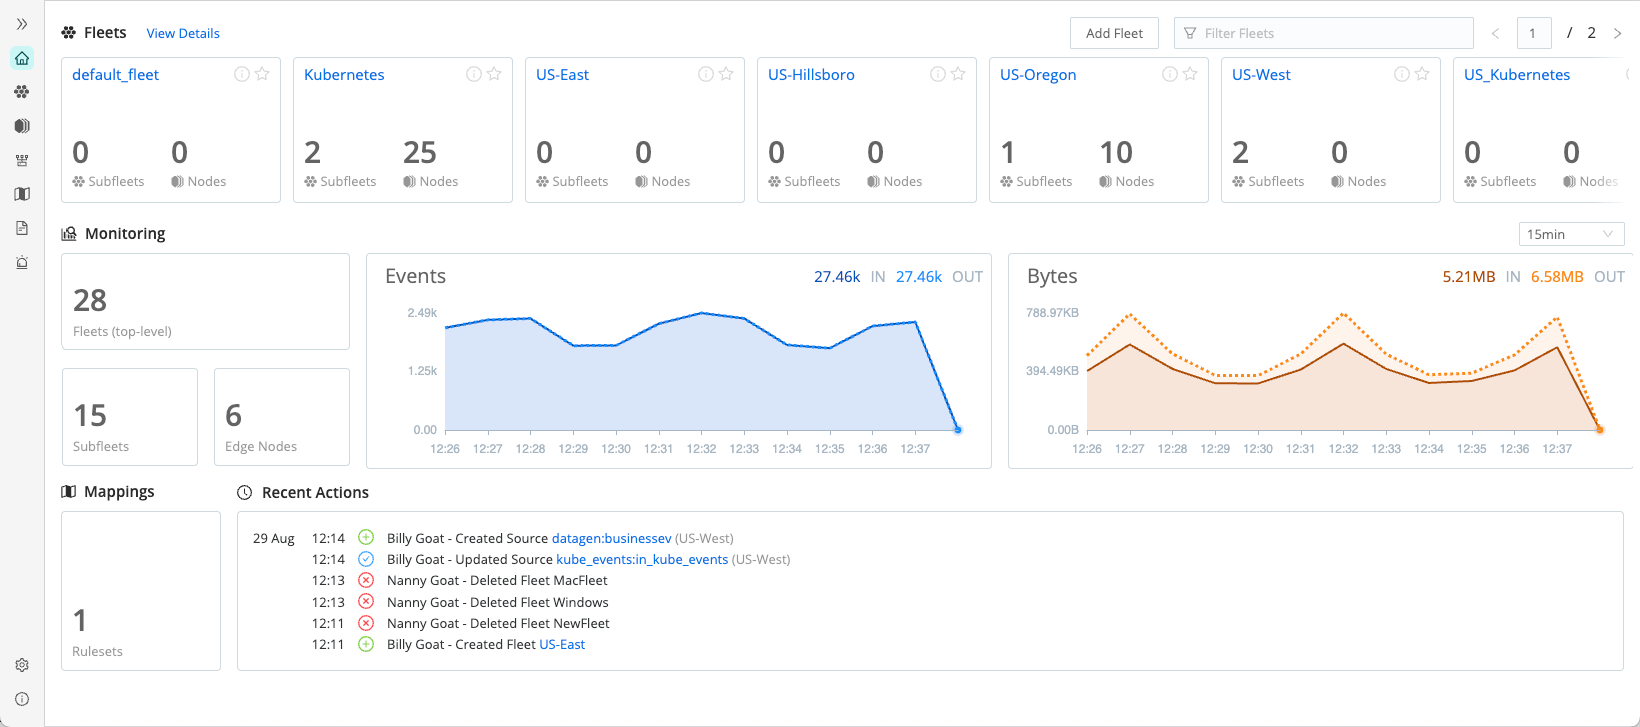
Edge Home
When you first log into Cribl Edge you’ll land on the Edge Home page. This page gives you an overview of configured Fleets, monitoring information for Fleets, Subfleets, Edge Nodes, and Events and Bytes in and out. At the bottom, you’ll see Recent Actions that users have taken in the environment as well as any configured Fleet Mappings.
Fleets
Select Fleets from the sidebar to access your configured Fleets.
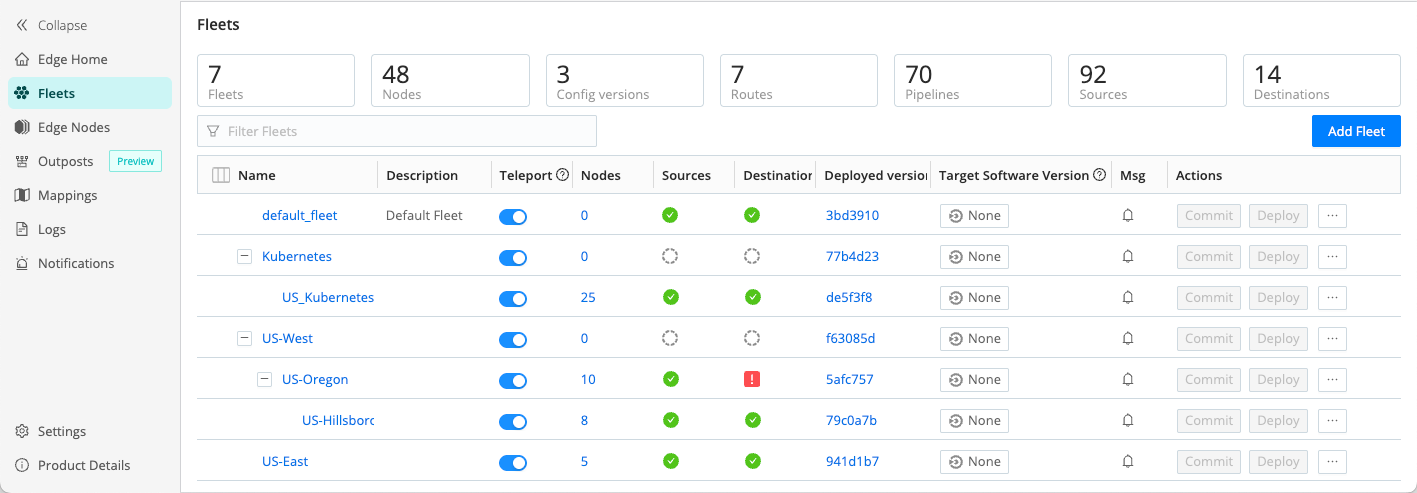
From here, you can select a Fleet name to isolate individual Fleets, or use the filter bar to locate your Fleet.
- For more information about the Fleets interface, see Fleets.
- To learn about creating Fleets, see Creating and Managing Fleets and Subfleets.
Edge Nodes
Select Edge Nodes to view all of your Edge Nodes in one list.
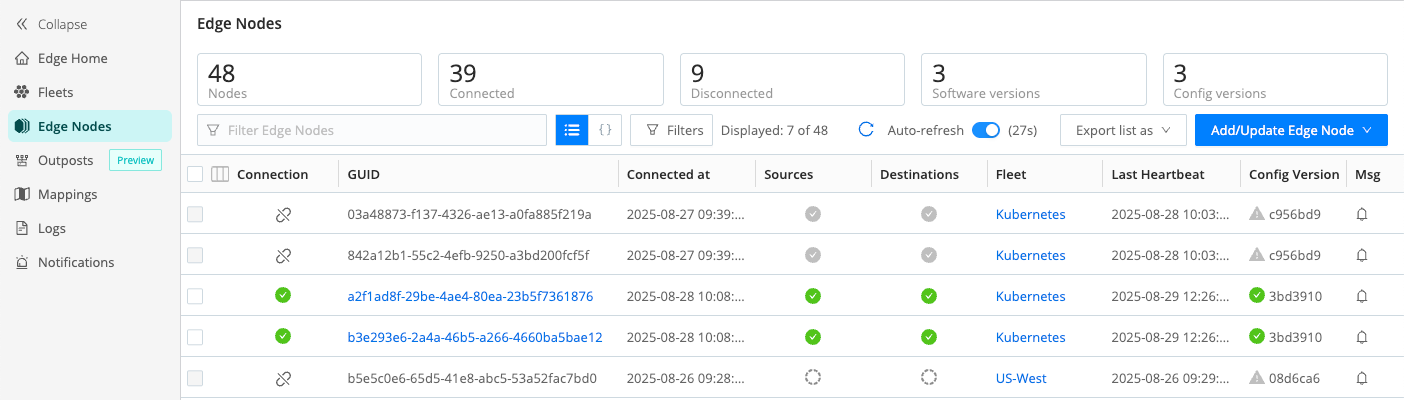
The list provides status information for each Edge Node in the selected Fleet, lets you filter Edge Nodes, add, and update Nodes. For more information, see Manage Edge Nodes.
Outposts
Select Outposts to view the list of configured Outposts, add and manage them. For more information, see Connect Through Cribl Outpost.
Mappings
You can use Mappings Rulesets to map Edge Nodes to Fleets by defining rules. For more information, see Mapping Edge Nodes to Fleets.
Logs
Cribl Edge generates internal application logs that monitor its own operations and health. They provide valuable insights into the system’s behavior, performance, and potential issues. For more information, see Internal Logs.
Notifications
Notifications alert Cribl Edge admins about issues that require their immediate attention. For information on types of Notifications, Notification targets, and managing Notifications, see Managing Notifications.
Explore Tab
The Explore tab lets you get details about a particular Edge Node.
For more details about the information you can find in the Explore tab, see Explore Cribl Edge Nodes.