


Getting Started Tutorial
Learn basic Cribl Edge functionalities.
This tutorial walks you through basic Cribl Edge functionalities, showing you how to capture sample data and send it to Cribl Stream.
To complete this tutorial you’ll need two instances: one running Cribl Edge, and one distributed Cribl Stream. If you do not have any yet, refer to Getting Started Guide for the former, and Stream’s Distributed Quick Start for the latter.
You do not need connections to any external services, and a free Cribl license will be enough to go through all the steps.
Add the File Monitor Source
Each Cribl Edge Source represents a data input. Options include System Metrics, File Monitor, Kubernetes Metrics, Logs, and Events, as well as Prometheus Edge Scraper, and others.
For this tutorial, we’ll use the File Monitor Source which generates events from text files or log files.
In Cribl Edge, select Manage > Collect. You can use the QuickConnect screen to configure how data flows between Sources and Destinations.
If you’re on Cribl.Cloud or any other Distributed mode, first select the
default_fleetin its tile to select it.From the list of Sources, expand the File Monitor tile and select Configure for in_file_varlog.

QuickConnect UI with the built-in File Monitor Sources. When set to a Manual discovery mode, the Search path field in File Monitor specifies the path that the Source should look through to discover files. in_file_varlog contains the
/var/log/path, which works for this tutorial.
The default settings for the Source are good enough for this tutorial. Exit the modal. Now let’s activate the Source.
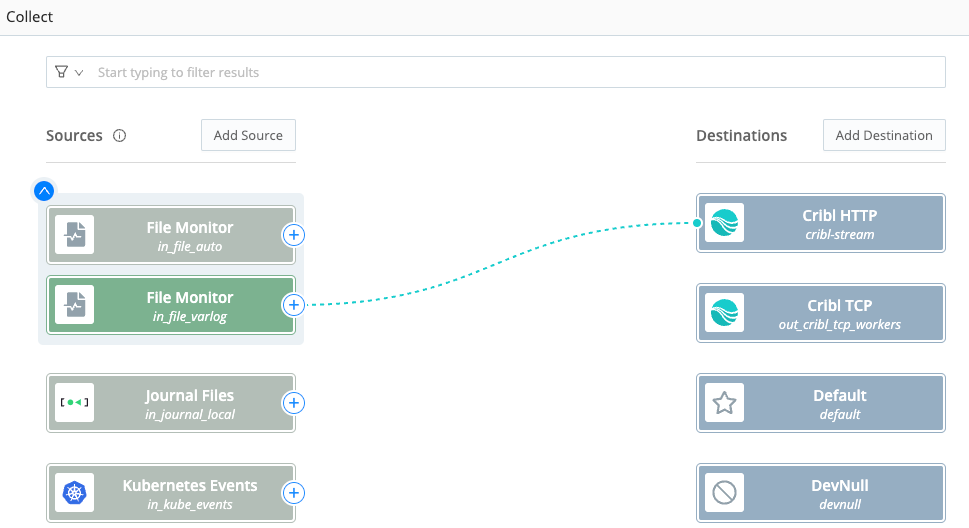
In the QuickConnect screen, drag the + icon from the File Monitor tile to the DevNull Destination on the right.
In the Connection Configuration modal, select Passthru. This indicates that the data should pass through without any modification.

QuickConnect UI with a new connection between File Monitor and DevNull. Select Save.
If you’re on Cribl.Cloud or any other Distributed mode, select Commit before proceeding. Then, in the resulting dialog, type a commit message (for example, “Added Source”) and select Commit and Deploy to confirm. You’ll see a Commit successful message.
Now select Capture in the FileMonitor Source to go to the Live Data tab. You’ll see data flowing from the Source.
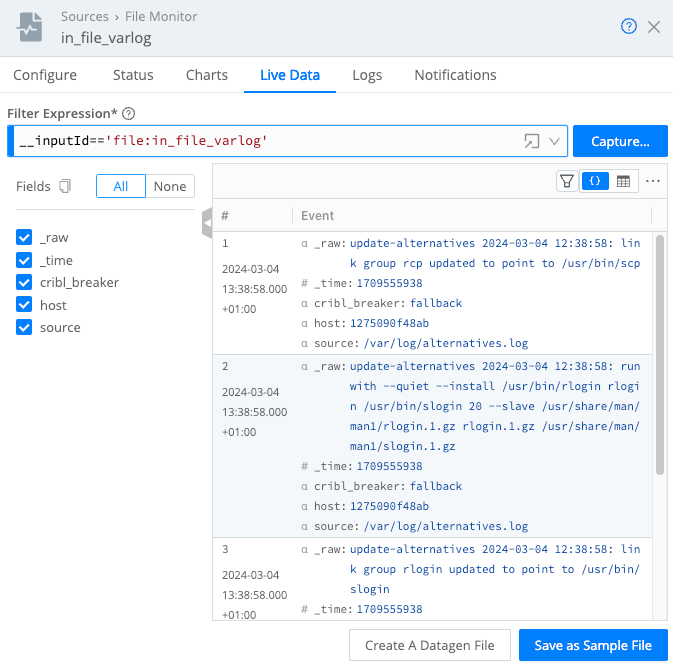
Hover over the DevNull Destination to see a shortcut menu. You can select Capture to jump to a preview of data flowing into this Destination.
If you do not see any events, the reason may be that no file changes were registered in this period. In that case you can select Capture… and increase the Capture Time (sec) value to extend the time window for catching events, then confirm with Save.
Add a Cribl HTTP Destination
Each Cribl Edge Destination represents a data output. Options include Cribl HTTP, Cribl TCP, Kafka, Kinesis, InfluxDB, Grafana Cloud, TCP JSON, Splunk, and others.
So far you’ve temporarily used the DevNull Destination. Now, let’s set up an actual Destination where you’ll sent the data to a separate Cribl Stream instance.
We’ll use the Cribl HTTP Destination, which enables sending data between different Nodes, and connect it to the Cribl HTTP Source in Stream to receive the data.
From Cribl Edge’s top menu, select More > Destinations.
If you’re on Cribl.Cloud or any other Distributed mode, first select the
default_fleetin its tile.From the Manage Destinations page’s tiles or left menu, select Cribl HTTP. (You can use the search box to jump to the Cribl HTTP tile.)
Select Add Destination to enter a New Destination modal.
Provide your Destination’s Output ID (for example,
cribl-stream).In Cribl Worker endpoints you will provide the endpoint of the Cribl Stream instance you want to send the data to.
Provide the address for your Cribl Stream instance appended with the
10200port, for example:http://localhost:10200/.
Cribl HTTP Destination modal with endpoint configured. Confirm with Save.
If you’re on Cribl.Cloud or any other Distributed mode, select Commit at Cribl Edge’s upper right before proceeding. Then, in the resulting dialog, type a commit message (for example, “Added Destination”) and select Commit and Deploy to confirm. You’ll see a Commit successful message.
Receive Data
Now your Cribl Edge is ready to send the data, but Stream is not yet configured to accept it. Let’s quickly jump to it to finish the preparations.
- Access your Cribl Stream’s UI, and select the
default(or any other) Worker Group. - In the top menu, select Data > Sources.
- Search for Cribl HTTP and select it. You will see a built-in
in_cribl_httpSource that may be disabled by default.
If you cannot find the Cribl HTTP Source, it means your Stream is working in a single-instance mode.
In the Source’s configuration modal, make sure that the Address Field points to
0.0.0.0, which is a catch-all for all addresses, and that Port is the same you configured for the Destination in Edge (using the example above,10200).
This Source will pick up events sent by Cribl Edge. Enable the Source and exit the modal.
Select Commit at Cribl Stream’s upper right. In the resulting dialog, type a commit message and select Commit and Deploy to confirm. You’ll see a Commit successful message.
Go back to your Cribl Edge UI and on the Collect screen switch File Monitor to send to Cribl HTTP instead of DevNull
If you’re on Cribl.Cloud or any other Distributed mode, select Commit at Cribl Edge’s upper right before proceeding. Then, in the resulting dialog, type a commit message (for example, “Added Destination”) and select Commit and Deploy to confirm. You’ll see a Commit successful message.
Wait a few moments for the data to start flowing, and then in Cribl Stream select the in_cribl_http Source’s Live button.
After a few seconds you should see a sample of data flowing into Cribl Stream
from your Edge instance’s File Monitor.
The data you are receiving is now ready for further reduction and transformation using Cribl Stream’s Routes, Pipelines and Function. To get a short introduction to Stream’s capabilities in working with data, you can refer to its Getting Started Guide.
Summary
In this short tutorial - with no hit to your cloud-services charges - you’ve built a simple but complete Cribl Edge instance, exercising all of its basic components:
- Configured a Source to monitor files in selected disk location.
- Configured a Destination to send data to a Stream instance.
- Configured Stream to receive data from Edge.
Cleaning Up
You can finish up the tutorial by cleaning up after yourself. You’ve still got the Cribl Edge server running, with files still being monitored. If you’d like to shut it down for now, in reverse order:
- Go to Manage > More > Sources > File Monitor.
- Toggle in_file_varlog off.
- In your terminal’s
$CRIBL_HOME/bindirectory, shut down the server with:./cribl stop
Next Steps
Interested in guided walk-throughs of more-advanced Cribl Edge features? We suggest that you next check out these further resources.
- Cribl Edge Sandbox: Work through general and specific scenarios in a free, hosted environment, with terminal access and real data inputs and outputs.
- Explore Cribl Edge: Learn more about the various capabilities of Cribl Edge by taking a tour through its UI.
That’s it! Enjoy using Cribl Edge.