


Manage Metrics and High Cardinality
Cribl Edge provides a streamlined workflow for managing metrics and metric events, especially to reduce high-cardinality data (datasets with a large number of uncommon or unique values).
As you build your Pipeline, you can:
- Preview and analyze your metrics in Data Preview: When you add sample data in your Pipeline, the Data Preview pane automatically switches to Metrics View, a metrics-first view designed specifically for viewing and analyzing metrics data. It provides summary statistics and visualizations to help you identify high-cardinality data and similar inefficiencies. This enables you to make informed decisions about data processing before forwarding it to downstream receivers, which can potentially reduce storage costs and improve query performance.
- Automatically build a Pipeline to process metrics: As you inspect metrics in Metrics View, you can select the specific metrics or dimensions you want to aggregate or drop. The interface automatically adds Functions to your Pipeline with an initial configuration based on your selection.
This workflow covers a variety of use cases for managing metrics:
- Reduce high-cardinality data: Consolidate, aggregate, or drop metrics or dimensions with a large number of unique or uncommon values to reduce time series, simplify data, and improve query performance.
- Optimize metrics: Group and segment similar metrics into fewer categories to reduce complexity. Create time-based rollups by aggregating high-frequency metrics into larger intervals (such as hourly or daily). Combine related or duplicate metrics together to create a unified metric.
- Normalize metrics: Aggregate metrics collected from different systems into a single, unified view for easier analysis and consistent reporting.
Overview of Metrics Management Workflow
The workflow for using Cribl Edge to optimize metrics has three phases:
Add metrics to your Pipeline: Before you start analyzing and managing metrics data, you first need to get metrics data flowing into Cribl Edge. Then, you need to capture or import some sample data to validate your Pipeline as you build it.
Analyze metrics in Data Preview: With sample metrics data open in Metrics View in Data Preview, you can analyze the data to find metrics and dimensions that are possibly contributing to issues with high cardinality or large data volumes.
Manage metrics: Use the interface to drop and aggregate metrics or drop dimensions. Cribl Edge automates most of the configuration process. Select the metrics you want to aggregate or drop, and Cribl Edge will automatically add Functions to your Pipeline with an initial configuration based on your selection.
The following sections explain these three phases in more detail.
Add Metrics to Your Pipeline
Before you start analyzing and managing metrics data in Cribl Edge, you first need to get metrics data flowing:
Add a Source and Destination that can send and receive metrics data. See Integrations for instructions.
Add a new Pipeline or open an existing Pipeline. See Pipelines for instructions.
Add sample data or capture sample data that contains metrics. See Data Preview: Add Sample Data for instructions.
How Data Preview Works
Pipelines show a list of Functions and their configurations on the left and the Data Preview on the right. The Pipeline processes a set of sample metrics and passes them through Functions in the Pipeline. Then, the Pipeline displays the inbound and outbound results in the Data Preview pane. Whenever you modify, add, or remove a Function, the output in the Data Preview pane updates instantly to reflect your changes. See Data Preview for more information.
Because your data sample contains metric events, the Data Preview automatically switches to the Metrics view. It intelligently detects the underlying data structure and switches to this view to display relevant insights.
If your metrics data doesn’t show up in Metrics View, it may not be formatted as a supported metric. See Supported Metric Formats and Types for more information.
Analyze Metrics in Data Preview
With sample metrics data open in Metrics View in the Data Preview, you can analyze the data for insights about your metrics. This section explains a variety of strategies for using the Data Preview to find metrics and dimensions that are possibly contributing to downstream storage or processing costs. It also suggests possible solutions and how to implement those solutions in your Pipeline.
Increased downstream storage and processing costs typically have a few common causes:
- High-cardinality dimensions: Each combination of dimension values creates a unique time series. If your metrics data has a high number of dimensions with a high number of possible unique values, that means your data has a problem with high cardinality. It has too many possible unique combinations and values (time series). If a downstream vendor charges you by the number of time series in your data, your costs increase with each unique combination of dimensions and dimension values.
- High-frequency metrics: If an upstream sender is capturing data points too frequently, you can end up producing a high volume of data. If a downstream vendor charges you by the amount of data you send it, high volumes of metrics data can increase costs or slow down data querying.
- Low-value metrics: Not all metrics you produce might be meaningful or valuable to you. Dropping unnecessary metrics or dimensions can help reduce the volume of metrics data so that you only consume what you truly need downstream.
You can use the Metrics View to help detect these common problems in your metrics data.
Get an Overview of Your Metrics
The Data Preview has an IN and OUT tab so that you compare your incoming data with the changes to the outgoing data. It helps to test and validate the Functions you add to your Pipeline to verify that the data changes applied by the Pipeline match your expectations.
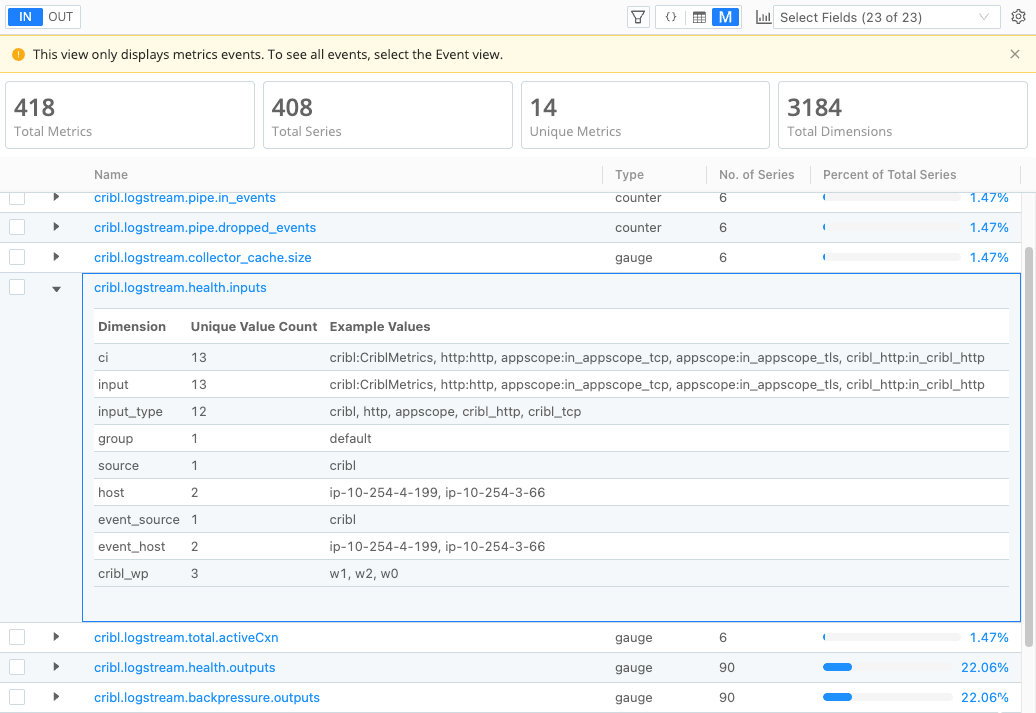
When you first look at the Metrics View, the charts at the top provide high-level summary statistics to help you understand the structure of your metrics, including the total metrics, total time series, the number of unique metrics, and the number of unique dimensions. See Metrics View Reference for detailed descriptions of the Metric View charts and elements.
This screenshot shows an example of the summary statistics:
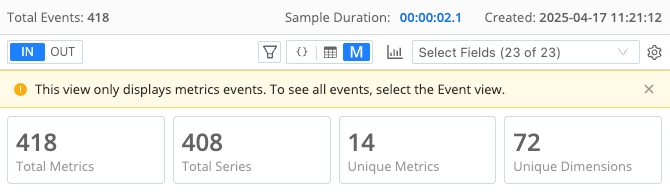
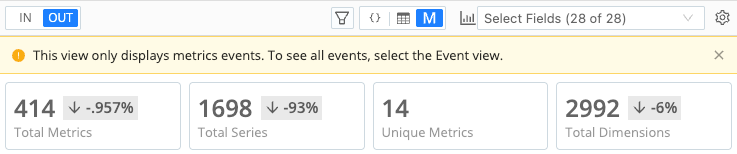
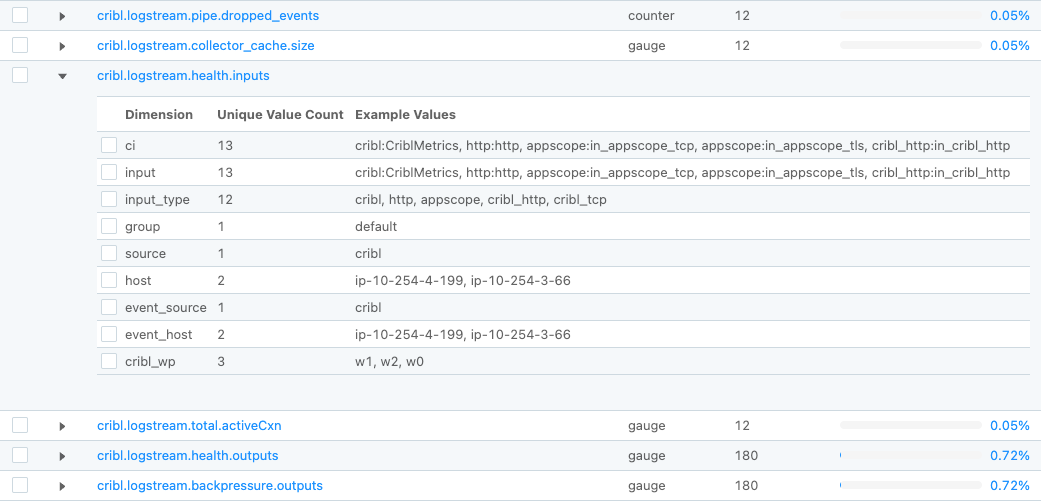
These high-level summaries are useful for before-and-after comparisons of your metrics. After you add Functions that drop or aggregate metrics or dimensions, these summaries display the differences.
This screenshot shows the same summary statistics on the OUT tab after applying metrics optimizations in the Pipeline:
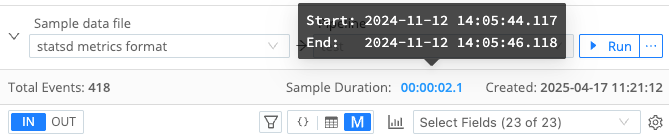
To help you evaluate the scope and accuracy of your sample metrics data, the Metrics View in Data Preview also provides a header bar that summarizes key details about the sample. This header bar includes details about the total events, creation date, and the duration of the sampled data. Hovering over the duration reveals the sample’s start and end times.
Inspect Time Series
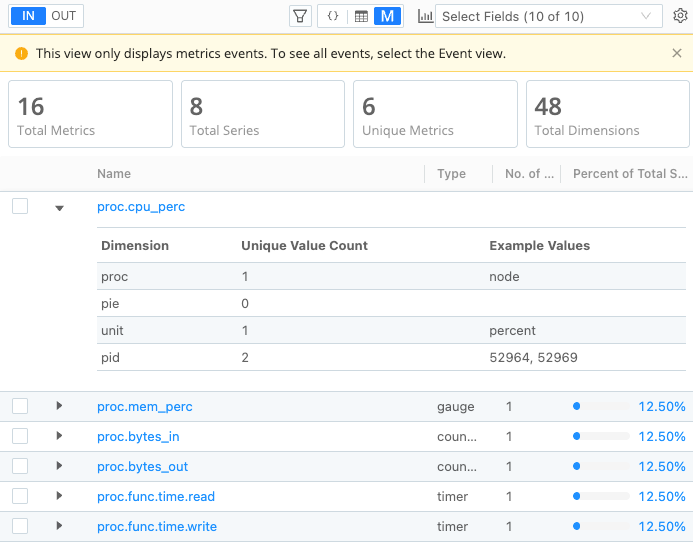
When you first look at the Metrics View, it displays a table listing each metric by name. In that initial view, pay attention to some of these key statistics and indicators for time series:
- No. of Series: This column lists the number of time series that this metric and its dimensions creates, calculated as the unique combination of a metric and a dimension pair. If a metric seems to have a high number listed in this column, that could mean it is contributing to high cardinality.
- Percent of Total Series: This column visually represents the proportion of time series represented by this metric, shown as a percentage of the total series. If a metric contributes a higher percentage to the overall total of time series, that could mean it is contributing to high cardinality.
For example, the following screenshot shows a list of metric names. In the list, the metric named cribl.logstream.health.inputs stands out because it has a high number of time series (24336) compared to the other metrics. It also represents a significant percentage of total series (97.27%). This metric is likely causing a high-cardinality problem.
Inspect Dimension Details
When you want to explore a metric in more detail, you can select the arrow next to the metric name to view its dimensions and the unique values for those dimensions. As you look at the dimension details, examine a few things:
- Are there dimensions with a high number of unique values?
- Do any of dimensions seem to be redundant or share duplicate values?
- As you compare the dimensions, do any seem similar enough that they could be combined together into a broader category or segment?
- Do any of the dimensions seem unnecessary or provide data that isn’t valuable for your purposes?
If you answer “yes” to any of these questions, those dimension might be a good candidate for taking action on them in your Pipeline.
To continue the previous example, in the detailed dimensions view for the metric named cribl.logstream.health.inputs, several dimensions appear to contain duplicate values:
ciandinputhostandevent_hostsourceandevent_source
Identify Possible Solutions
When you identify metrics or dimensions that contribute to high cardinality and/or high volume, or which don’t produce a lot of value for your purposes, you can:
- Drop Metrics: Drop unnecessary metrics to reduce data volume.
- Aggregate Metrics: Aggregate metrics to retain long-term trends while reducing the volume of detailed data, such as keeping averages or summaries only.
- Drop Dimensions: Drop unnecessary or redundant dimensions to minimize the number of unique dimension combinations and the number of time series.
- Aggregate dimensions, such as grouping them into broader categories or rolling them up into higher time frequencies.
Fortunately, Cribl Edge can build these operations into your Pipeline directly from the Metrics View interface, as explained in the next section.
Manage Metrics
Cribl Edge automates most of the configuration process for dropping and aggregating metrics. From the Data Preview, you can select the metric you want to aggregate, and Cribl Edge will automatically add Functions to your Pipeline with an initial configuration based on your selection.
Follow these best practices to troubleshoot common issues and ensure successful configuration when using the Metrics View interface:
- Troubleshoot metrics data not appearing in Metrics View: If your metrics data doesn’t show up in Metrics View, your date may not be in a supported metric format. See Supported Metric Formats and Types for more information.
- Find missing check boxes in Data Preview: If check boxes don’t appear next to your metrics data, you may not have added or opened a Pipeline yet. You must add or open a Pipeline to see check boxes.
- Confirm configuration settings: Always verify that the configuration settings are correct for your use case before saving.
- Add and manage multiple Functions: The interface adds a new Function every time you select metrics to drop or aggregate. Over time, this may lead to a large number of Functions in your Pipeline. To consolidate, you can delete the Functions, then re-add the metrics using the interface. You can also manually combine Functions together by copying and pasting configurations.
Drop Metrics
The Metrics View interface automatically adds a Drop Function to your Pipeline. It pre-configures the Filter field with the names of the metrics you select in Data Preview.
To drop metrics from inside the Data Preview:
Select the check box next to the names of one or more metrics you want to drop.
In the tray that appears under the metrics, select Drop Metrics.
Check the configuration settings for the Drop Function that now appear in your Pipeline. Optionally, add a Description or adjust the configuration settings as needed and select Save.
Test that you configured the Function correctly by comparing sample incoming data with outgoing data in the Data Preview pane and Pipeline Diagnostics tool. See Data Preview and Metrics View for more information.
Aggregate Metrics
The Metrics View interface automatically adds an Aggregate Metrics Function to your Pipeline. It pre-configures the configuration settings for the metrics you select in Data Preview.
To aggregate metrics from inside the Data Preview:
Select the check box next to the names of one or more metrics you want to drop.
In the tray that appears under the metrics, select Aggregate Metrics.
Check the configuration settings for the Aggregate Metrics Function that now appear in your Pipeline and select Save. Settings to check or adjust:
- Description: Review the generated description and adjust it to better reflect your use case.
- Final: Toggle on if this Function is the last Function in your Pipeline.
- Time window: Ensure the default duration of the tumbling window for aggregating events meets your needs.
- Aggregates: Confirm that the generated aggregation functions match your use case.
- Group by dimensions: Check the list of dimensions to group by for accuracy.
- Output Settings: Expand this section to reveal additional settings:
- Output prefix: If needed, use a prefix to modify the metric name, making it easier to identify and search for aggregated metrics. A prefix helps distinguish aggregated metrics from non-aggregated ones, allowing you to route or search for them more easily without increasing cardinality.
Check the Aggregate Metrics Function for more information about these settings and additional information about how this Function works.
Test that you configured the Function correctly by comparing sample incoming data with outgoing data in the Data Preview pane and Pipeline Diagnostics tool. See Data Preview and Metrics View for more information.
Drop Dimensions
The Metrics View interface automatically adds a Drop Dimensions Function to your Pipeline. It pre-configures the Filter field with the names of the dimensions you select in Data Preview. It also adds an initial description to the Description field based on your select.
To drop dimensions from inside the Data Preview:
Expand a metric to view its dimensions.
Select the check box next to the names of one or more dimensions you want to drop.
In the tray that appears under the metrics, select Drop Dimensions.
Check the configuration settings for the Drop Dimensions Function that now appear in your Pipeline. Optionally, edit the Description or adjust the configuration settings as needed and select Save.
Test that you configured the Function correctly by comparing sample incoming data with outgoing data in the Data Preview pane and Pipeline Diagnostics tool. See Data Preview and Metrics View for more information.
Supported Metric Formats and Types
Cribl Edge supports the following metric formats:
- Open Telemetry (OTLP)
- Prometheus
- StatsD
For Open Telemetry metrics, Cribl Edge does not ingest batches. To ingest data from batches, you must enable the Extract Metrics setting on your Open Telemetry Source. See OpenTelemetry (OTel) Source for more information.
When Cribl Edge ingests Open Telemetry metrics, it explodes the batches into individual metric events for processing. Cribl Edge can then create new batches from the processed metric data before sending to a downstream receiver.
Metrics View Reference
The Metrics view provides the following high-level summary statistics to help you understand the structure of your metrics event data:
- Total Metrics: The total number of metrics in the sample data. If a metric event contains multiple metrics, each one is counted separately.
- Total Series: The total number of time series in the metric event, where a time series represents a unique combination of a metric and a dimension pair.
- Unique Metrics: The total number of distinct metrics within the sample data.
- Unique Dimensions: The total number of dimensions across all metric events.
Beneath the summary, the Metrics view presents a table with the following columns:
- Name: The name of a unique metric.
- Type: The type of metric, such as a gauge, histogram, and more.
- No. of Series: The number of time series that this metric and its dimensions creates, calculated as the unique combination of a metric and a dimension pair.
- Percent of Total Series: The proportion of time series represented by this metric, shown as a percentage of the total series.
Each row represents a single metric, which you can expand to show its associated dimensions. The expanded view displays additional details:
- Dimension: The name of the dimension.
- Unique Value Count: The number of unique values for this dimension, also known as dimensionality.
- Example Values: The first five recorded values in the sample data, providing insight into typical values.