


Manage Edge Nodes
How to manage Edge Nodes in a Fleet and perform tasks like teleporting and exporting a list of Nodes.
View Edge Node Status Information
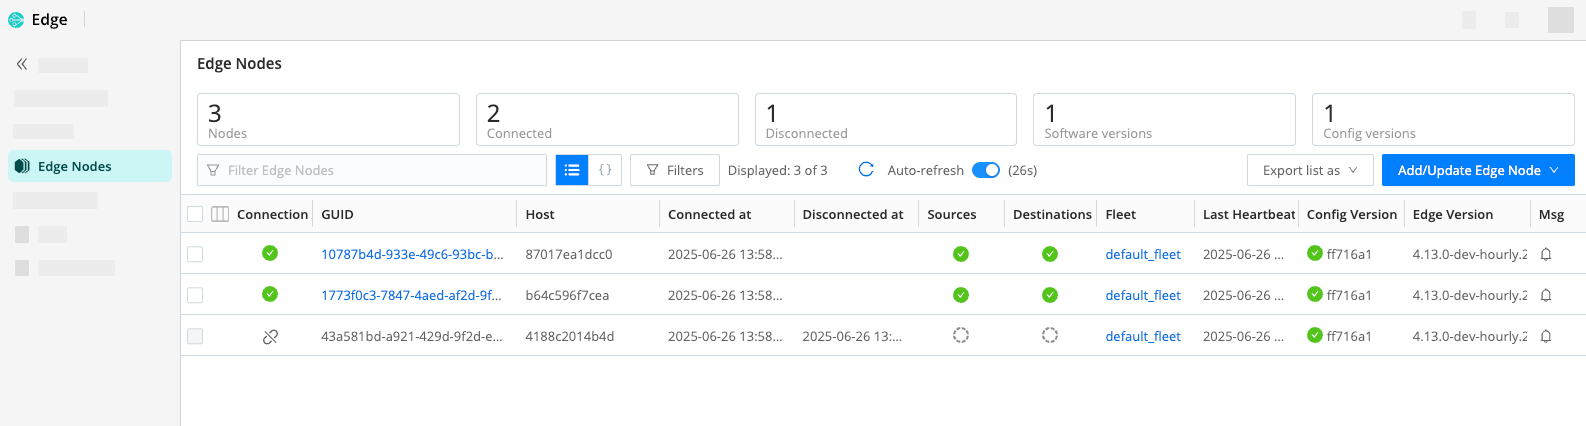
The Edge Nodes page provides status information for each Edge Node in the selected Fleet, as well as a UI for adding and updating Nodes.
In Cribl Edge, select Edge Nodes from the sidebar.
Monitor Edge Node Connectivity
You can track which Edge Nodes are connected to the Leader Node in the Edge Nodes page. Disconnected Edge Nodes show an icon in the Connection column and will have information about the time the Leader last received their heartbeat.
By default, Cribl Edge will retain information about disconnected Nodes between restarts. To change this behavior on-prem, toggle Disable Node persistence on in Global Settings > System > General Settings > Limits > Other. This will also affect Cribl Stream Workers.
Disable Node persistence is a deprecated setting that will be removed in a future version. Toggling Disable Node persistence will restart the Leader Node.
You can configure how long the Leader should keep track of disconnected Nodes by configuring the Time to keep disconnected Nodes Fleet setting (General Settings > Fleet Configuration). By default the Leader retains information about disconnected Nodes for one day. You can set it to any value between 0 (which means Nodes are removed within a few minutes) and 90 days.
For Fleets with Edge Nodes that frequently restart with a new GUID, such as those in a Kubernetes environment, Cribl recommends setting the Time to keep disconnected Nodes to 0.
The Time to keep disconnected Nodes setting is not inherited by Subfleets.
Monitor Connectivity of Older Edge Nodes
A Leader Node that is running version 4.13 or newer can monitor Edge Nodes that are using an older version. However, Cribl always recommends upgrading your Edge Nodes to the newest available version.
Monitor Source and Destination Health on Edge Nodes
You can monitor and track the health of Sources and Destinations associated with an Edge Node on the Edge Nodes page. This is useful when you have a large number of Nodes, and want to quickly identify and troubleshoot issues with Sources and Destinations.
To open the Node Info drawer and view specific monitoring information, select a health icon. For more information, see Track Data Activity for an Edge Node.
Filter Nodes in the List
You can filter the Edge Nodes that appear in the list using the Filters option. For details, see Filter Edge Nodes.
Find Edge Nodes Running in a Container
Edge Nodes running in a container report additional metadata about the container to the Leader. This helps you quickly identify which of your Edge Nodes are running in a container from the Leader UI and map them to the appropriate Fleets.
When Cribl Edge is running in a container, you will see the hostOs property in
events collected by the System State Source. This object
will contain properties about the container when they’re available, such as:
archcpu_countcpu_speed_mhzcpu_typeinterfacesmemoryplatformreleasehostnametimezone
From the Mappings menu,
you will also see the hostOs property in the Edge Node info panel.
This object will include the id, addresses, and version of the container when available.
interfacesis a set of key-value pairs that contain an array of CIDR values.
Export a List of Edge Nodes
To export the list of Edge Nodes, click the Export list as drop-down.
Select JSON or CSV as the export file format. If you filter the list
before exporting, the exported list will maintain that filter. You can export the
entire list by removing all filters.
Teleport into an Edge Node
Click the Edge Node GUID link to teleport from the Leader into the Edge Node. Here, you can explore the metrics and log data that the Node has discovered automatically, and can manually discover and explore other data of interest.
You can use the discovered data to perform root-cause analysis, to troubleshoot, and to restart the host. If you want to monitor and troubleshoot the Node data without teleporting, check out the Node Info Panel.
The page displays metadata for the Node, and below it, graphs of system activity. A magenta border indicates you are remotely viewing a host, and identifies the host’s name.
Click Restart Edge to restart the Node. To return to the Edge Nodes page, click the X close button on the upper right.
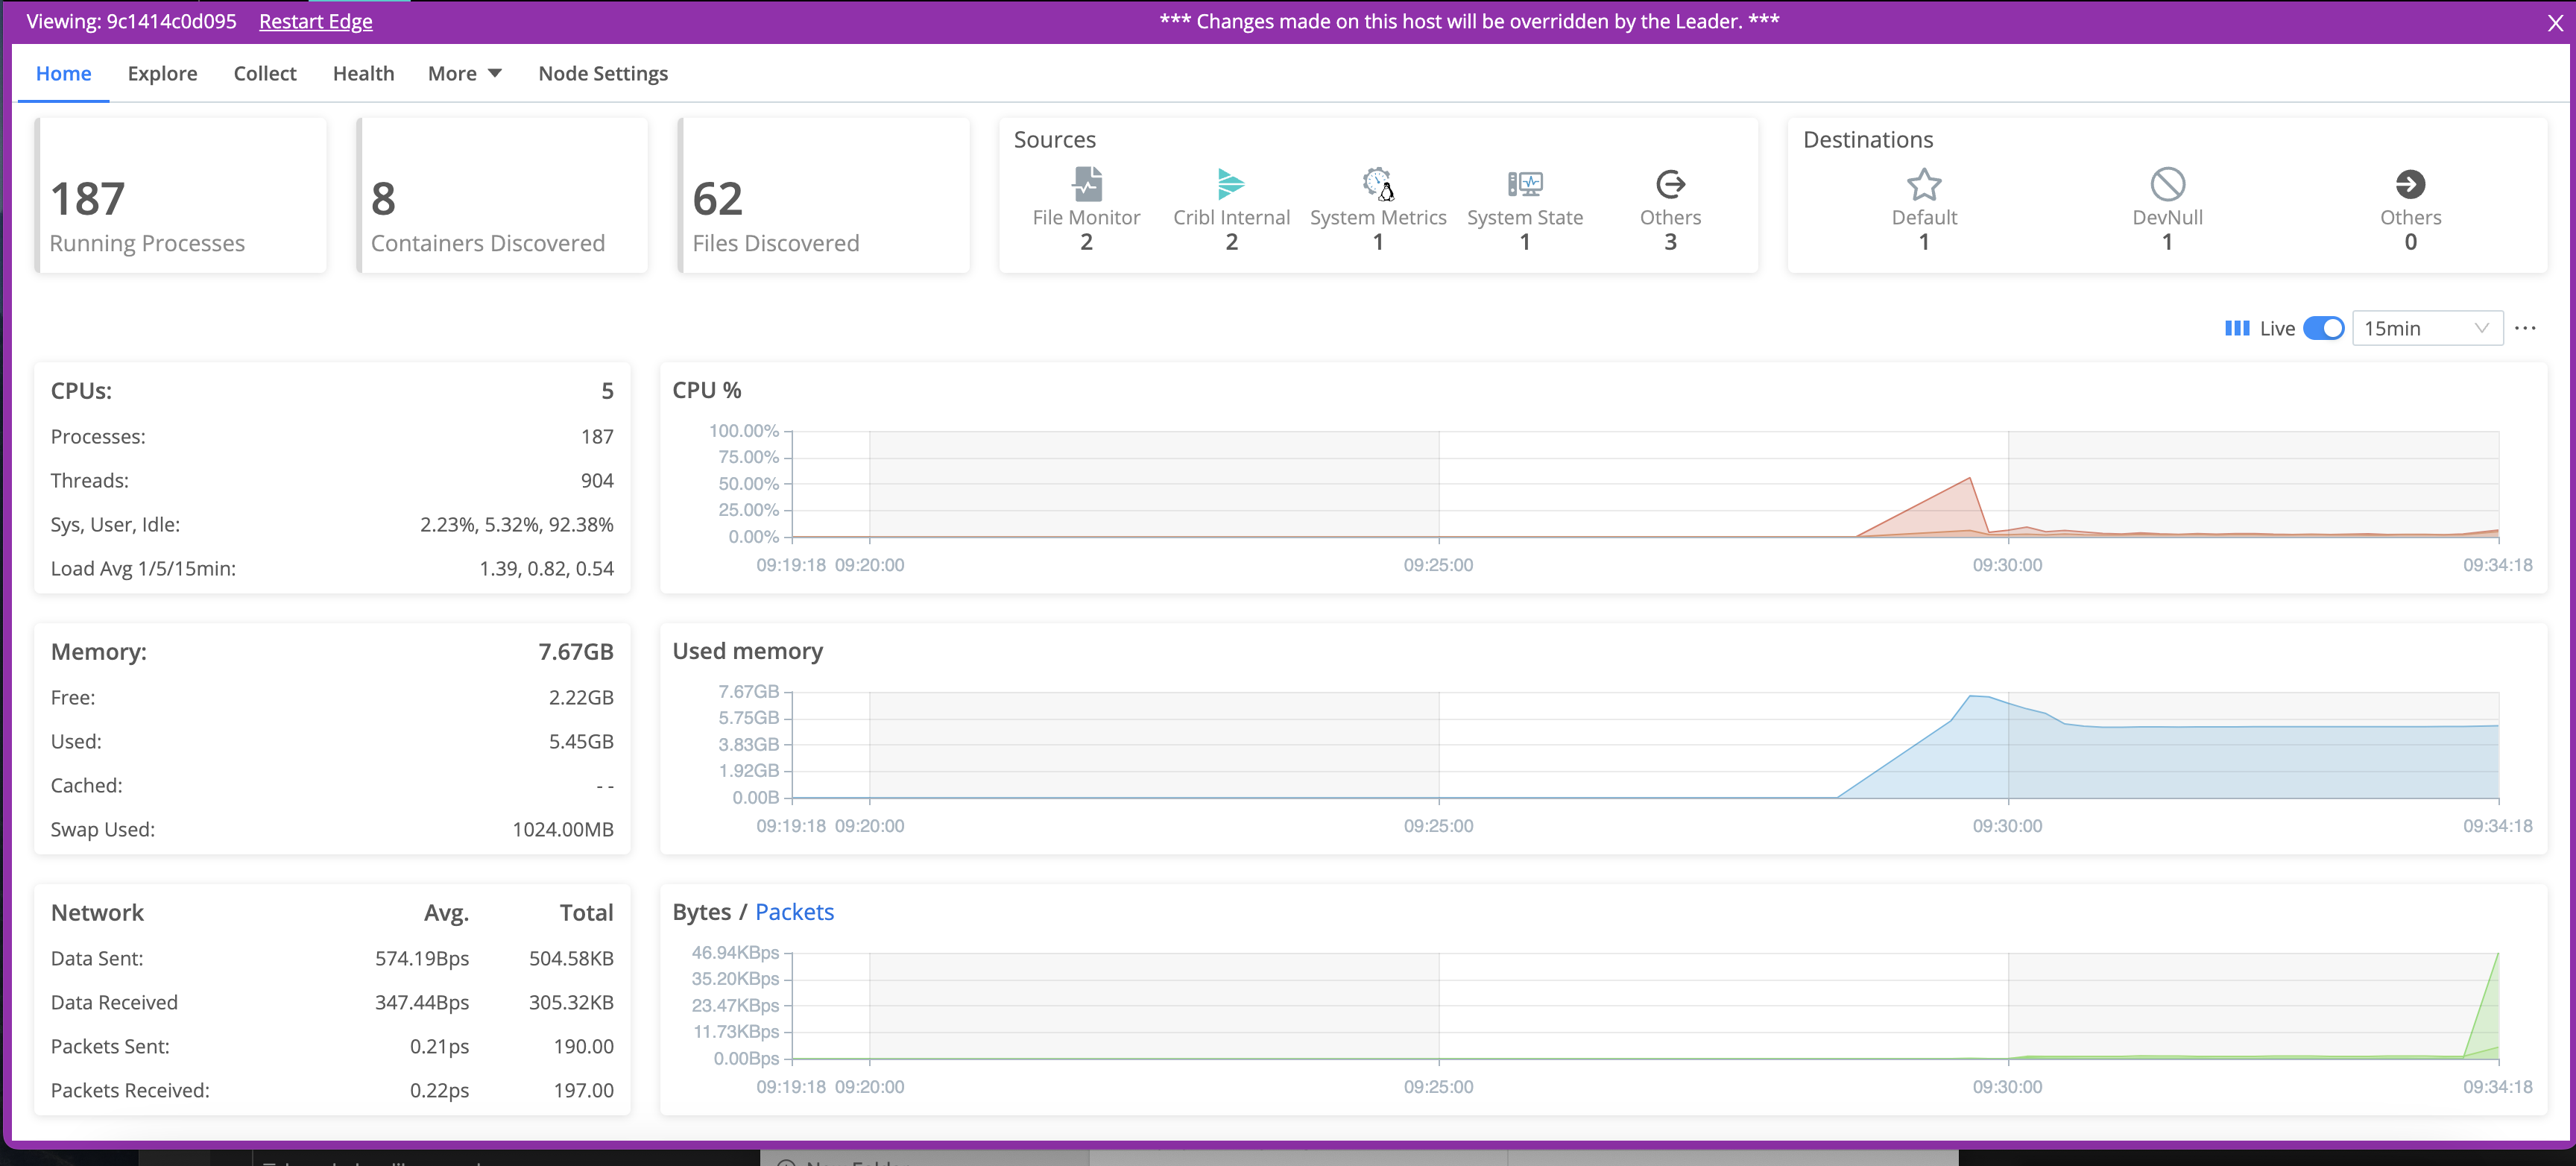
Changes that you make on an Edge Node will not propagate to the Leader. Also, the Leader will override any changes that you make directly on a Node.
Add Tags to Edge Nodes in Teleport View
You can add tags to an Edge Node you’ve teleported into. Tags help the Leader map an Edge Node to a Fleet. Note that changing the tags on a Node can cause the Leader to map the Node into a new Fleet.
- Teleport into an Edge Node.
- Navigate to Node Settings then Distributed Settings.
- Enter tags for this Node and select Save.
If your Edge Nodes are managed by Cribl.Cloud, you’ll need to accept the confirmation modal. Keep in mind that changing the tags on an Edge Node might cause it to be assigned to a different Fleet by the Leader.
You can’t change tags for Edge Nodes set up using the
CRIBL_DIST_MASTER_URLenvironment variable (instead of theinstance.ymlfile). This is because these types of Edge Nodes are typically temporary, so any tag changes would not be saved when the Edge Node restarts. If you need tags that persist, configure your Edge Nodes using theinstance.ymlfile.
Troubleshooting the Edge Node List
If you see unexpected results in the Edge Nodes list, keep in mind that:
- Edge Nodes that don’t maintain their connection to the Leader will eventually disappear from the Edge Nodes page.
- For a newly created Fleet, the Config Version column can show an indefinitely spinning progress spinner for that Fleet. This happens because the Edge Nodes are polling for a config bundle that hasn’t been deployed. To resolve this, click the Deploy option to force a deploy.
- For details on collocating multiple Cribl products, see Cribl Edge and Cribl Stream on the Same Host.
- For details on overriding default ports, see Overriding Default Ports.