


Monitor your Infrastructure with Cribl Edge
Monitor your infrastructure and visualize performance using Grafana.
Cribl Edge helps you monitor your sprawling infrastructure by collecting, processing, and forwarding data with low overhead cost and resources. Cribl Edge simplifies agent administration and data collection for your endpoints, and provides a number of charts, graphs, and alerts for the web when connected to supported data sources.
To enhance the performance of your environments, combine Cribl Edge with your data visualization tool of choice (this guide uses Grafana as an example). Now, you can identify and investigate issues and monitor applications faster than ever before.
Useful Metrics Dashboards
Cribl has configured a Prometheus dashboard to display system metrics, which is available in Grafana’s public library. This is a relatively simple dashboard, suitable for showing basic aggregate metrics.
Another useful dashboard for displaying Linux metrics is the Node Exporter Full dashboard, commonly used with Prometheus and its Node Exporter agent. This dashboard can handle highly detailed metrics.
To display Windows metrics, consider one of Grafana’s Windows dashboards.
Guide Overview
This setup guide will walk you through these configuration steps:
- Configure your Cribl Edge Sources. Depending on your endpoints, you can use the System Metrics Source for Linux, Windows Metrics, or Kubernetes Metrics.
- Configure the Grafana Cloud Destination to send data to Grafana Cloud.
- Access Grafana Cloud to see the metrics and visualizations.
Configure the System Metrics Source on Cribl Edge
In Cribl Edge, start by configuring and enabling the applicable Source for system metrics:
Decide what level of metrics detail you want to collect and display.
In the System Metrics Source and Windows Metrics Sources, go to the Host Metrics and Container Metrics tabs:
- For the relatively simple dashboard showing aggregate metrics, choose the Basic mode for most of your metrics.
- For the highly detailed metrics visualizations dashboard, choose the All mode for all of your metrics.
For the Kubernetes Metrics Source, use the Filter Rules to specify the Kubernetes objects that the Source should parse to generate metrics. If you specify no restrictive rules here, the Source will emit all events.
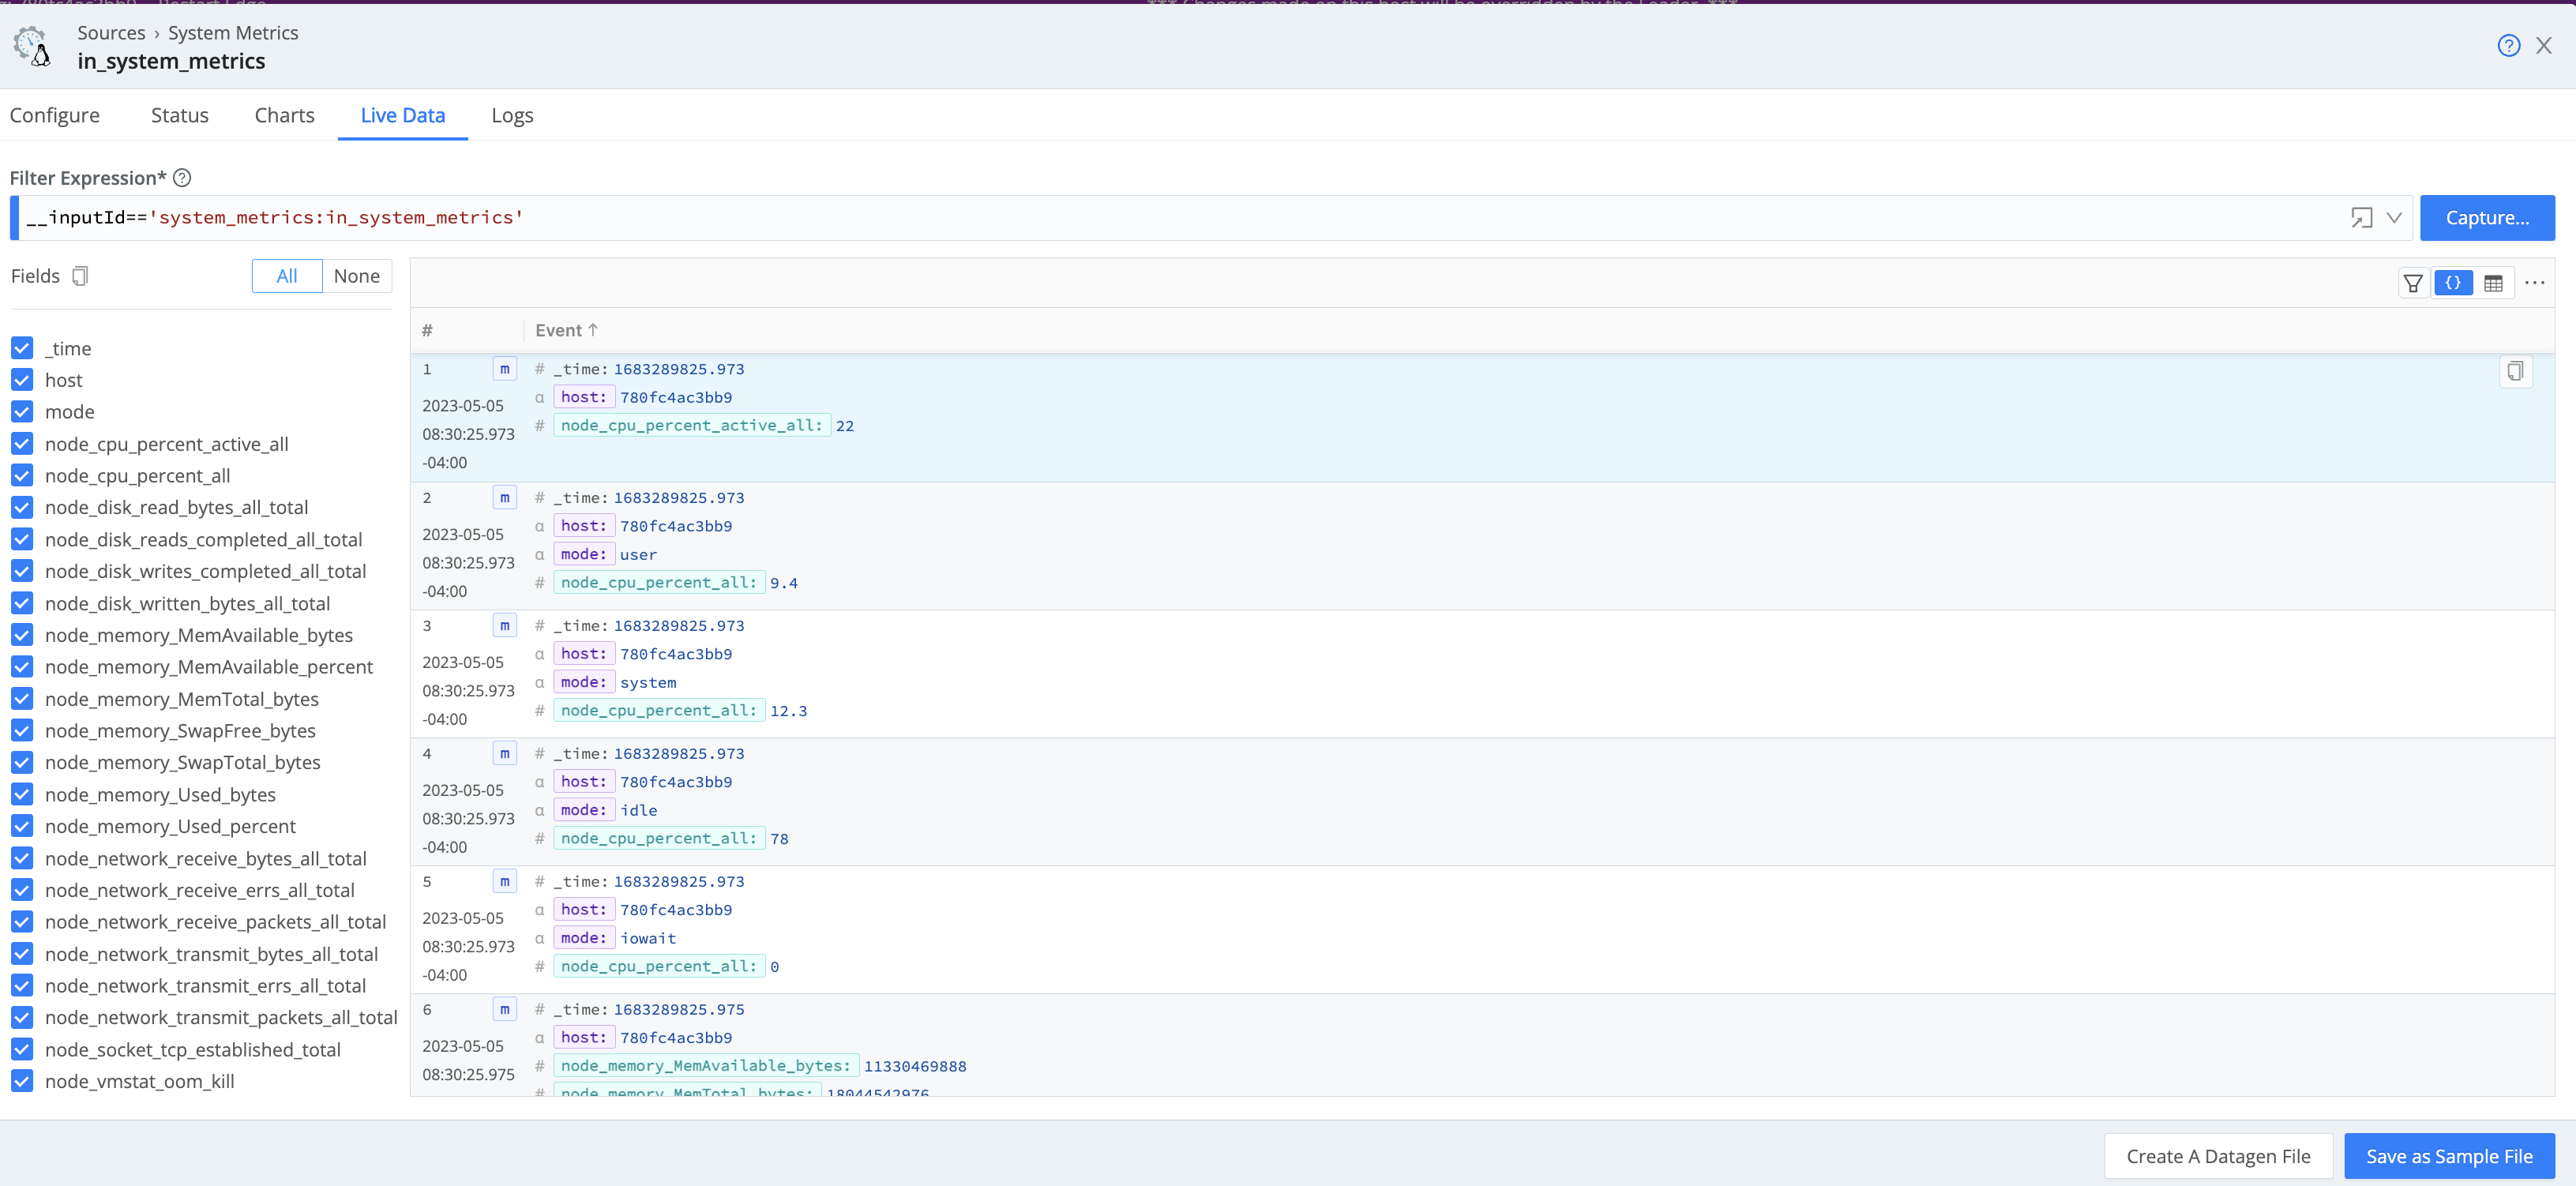
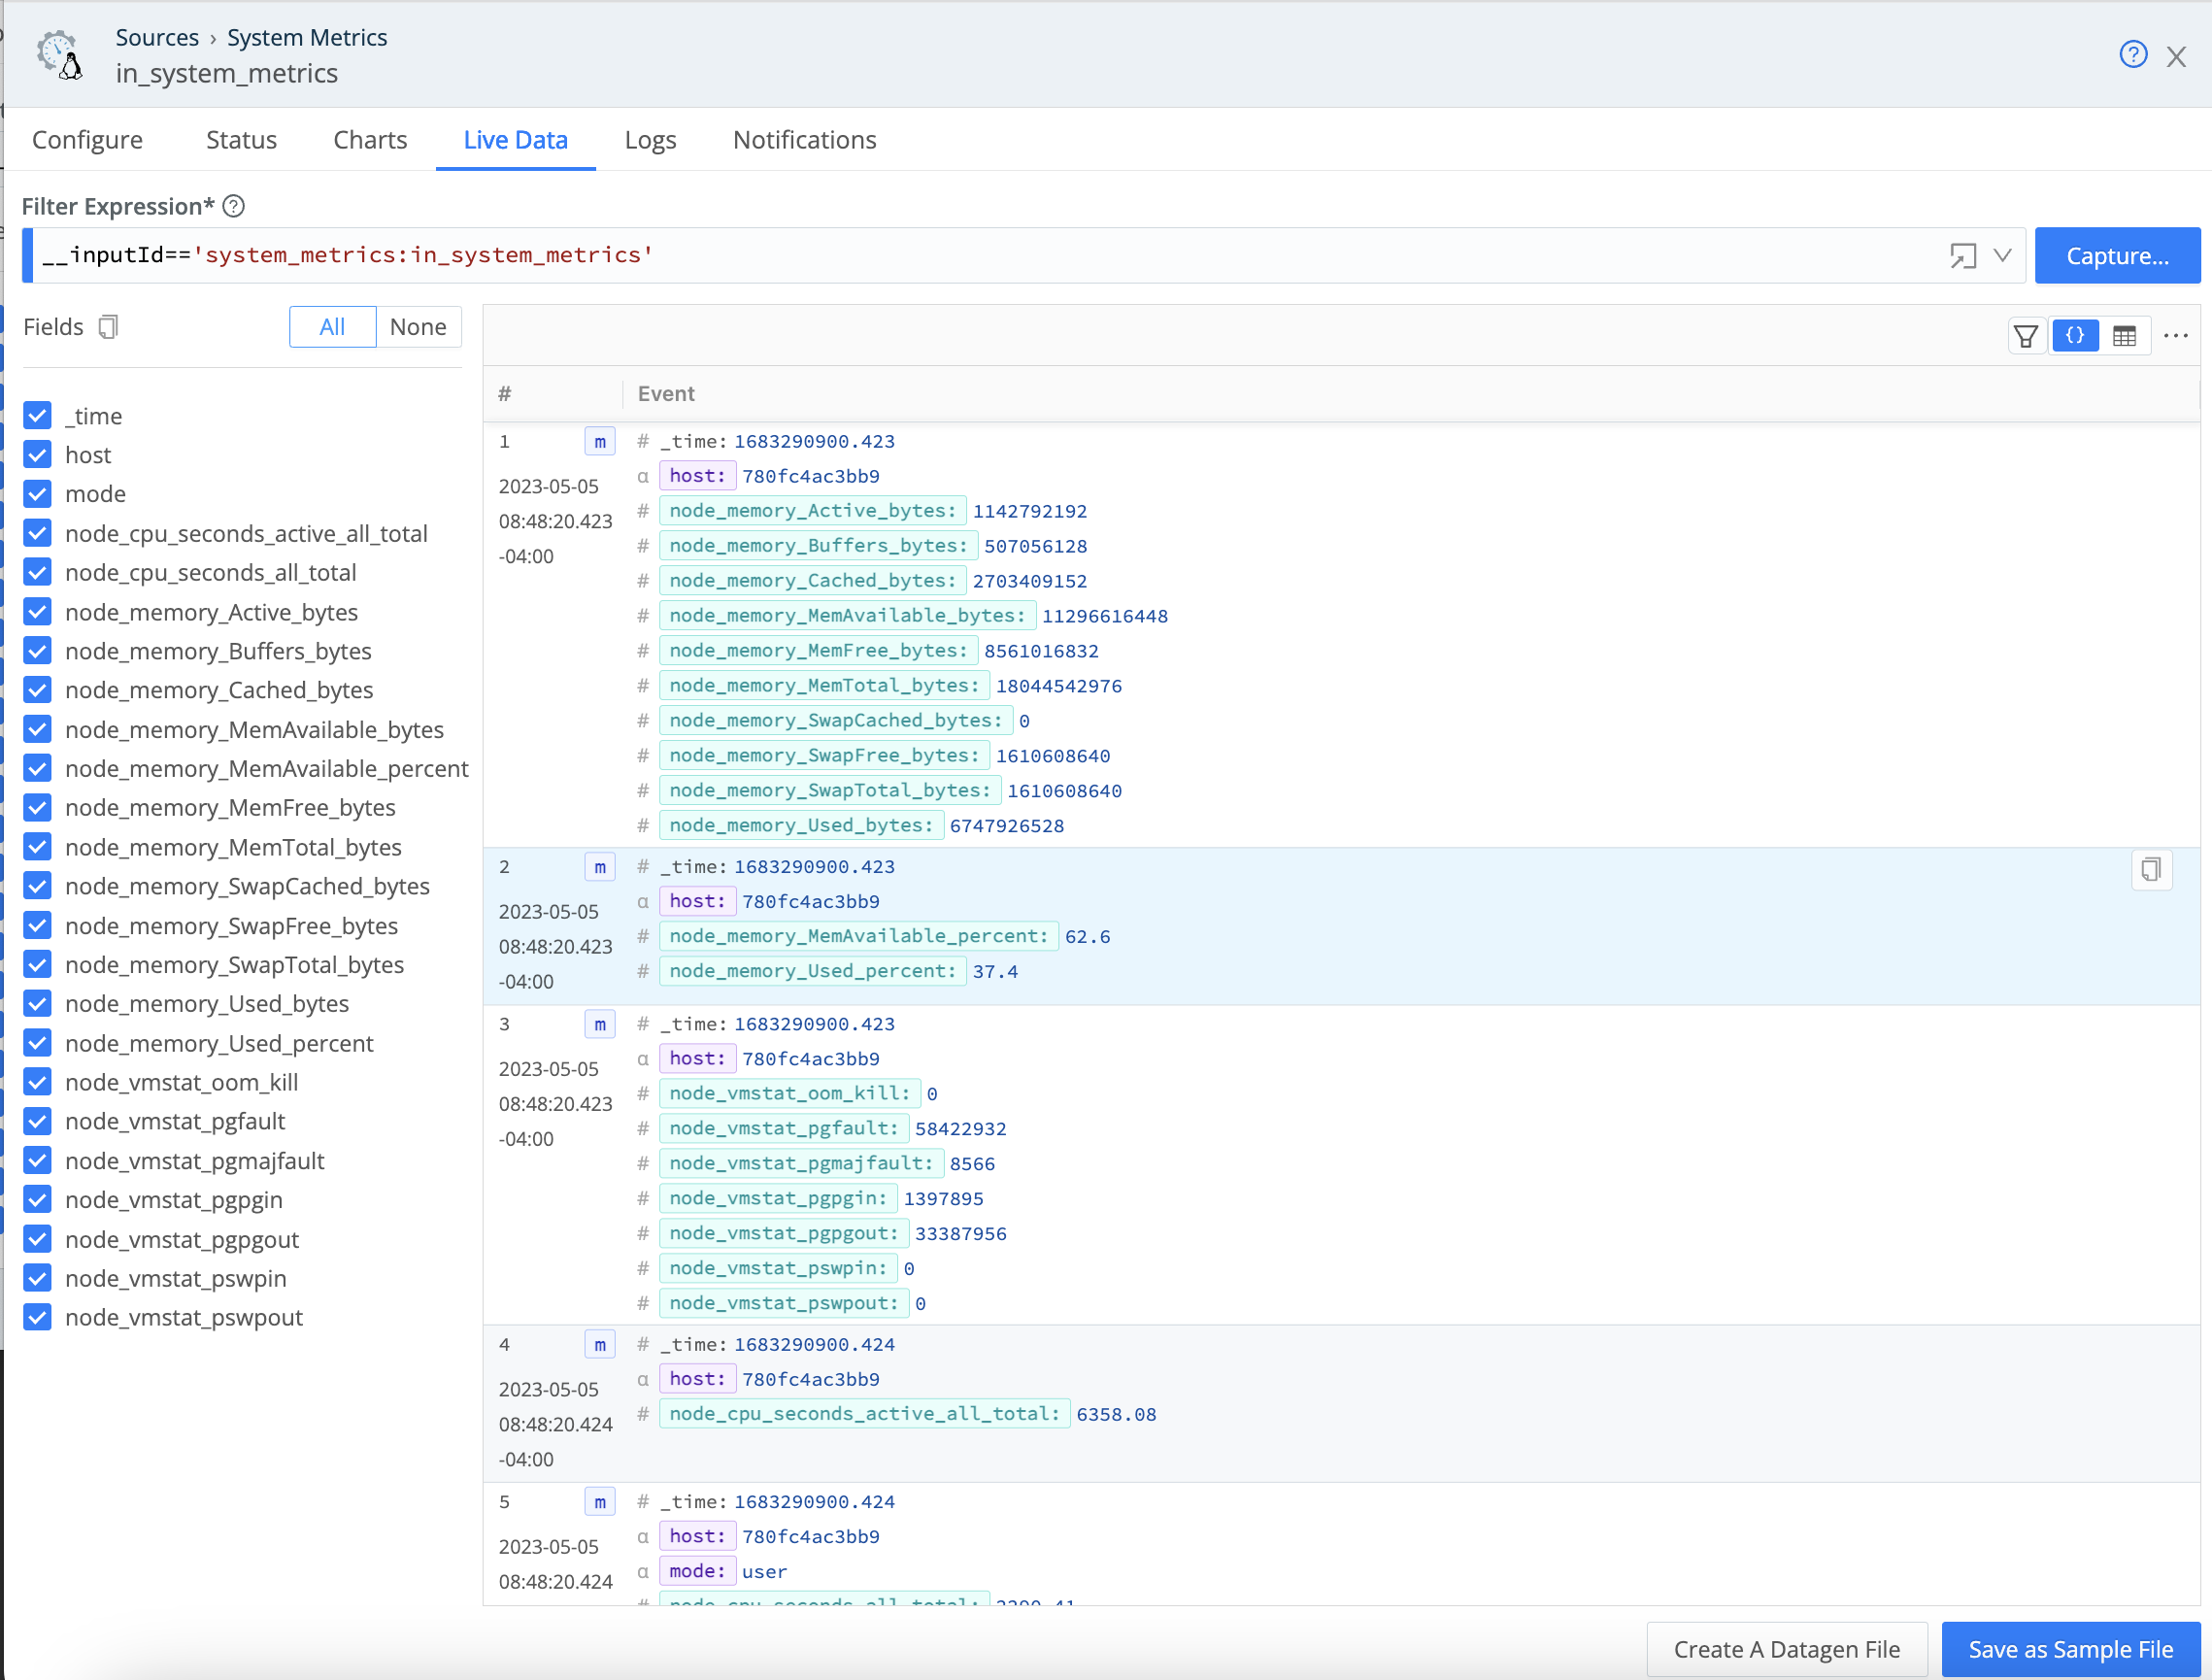
For all of the Sources, select Processing Settings > Pre-Processing, then select the
prometheus_metricsPipeline.When you’re finished, Commit and Deploy the changes. Before you move on to the next step, check the Live Data tab to make sure the metrics are generated.
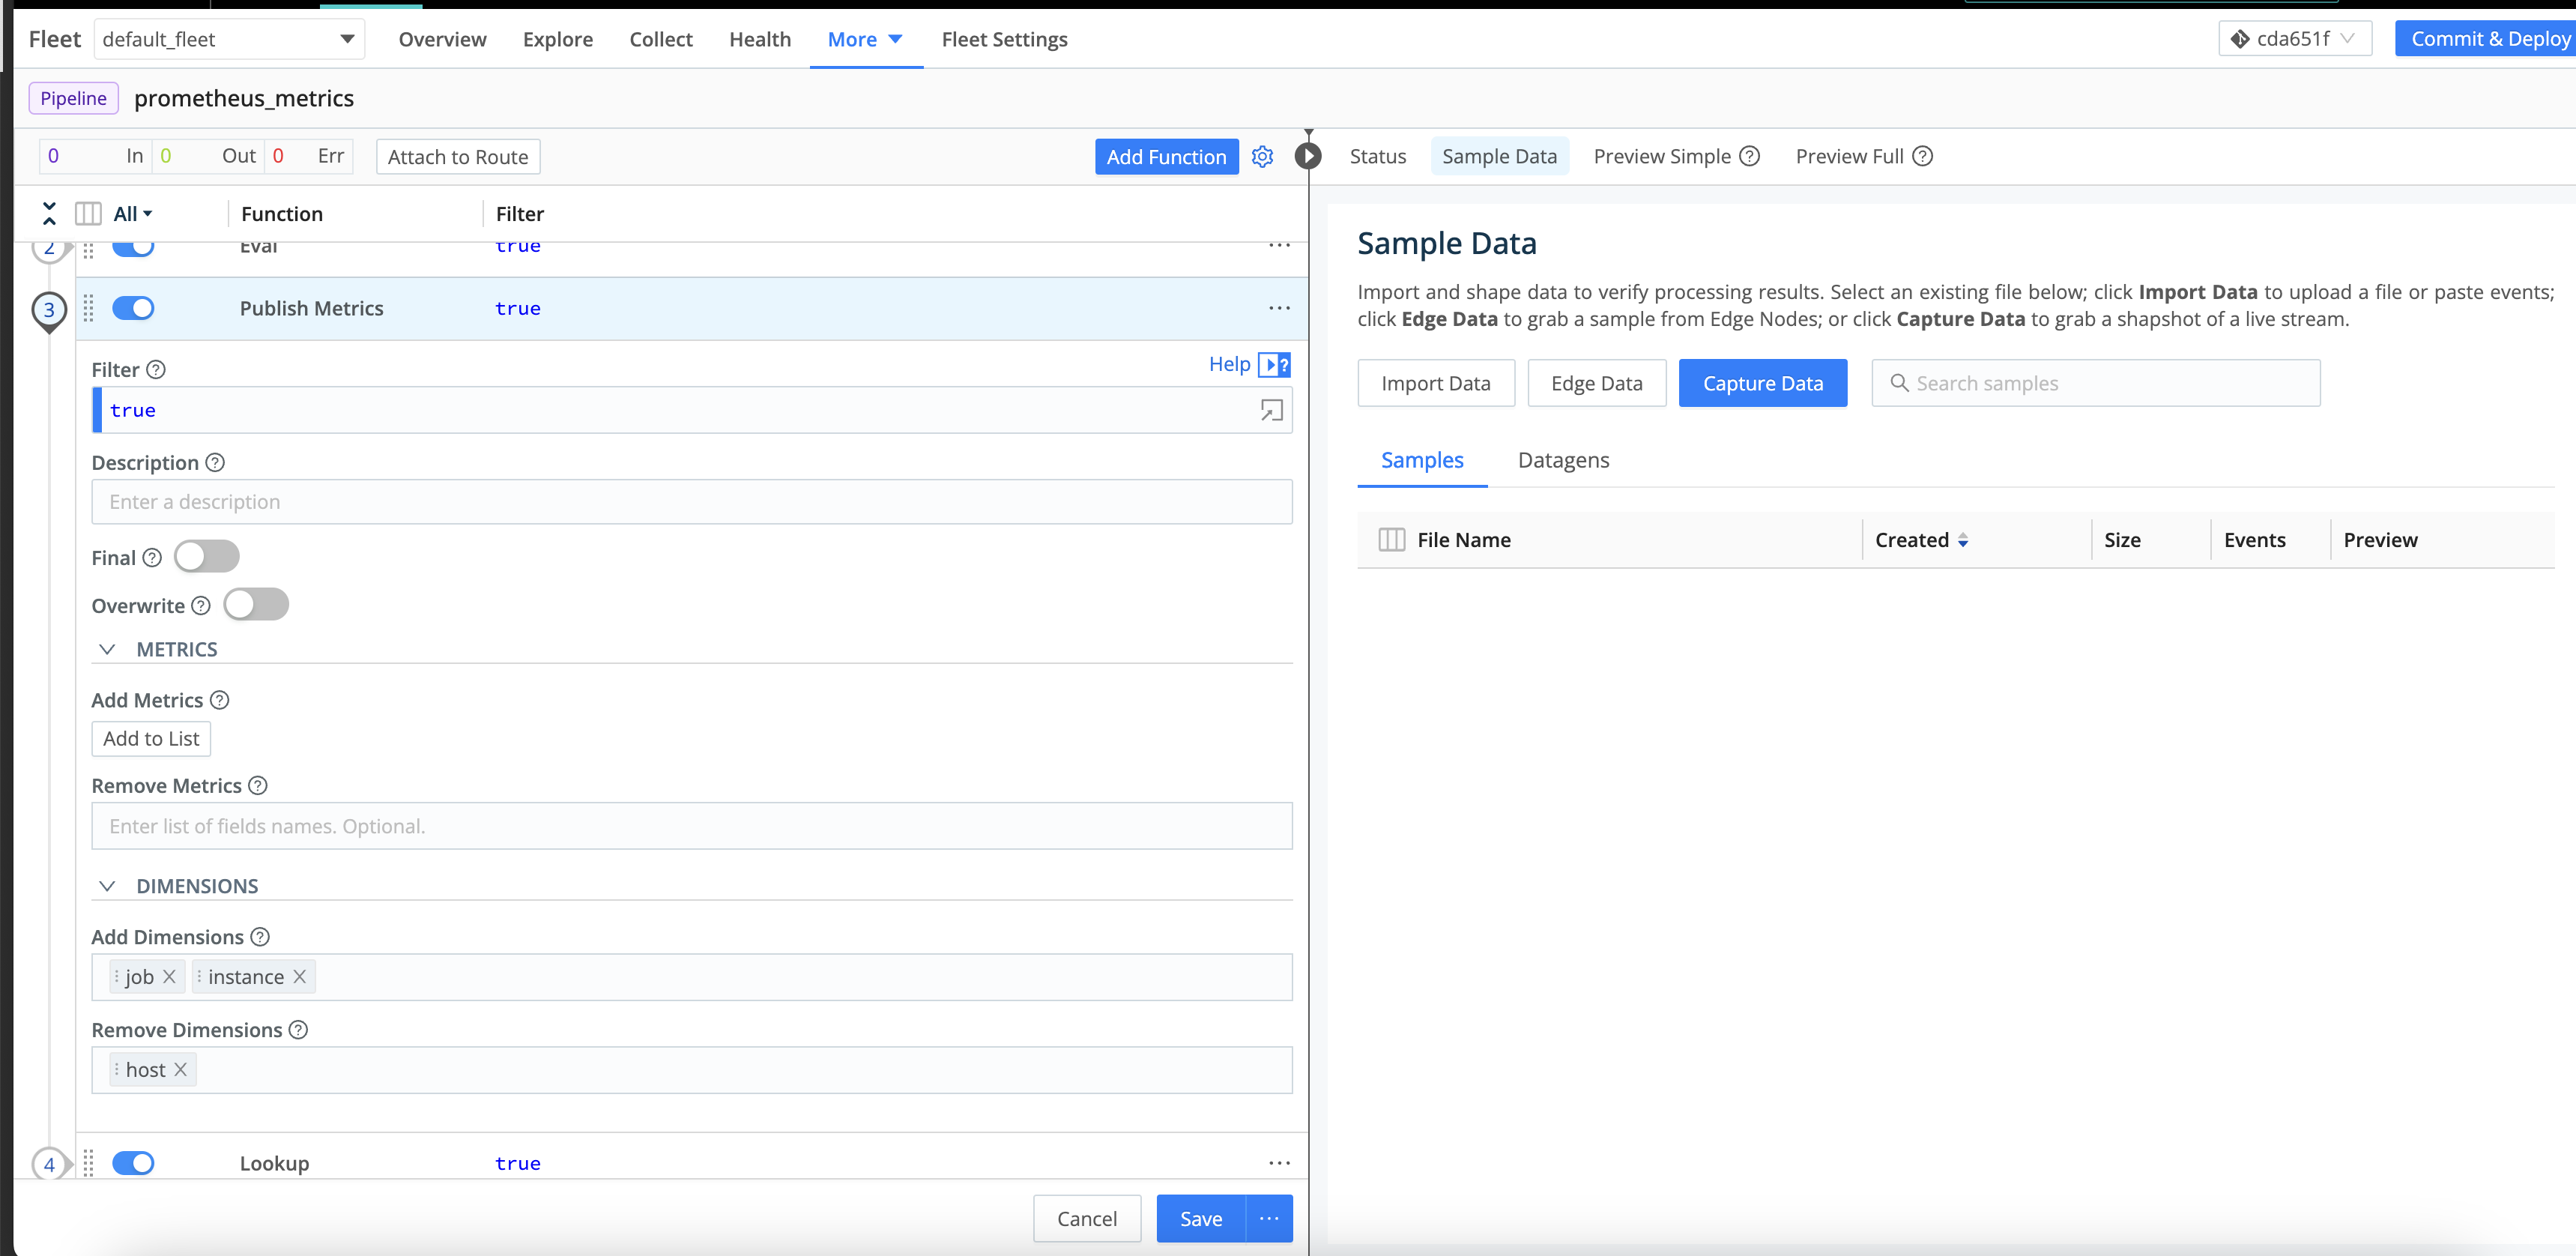
(Optional) Adjust the prometheus_metrics Pipeline
Optionally, you can adjust the prometheus_metrics Pipeline to include the
host dimension, or to add/remove more dimensions.
Access the prometheus_metrics Pipeline by selecting More > Pipelines in the Fleet submenu.
Configure the Grafana Cloud Destination
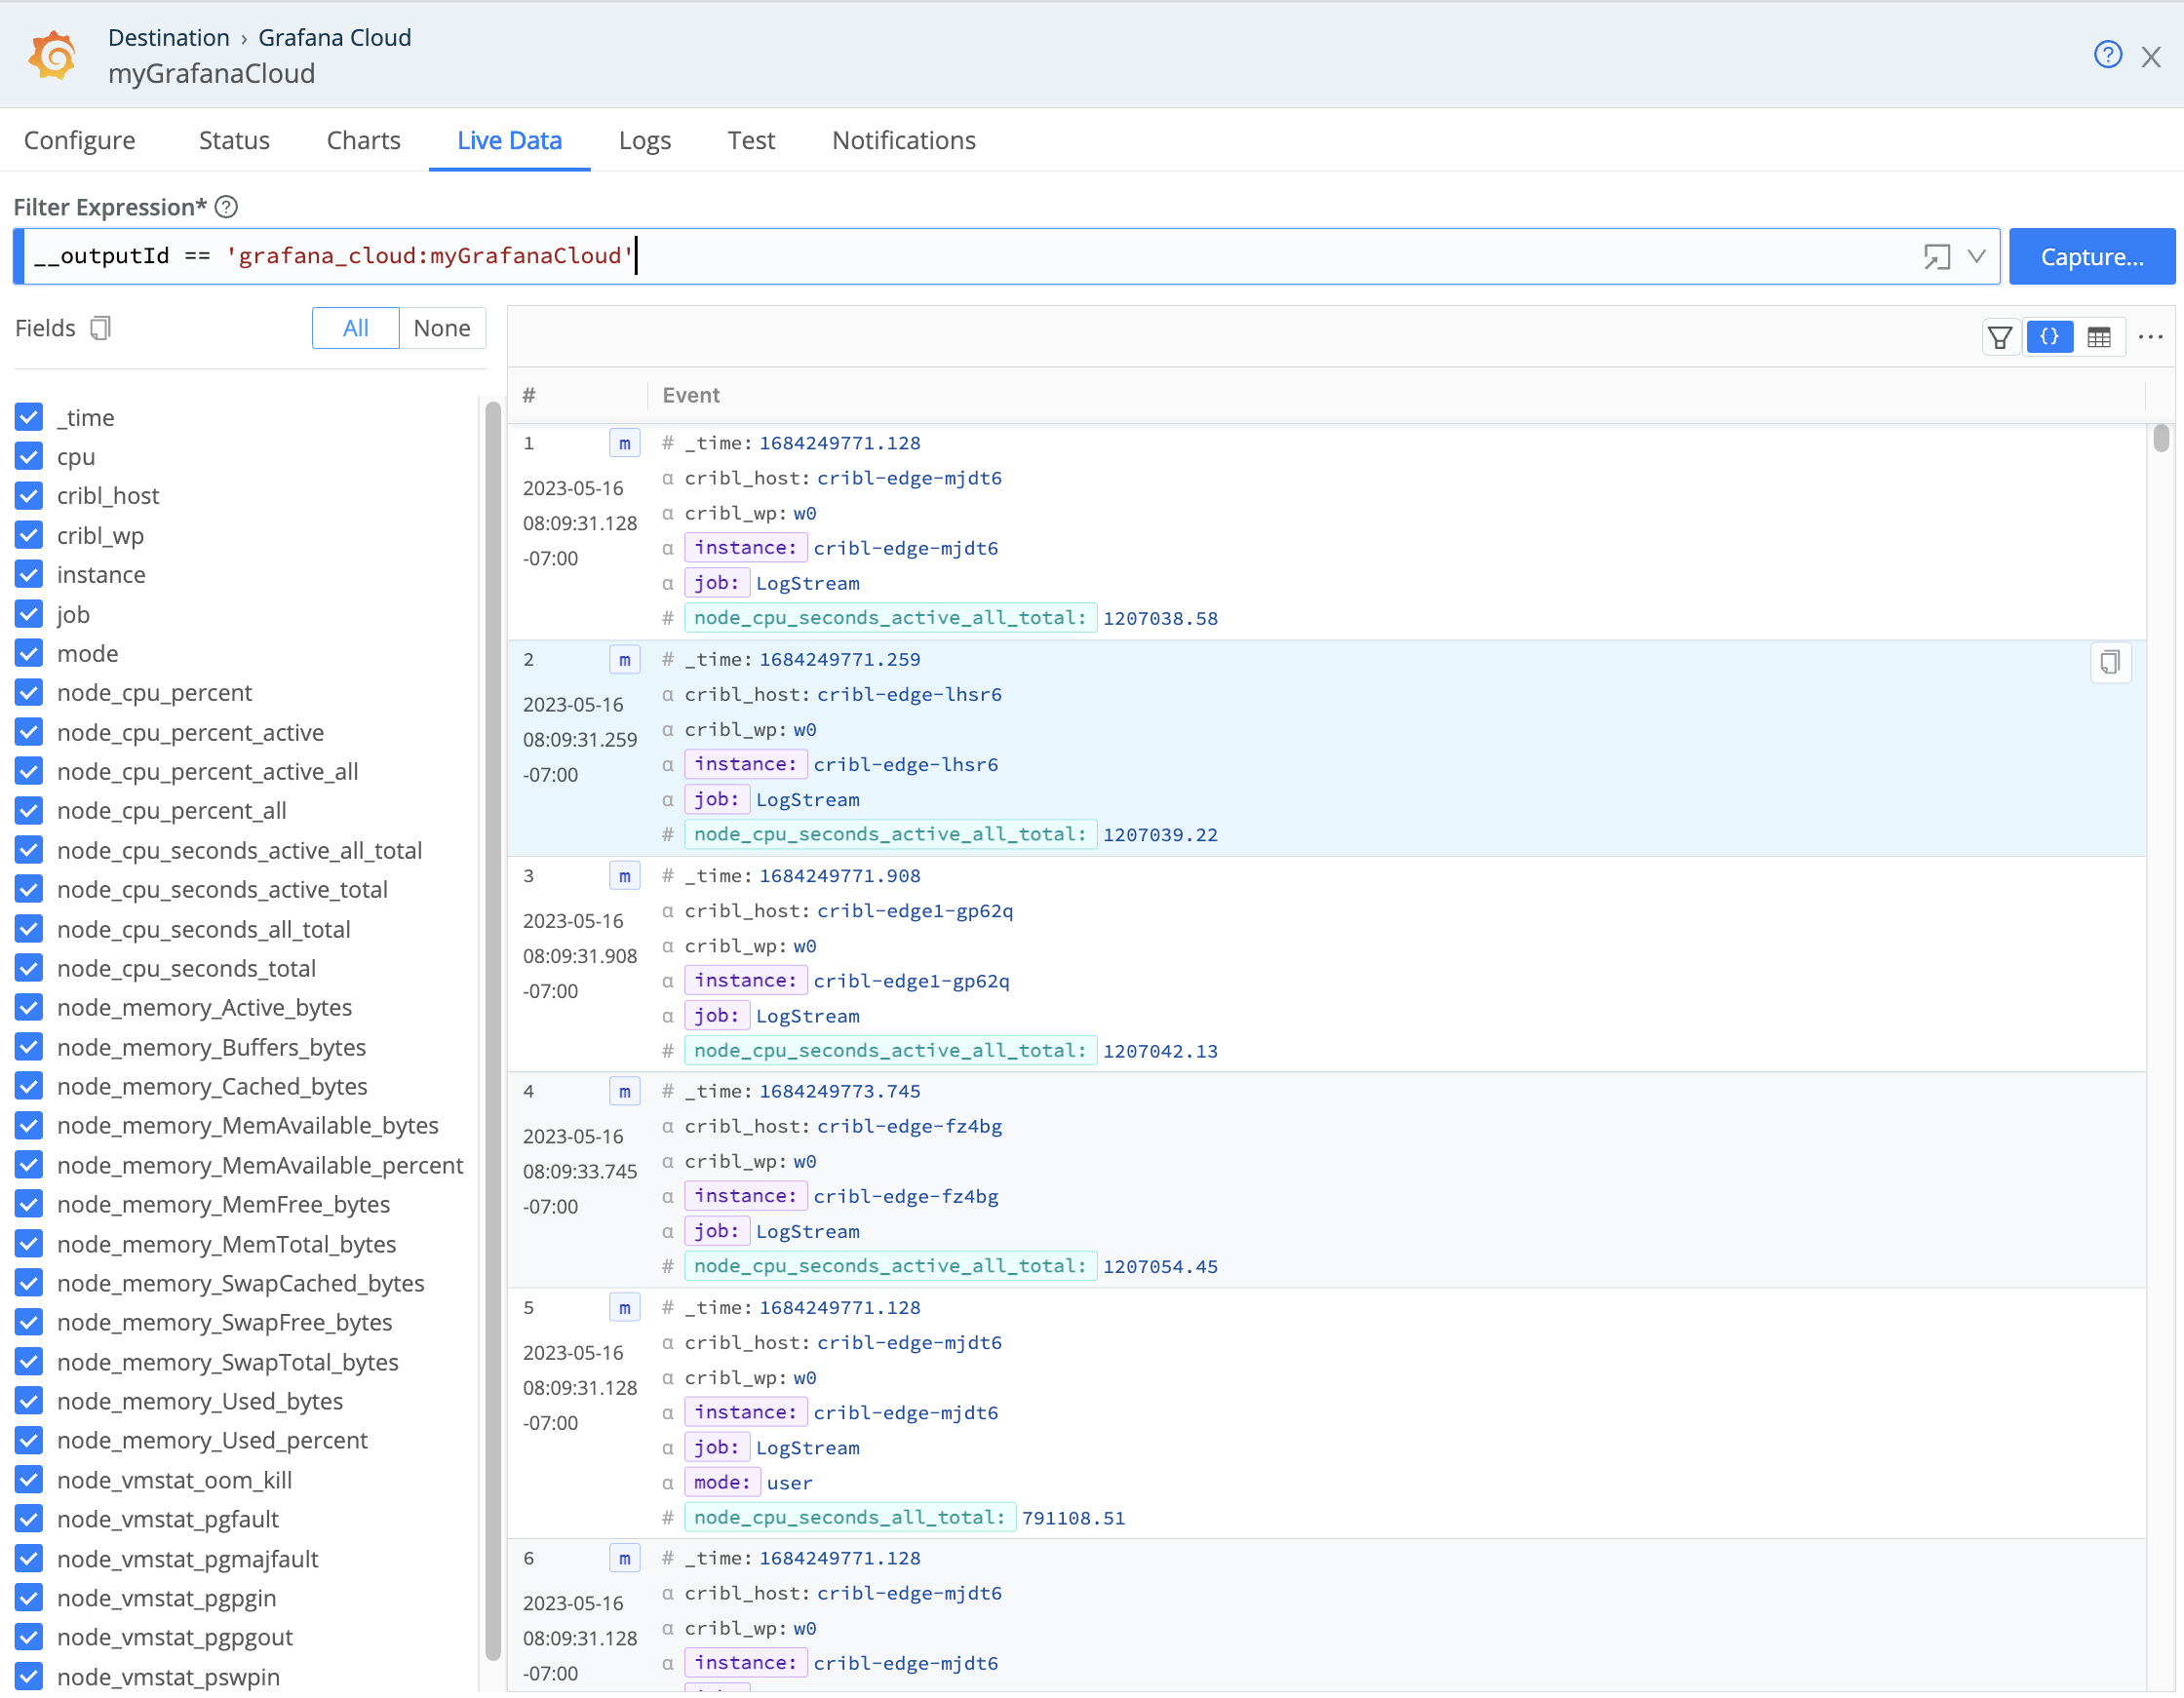
Next, head over to Grafana Cloud Destination to configure the Destination and send data to Grafana Cloud.
Preview your data on the Grafana Cloud config modal’s Live Data tab.
Visualize the Data in Grafana
You can now visualize metrics in Grafana Cloud. To get started:
Navigate to your Grafana Cloud instance, and select Explore on the left panel to review the Node metrics.
You can select metrics and run a query to produce a chart and table of metric events, which you can add to new or existing dashboards for analysis. If expected metrics are missing, try adjusting the variables in your Grafana Cloud instance. See Grafana’s Variables topic for details.
Use Grafana’s Filter option to browse the dashboards for your Prometheus data. Below are sample dashboards with the basic and detailed metrics shown.
- To show basic aggregate metrics, use the Cribl Node Observability dashboard.
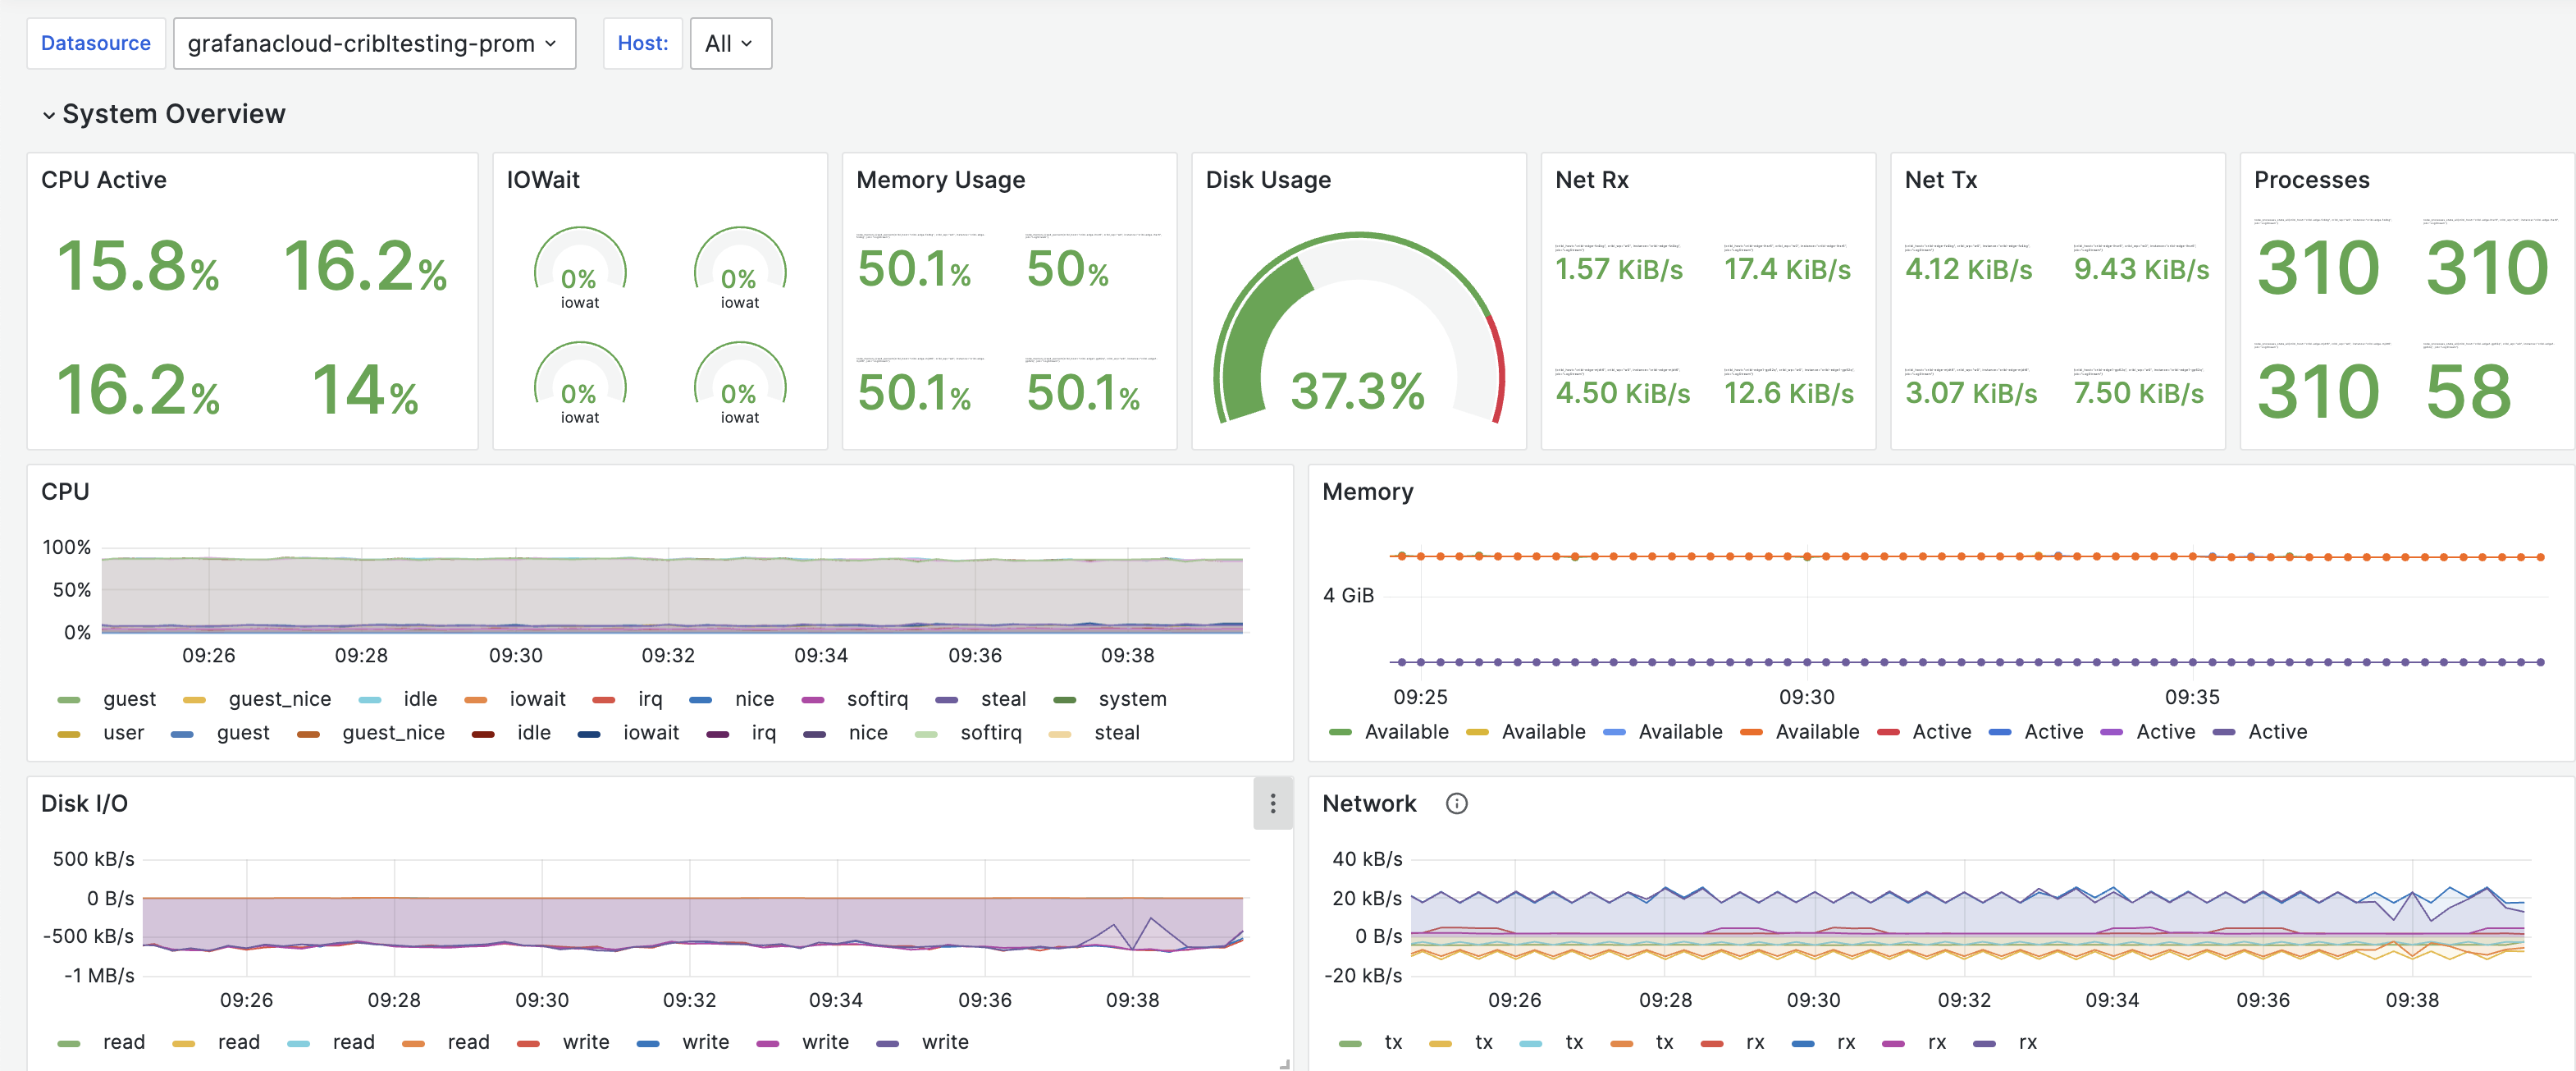
Cribl Node observability - For the
OSmetrics withCPU/Diskdetails, the basic dashboard will not suffice. Instead, we recommend configuring your System Metrics Source (as discussed above) to receive All metrics, and then using the Node Exporter Full dashboard below for visualization.
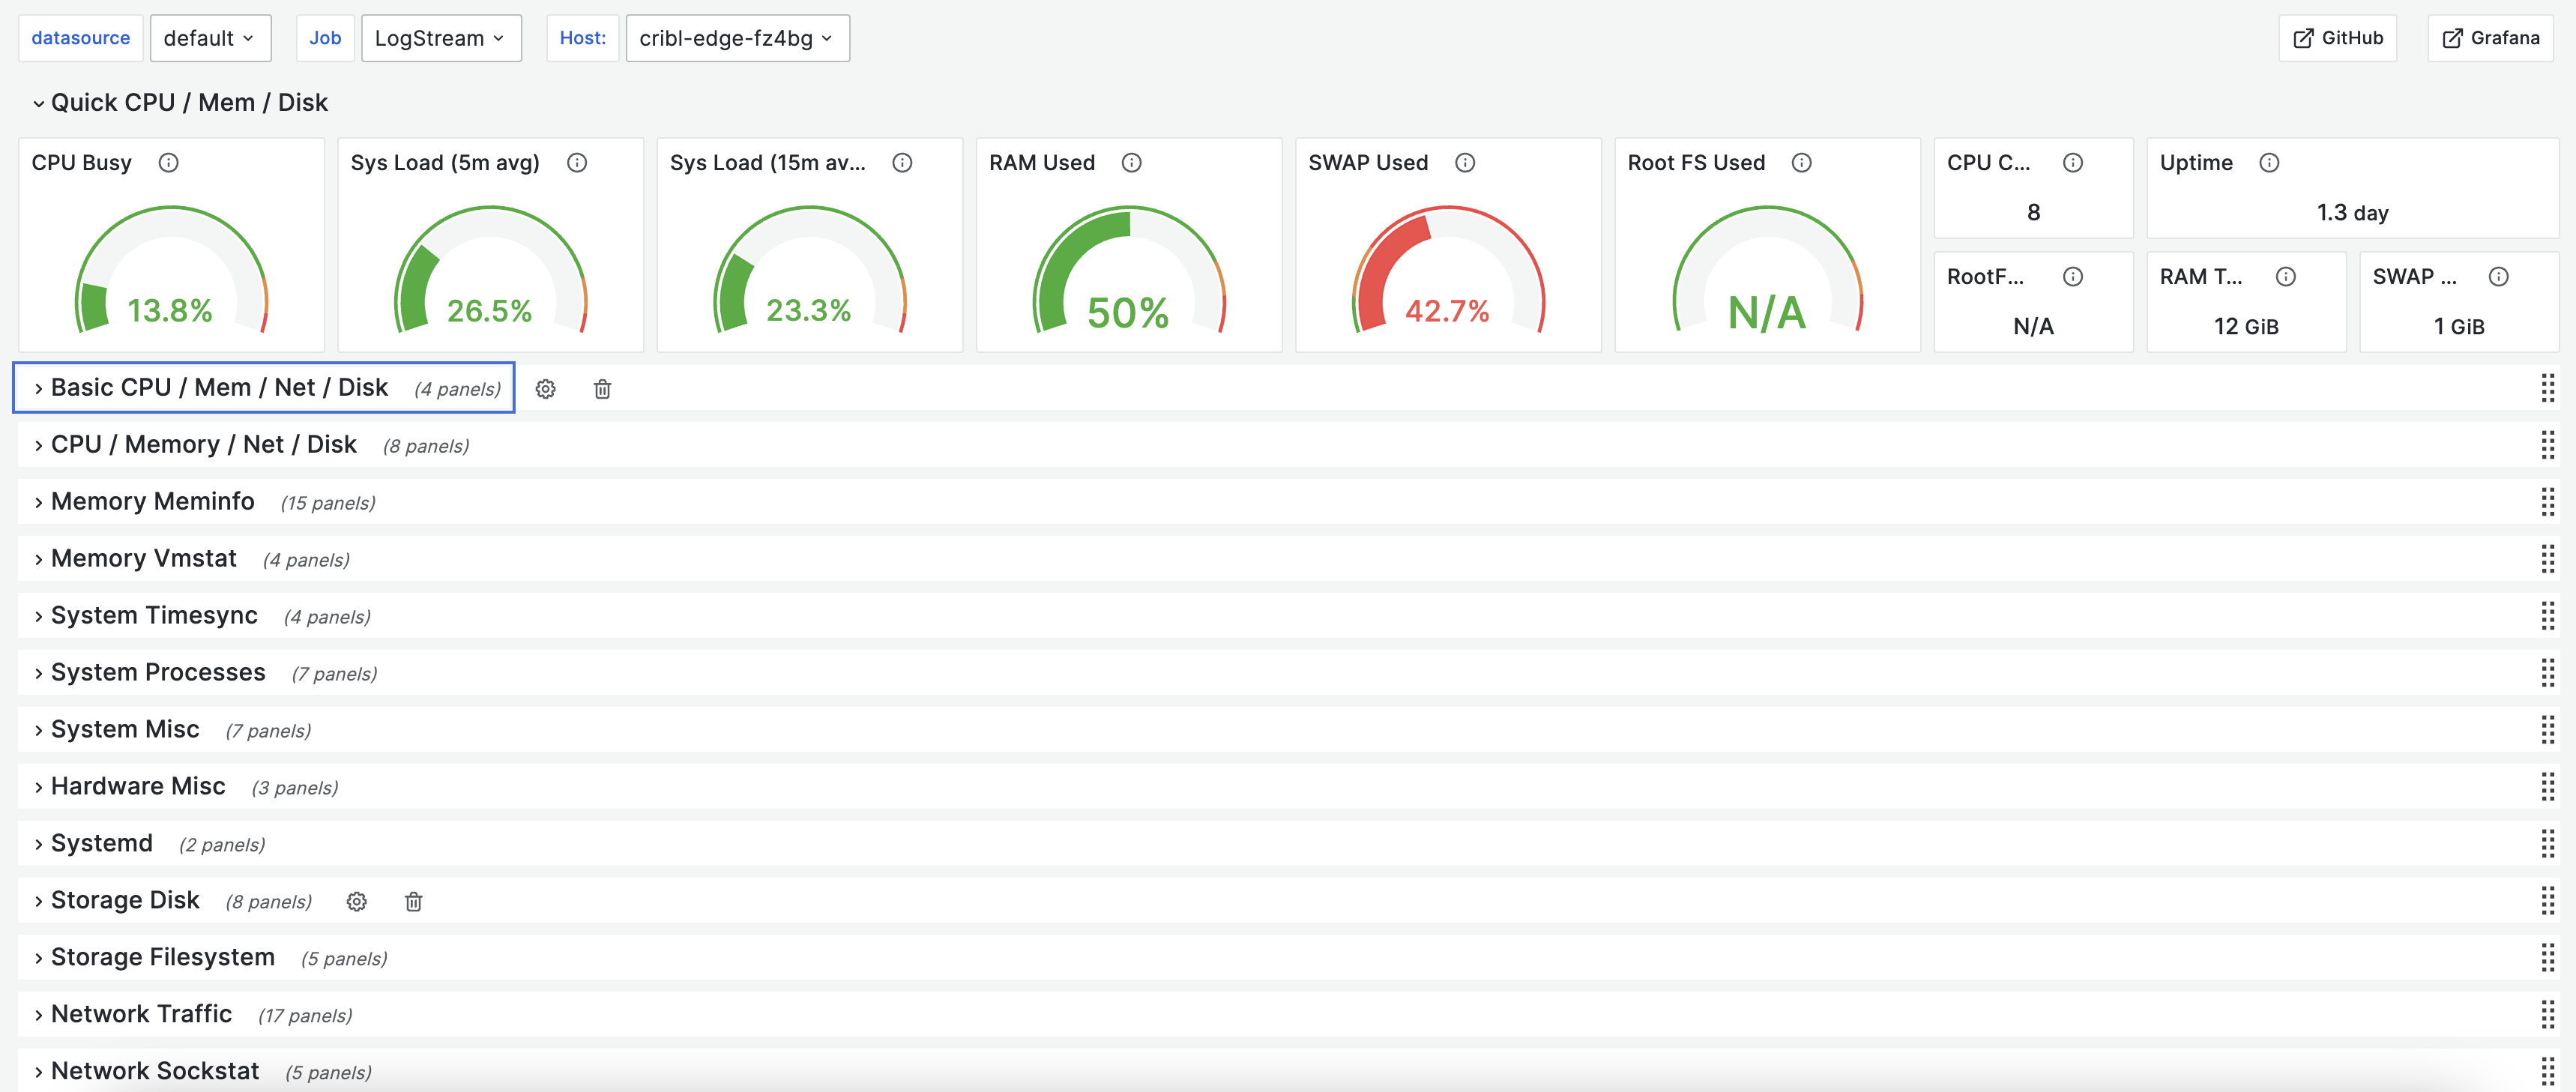
Node Exporter Full