


Streamline CloudTrail Logs Analysis with a Lakehouse
Use a Cribl Lakehouse to efficiently store, and quickly analyze, high-volume recent telemetry data.
This is a straightforward, end-to-end example of how to ingest AWS CloudTrail log files into a Lakehouse, and how to use Cribl Search to periodically analyze only specific data that is relevant for threat-hunting or security investigations.
Especially as data volume increases, this can be a cost-effective alternative to bulk-forwarding data to a traditional SIEM system. This example walks you through sequential setup in AWS, Cribl Stream, Cribl Lake, and Cribl Search. The broad steps are:
- Collect and stage CloudTrail logs in AWS.
- Shape the data, using a Cribl Stream Parser.
- Create a Cribl Lake Dataset to store your parsed data.
- Route the parsed data to the new Lake Dataset.
- Configure a Lakehouse, to support low-latency analytics in Cribl Search.
- Analyze relevant data, using Cribl Search ad hoc and scheduled queries.
- Visualize your data, using Cribl Search predefined or custom Dashboards.
Beyond this specific example, you can use a similar workflow to efficiently store and analyze many other types of logs, by substituting a different Cribl Stream Parser or configuring your own.
Collect and Stage CloudTrail Logs
Your first steps take place in the Amazon Management Console. If you’re not already collecting CloudTrail logs, the Amazon What Is AWS CloudTrail? documentation provides specific instructions.
- Set up trails within your AWS account to log events of interest.
- Configure writing the CloudTrail logs to an Amazon S3 bucket.
- Enable permissions for Cribl Stream to read from the S3 bucket.
Shape the Data
Next, use Cribl Stream to ingest your CloudTrail data, and to parse the named fields that Lakehouse requires. (You’ll want to configure all Stream steps within your Cribl.Cloud Organization, to enable routing to Cribl Lake later.)
- Configure a Cribl Stream Amazon S3 Source to continuously collect (stream) data from your S3 bucket.
- Create or adapt a simple Cribl Stream Pipeline that will process this data.
- Add a single Parser Function to the Pipeline.
- In the Parser, accept default
Extractmode, then set the Library toAWS VPC Flow Logs(this library can handle CloudTrail logs, too). As shown below, this will automatically set the Type toExtended Log File Format. - Save the Pipeline.
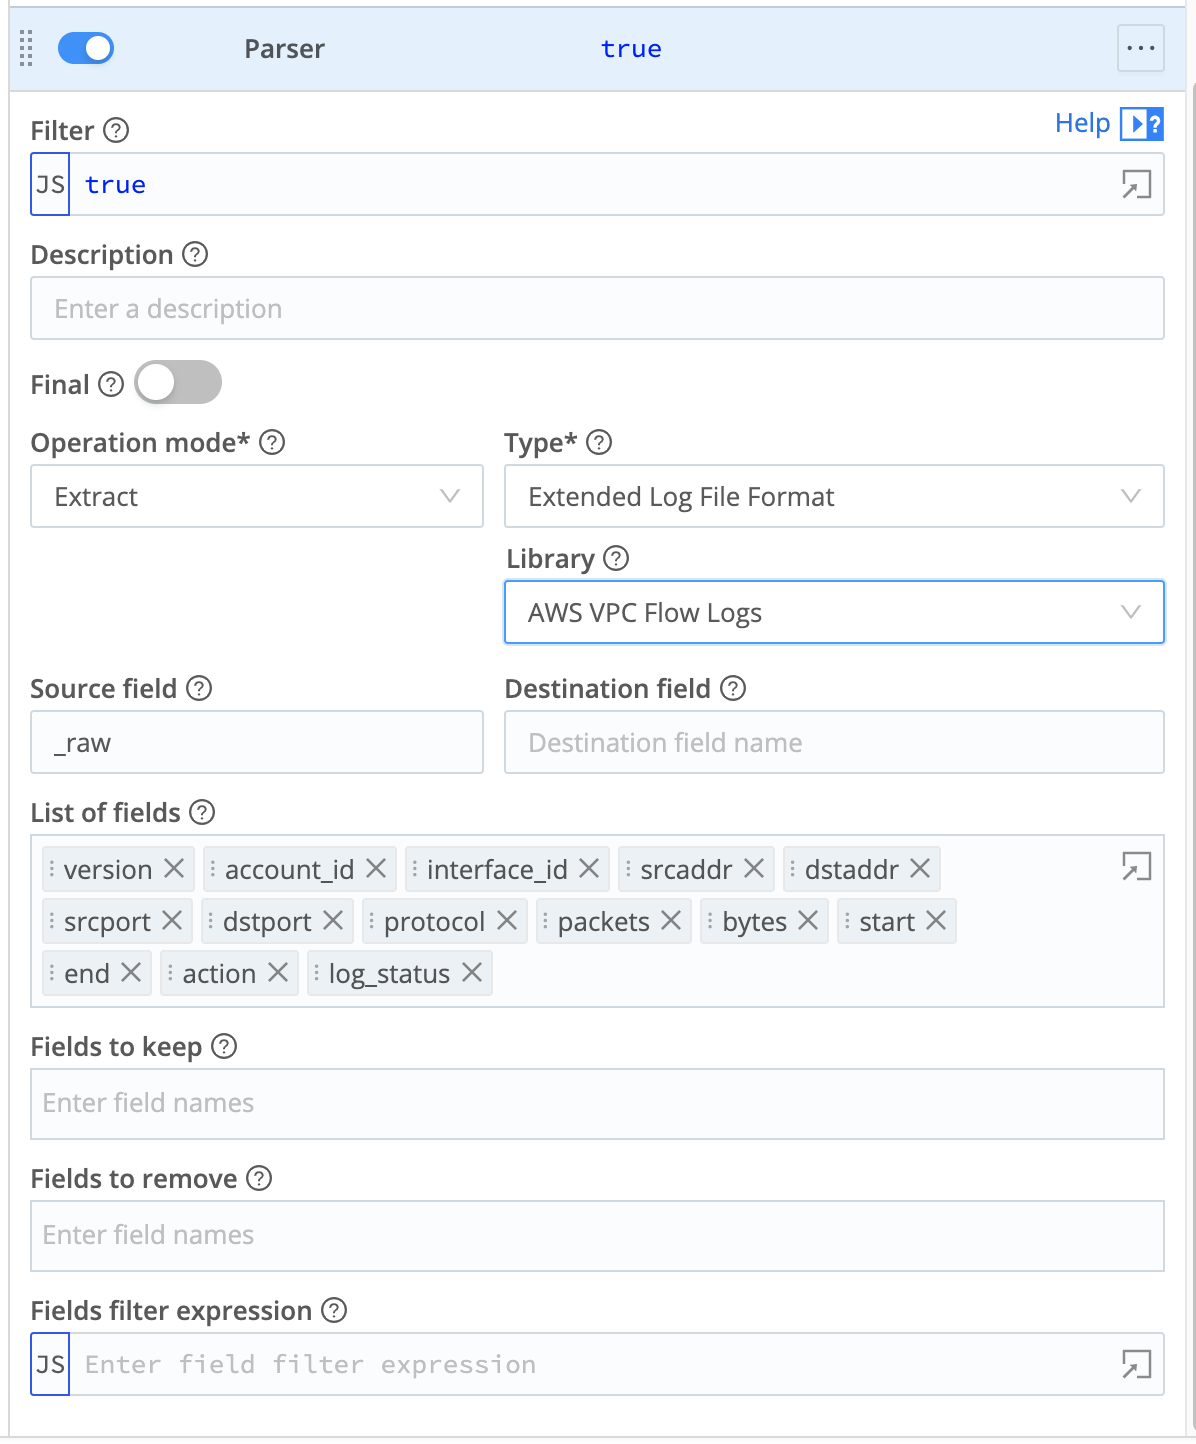
You might choose to expand this Pipeline to add Tags, or to add other predefined Cribl Stream Functions to shape or narrow your data in specific ways. This scenario presents the simplest scenario to parse your data for Cribl Lake.
The Cribl Pack for AWS CloudTrail Data Collection provides sample Pipelines that you can adapt and add to Cribl Stream. You can also use the Cribl Copilot Editor (AI) feature to build a Pipeline from a natural-language description of the processing you want.
Create a Cribl Lake Dataset
In Cribl Lake, create a Lake Dataset to store your shaped data.
Lakehouse acceleration covers a rolling 30-day retrospective time window, so configure your Lake Dataset with at least a 30-day retention period – or longer, depending on your organization’s retention policy and compliance needs.
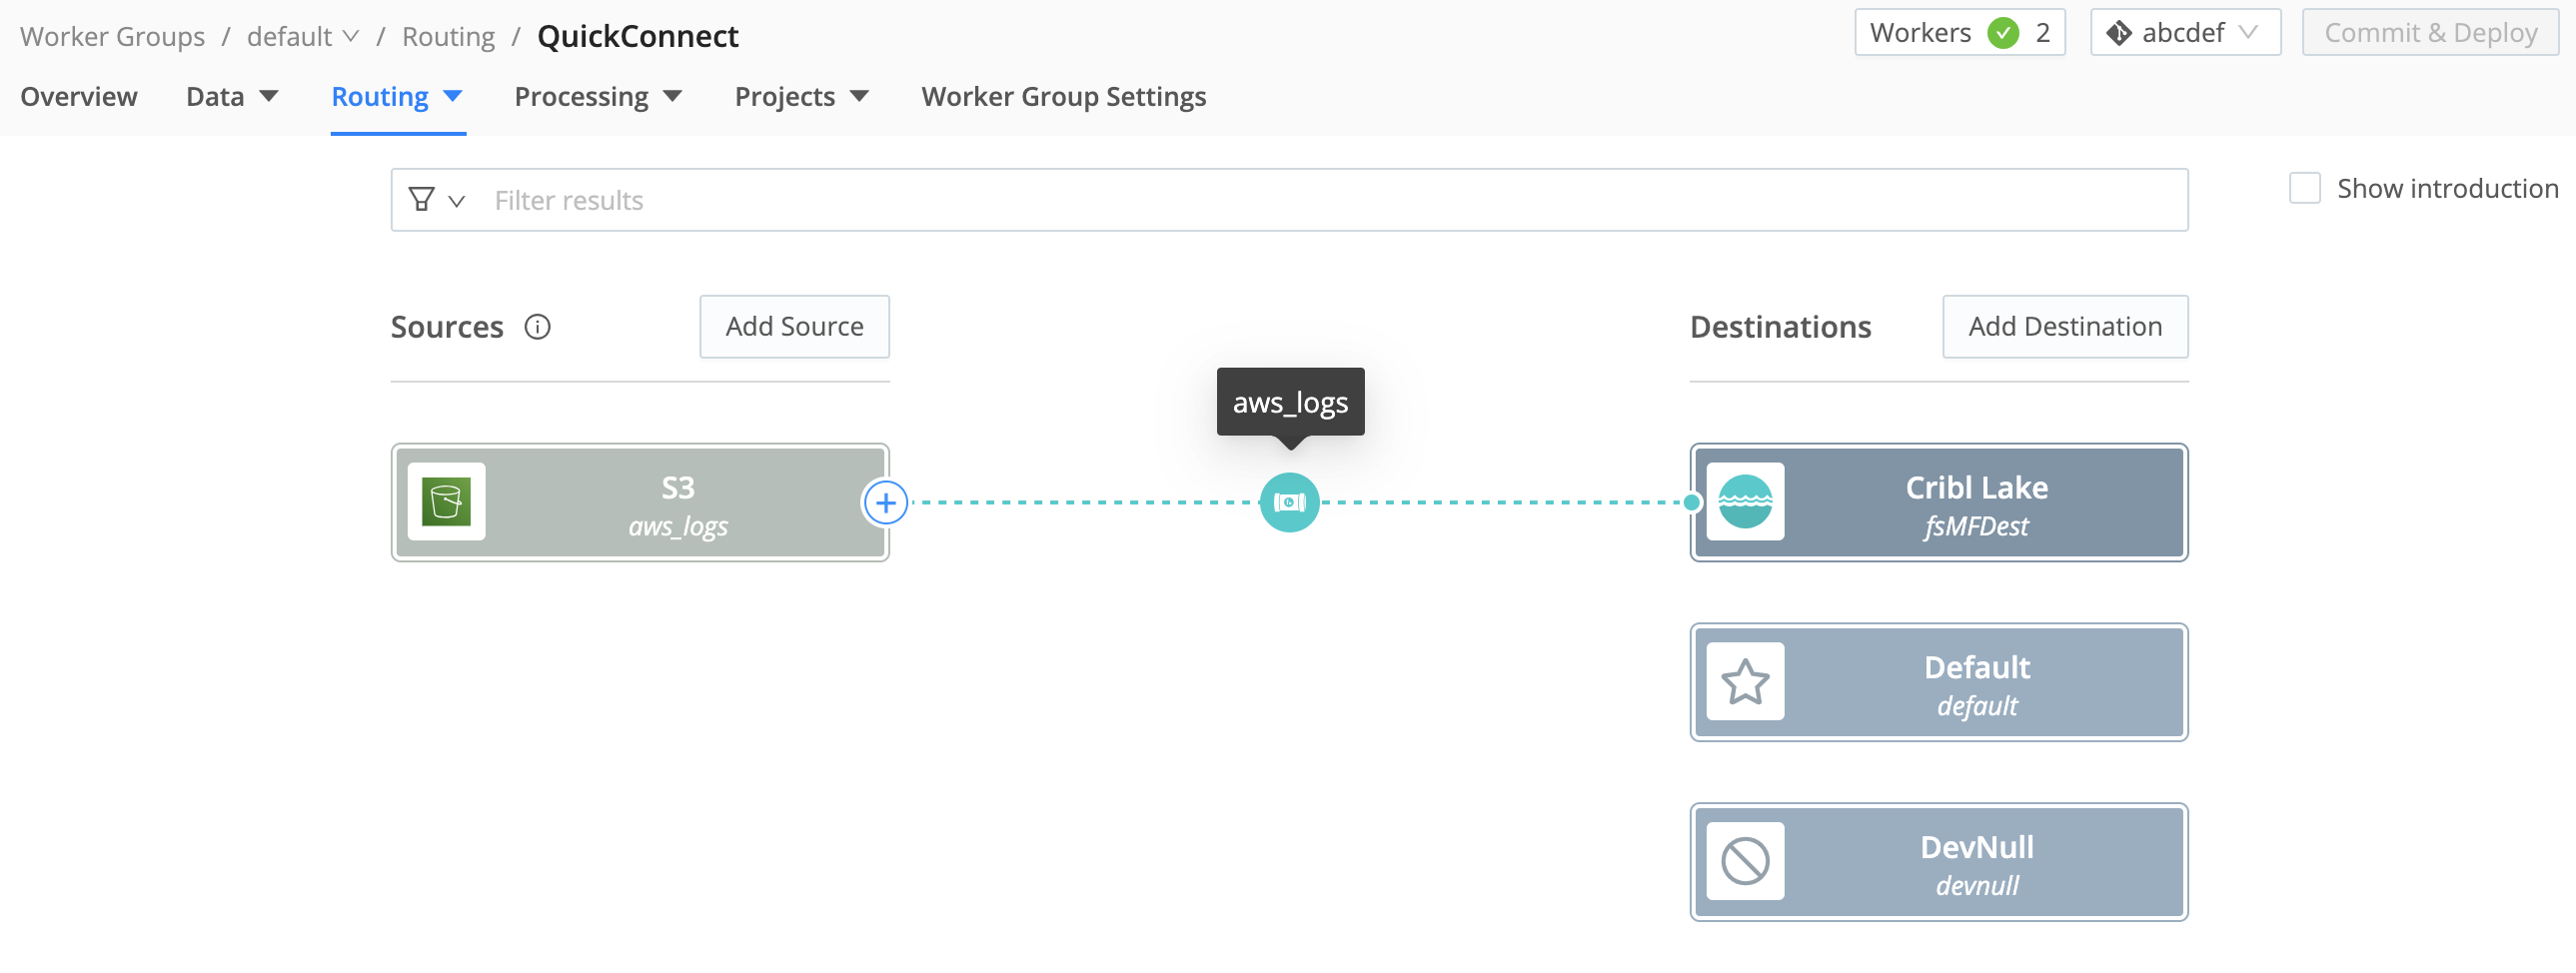
Route the Parsed Data to Cribl Lake
Back in Cribl Stream, route your shaped data to your Lake Dataset.
- Add a Cribl Lake Destination.
- Within that Destination, select the Lake Dataset you’ve just created, and save the Destination.
- You can use either QuickConnect or Data Routes to connect your S3 Source to your Lake Destination through the Pipeline you configured earlier. (The Destination topic linked above covers both options.)
Configure a Lakehouse For Low-Latency Analytics
With data flow now established from S3 to Cribl Lake, assign the Lake Dataset to a Lakehouse to enable fast analytics.
- Add a Lakehouse, sized to match your expected daily ingest volume.
- When the Lakehouse is provisioned, assign your CloudTrail Lake Dataset to the Lakehouse.
Analyze Relevant Data
In Cribl Search, define queries to extract relevant data from your CloudTrail data. You can search up to 30 days of data at Lakehouse speed. Here is a sample query to retrieve and present rejected connections by source address:
dataset="<your_lakehouse_dataset>"
| action="REJECT"
| summarize by srcaddrYou can schedule your searches to run on defined intervals. Once a query is scheduled, you can configure corresponding alerts (Search Notifications) to trigger on custom conditions that you define.
Here is a sample query you could schedule to generate an hourly report that tracks traffic by source and destination:
dataset ="<your_lakehouse_dataset>" srcaddr="*" dstaddr="*"
| summarize count() by srcaddr, dstaddr
| sort by count descIf you’re moving high-volume log analysis from a traditional SIEM to Cribl, you might need to adapt existing queries to the KQL language that Cribl Search uses. See our Build a Search overview and our Common Query Examples.
You can also Write Queries Using Cribl Copilot, enabling Cribl AI to suggest KQL queries from your natural-language prompts. If you already have searches in another system of analysis, try asking Copilot to translate them to KQL.
The
cribl_search_sampleDataset, built into Search, contains VPC Flow Log events. You can use this Dataset to experiment with queries before you enable continuous data flow and analysis.
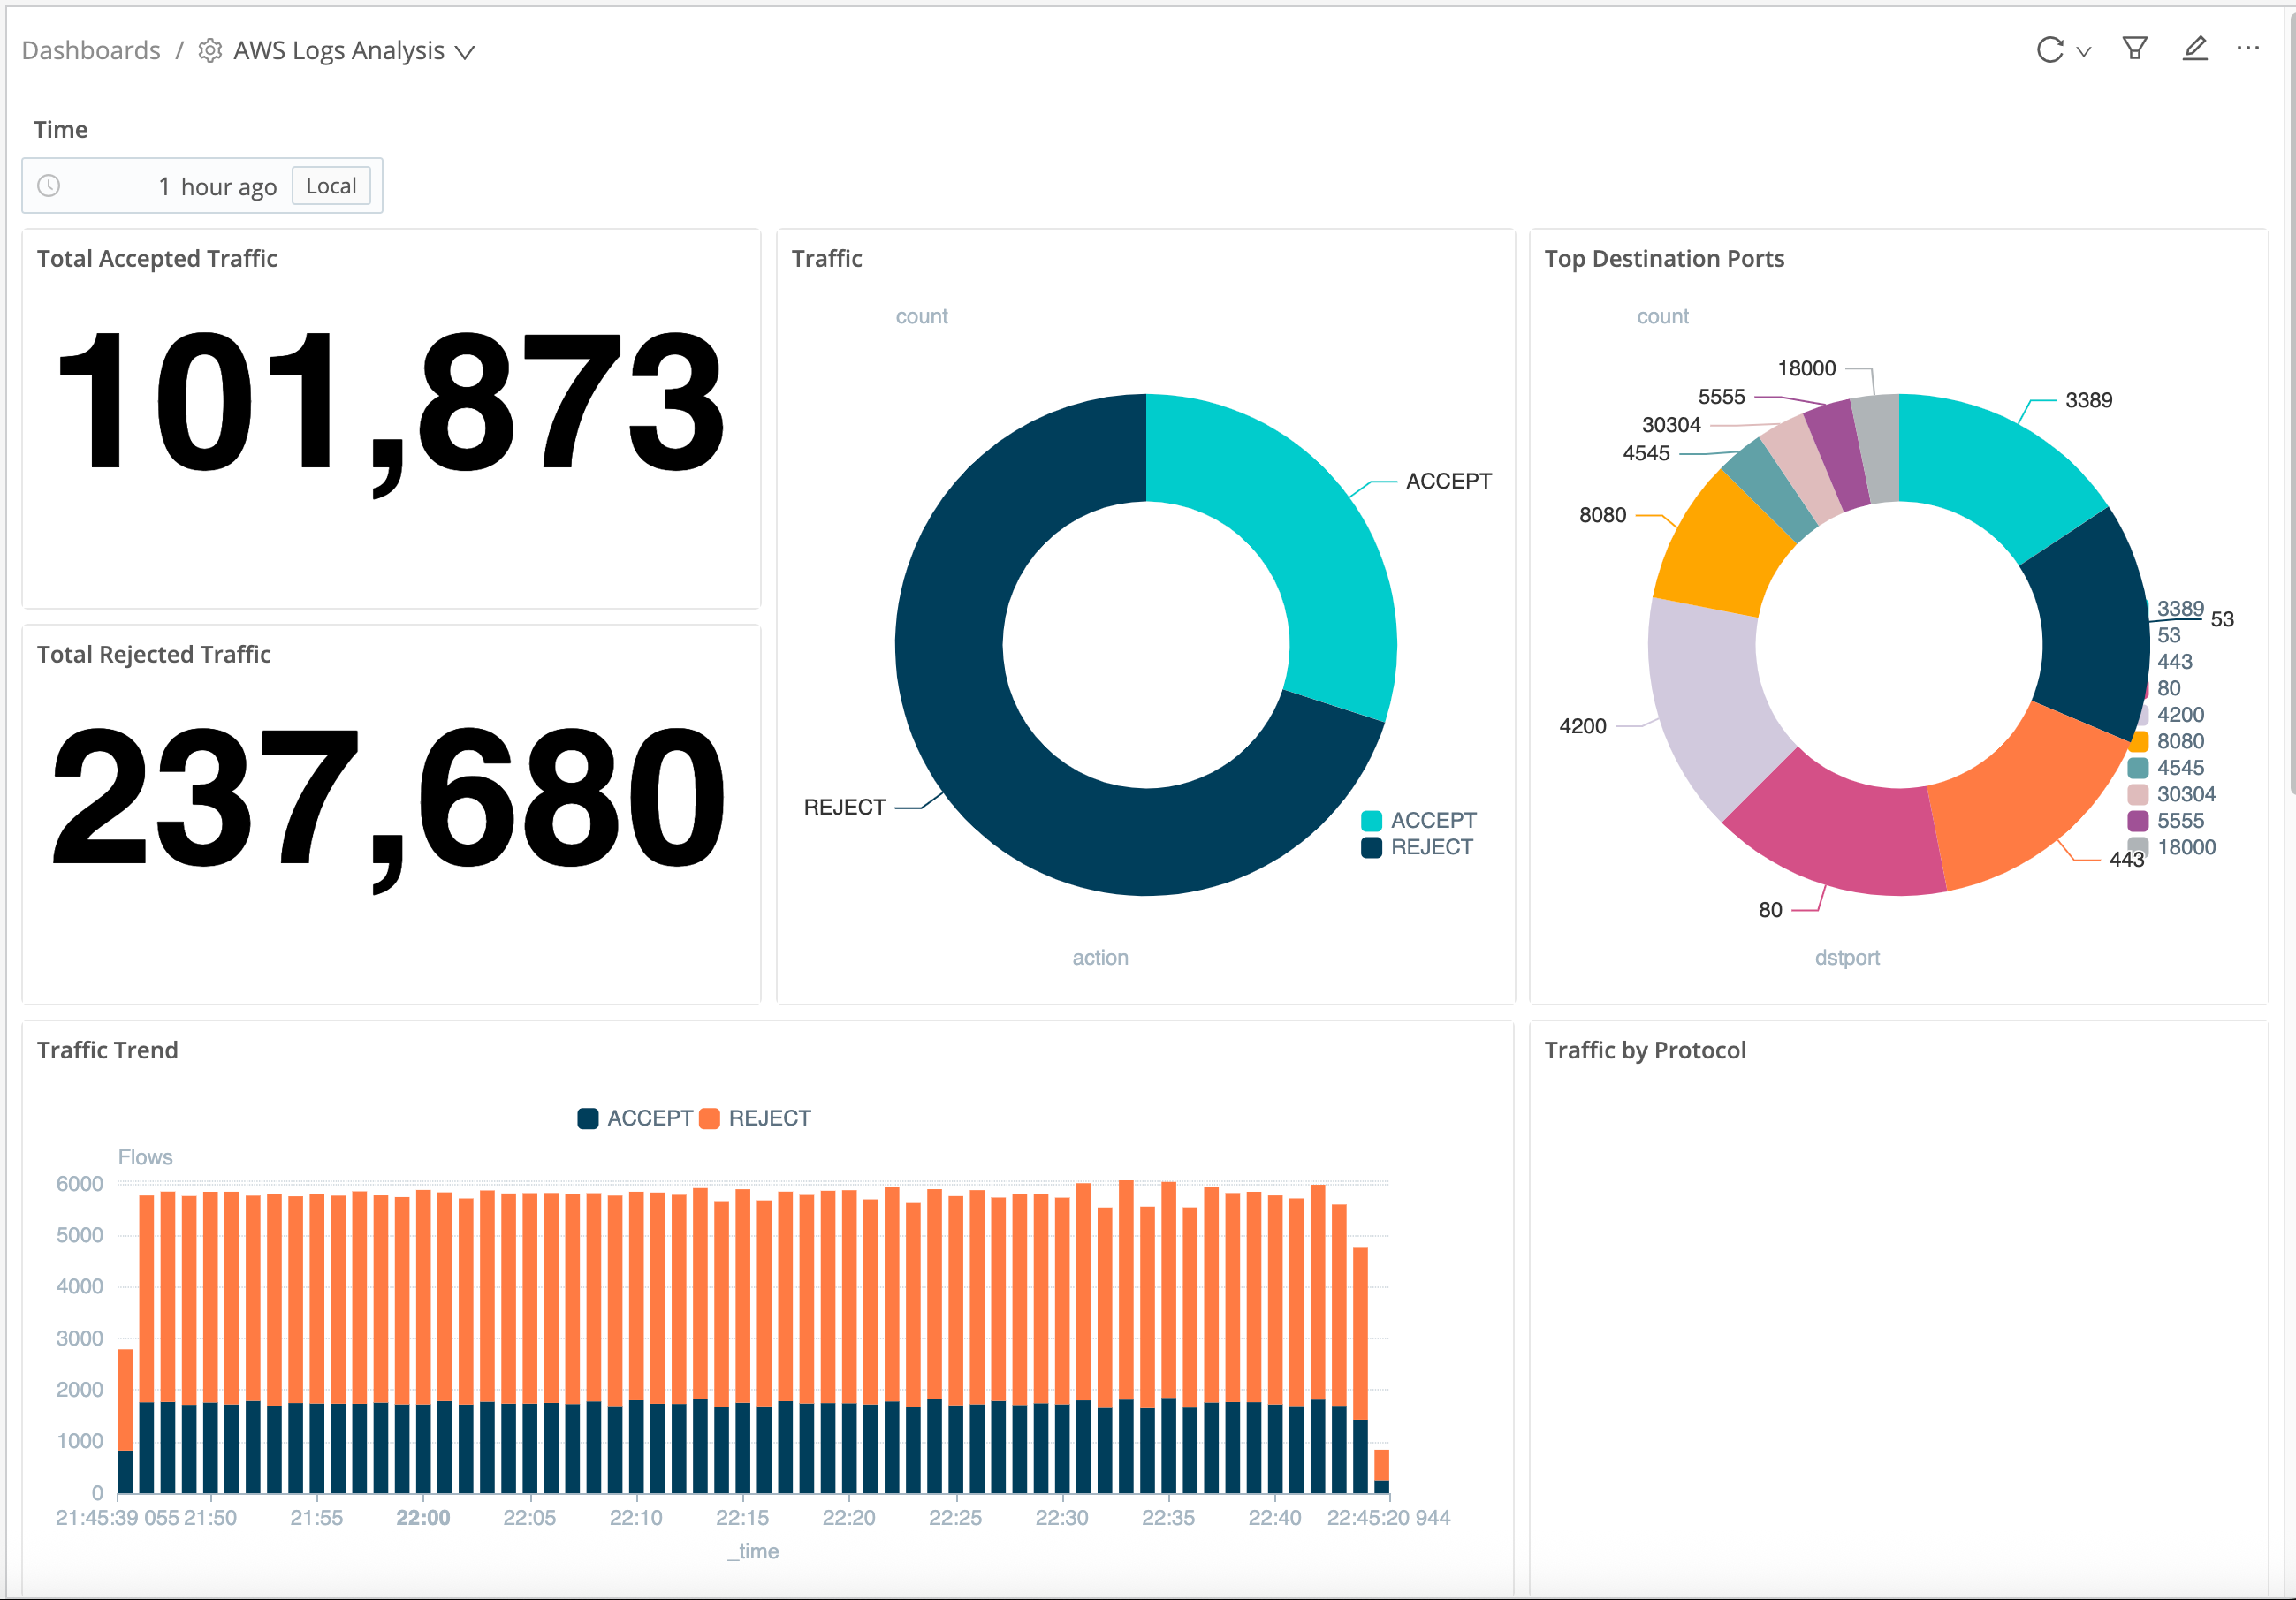
Visualize Your Analyzed Data
In Cribl Search, you can build flexible Dashboards to visualize your analytics.
Cribl AI can automatically suggest visualizations for your Dataset, and can build visualizations from your natural-language prompts. For these options, see Add Visualizations Using Cribl Copilot.
Next Steps
To refine your queries and visualizations, see our Cribl Search specialized topics on: