


Monitor Health and Metrics
The Monitoring section of Cribl Stream provides insights into the performance, health, and operational status of your Cribl Stream deployment and data pipelines. Use Monitoring for:
- Real-time Pipeline monitoring - Monitor the real-time status of Pipelines, including metrics such as data throughput. See Data Monitoring for more information.
- Performance tuning and resource utilization tracking - Get visibility into the utilization of system resources, such as CPU, memory, and network bandwidth for your nodes. Use this information to predict future resource needs and plan for capacity expansion or infrastructure upgrades as needed. Identify areas for optimization, such as tweaking Pipeline configurations or adjusting resource allocations. See Overview and System Monitoring for more information.
- Alerting and notification - View Notifications that are triggered when certain thresholds or conditions are met, such as a node going offline, data processing delays, or high error rates. Detect errors or anomalies in data processing, such as failed processing tasks, dropped events, or unexpected data patterns. See Notifications for more information.
Monitoring Page
From Cribl Stream’s sidebar, select Monitoring to access the Monitoring section of Cribl Stream. The Monitoring section has these submenus:
| Submenu | Description |
|---|---|
| Overview | Displays information about traffic in and out of the system, as well as collection jobs and tasks. It tracks events, bytes, splits by data fields over time, and broader system metrics. |
| Data | View isolated throughput data for:
|
| System | View isolated throughput data for:
|
| Reports | Examine the Top Talkers report to see your five highest-volume Sources, Destinations, Pipelines, Routes, and Packs. |
| Flows | A graphical, left-to-right visualization of data flow through your deployment. |
| Logs | Comprehensive information about an instance’s status/health, inputs, outputs, Pipelines, Routes, Functions, and traffic. |
| Notifications | Notifications alert Cribl Stream admins about issues that require their immediate attention. |
All Monitoring charts feature a local, configurable time range picker. These include charts for Sources, Destinations, Data Fields, Packs, Pipelines, Projects, Routes, and Subscriptions. Also included are system metrics like CPU Load,Free Memory, and Bytes In/Out. By default, each chart inherits the current global Monitoring time range (set from the control in the upper right of the page), but any changes you make to a chart’s local time range affect only that chart and do not change the global time range.
Overview
The Overview page is the default page of the Monitoring section. It displays multiple dashboards with information about traffic in and out of the system, as well as collection jobs and tasks. It tracks events, bytes, splits by data fields over time, and broader system metrics.
The initial view shows aggregate data for all Worker Groups and all Workers. You can use the drop-downs at the upper right to isolate individual Worker Groups, or individual Workers.
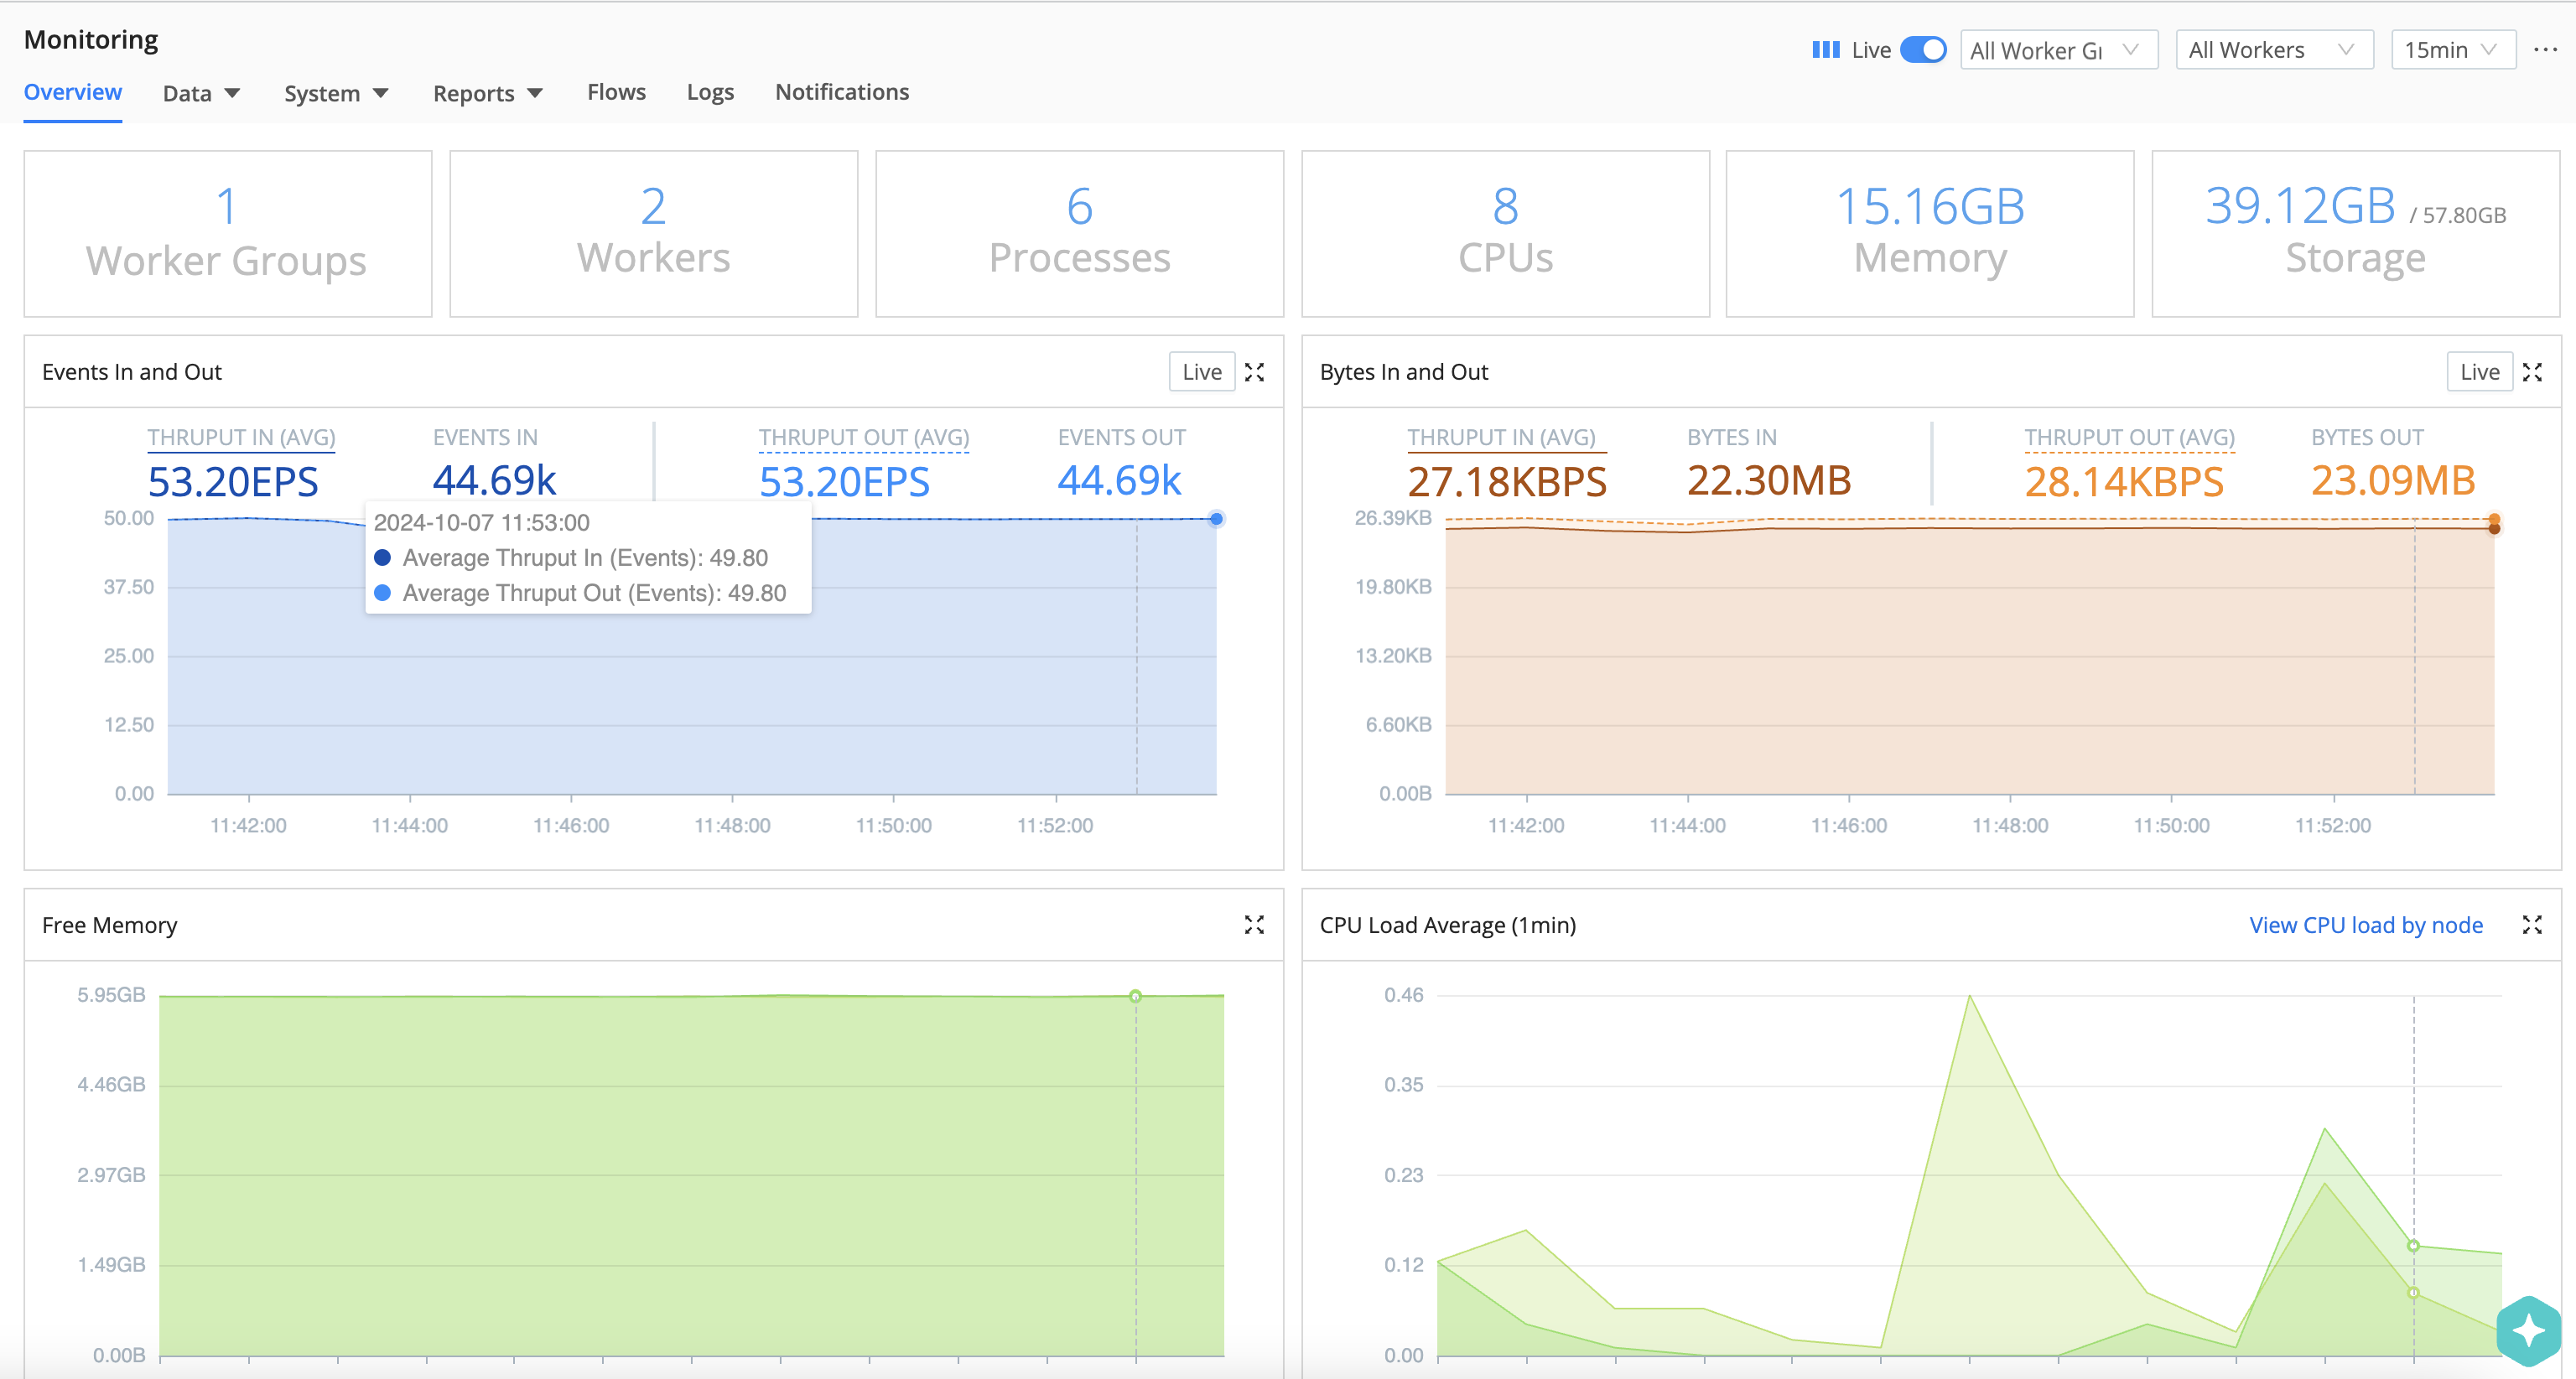
Using the drop-down menu at the upper right, you can change the time range shown in the Overview display from the default 15 min, selecting time ranges from 5 min up to 1 day. The 1 day setting covers the preceding 24 hours, and this maximum window is not configurable. You can also select @midnight, which displays data beginning at midnight on the current day. In addition, each Overview chart includes its own local time range picker, which starts from the current global time range but can be adjusted per chart without affecting the global selection.
Vertical lines across each chart display configuration changes. Click anywhere on the line to view summary information including time, data, and configuration versions.
Except for these configuration change markers, Monitoring data does not persist across Cribl Stream restarts. Keep this in mind before you restart the server.
Storage and Memory Calculations
The displayed Storage tile (upper right) represents the amount of free storage remaining on the partition that hosts Cribl Stream. (This quantity might not represent the maximum storage available for the selected Worker or Group. Also, it does not calculate the system free space.)
Similarly, the Free Memory graph reflects only the operating system’s free statistic, matching Linux’s strict free definition by excluding buff/cache memory. So this graph indicates a lower value than the OS’ available memory statistic - and it does not necessarily indicate that the OS is running out of memory to allocate.
The Cribl Stream user interface displays metrics in units of KB, MB, GB, and TB. At each level, these are multiples of
1024.
Byte Calculations
Byte-related charts show the uncompressed amounts and rates of data processed over the selected time range:
- Events (total) in and out
- Events per second in and out
- Bytes (total) in and out
- Bytes per second in and out
You can control the selected time range globally from the Monitoring page, or per chart using the local time range picker.
When Cribl Stream receives data from a Source:
- Bytes in gets counted after deserializing and event breaking.
- Most Sources generate a
_rawstring. For these sources, bytes are counted as the length of the_rawstring. - For Sources that do not generate a
_rawstring, bytes are counted as the size of the__bytesfield, such as for metrics and network flows. In this case,__byteswill represent the size of the raw bytes read in, before being parsed into event fields. - Byte count does not include the size of any fields other than
_raw.
When Cribl Stream sends data to a Destination:
- For most typical Destinations, Cribl Stream calculates the bytes out based on the outgoing payload (typically a JSON string) prior to compression. A JSON-based destination will count the length of the JSON string post-serialization. This string would not include any internal fields or any fields that the Destination does not serialize, even if they are present on the event.
- For these typical Destinations, what is actually serialized may still differ. For example, protobuf-based Destinations will count the protobuf-encoded bytes, but a JSON-based Destination will count the length of the JSON string post-serialization. The result is that the same event may have two different reported bytes counts, depending on which Destination the event is sent through.
- However, some Destinations are exceptions to the typical bytes out calculation. These are the possible alternative calculation scenarios. For some Destinations, Cribl Stream calculates the byte count in one of the following ways:
- The length of
_raw, when sent as plain text instead of JSON. - A static number of bytes per event. For example, when sending metrics to Splunk using S2S.
- The length of the stringified JSON, including all internal (__*) fields.
- The length of
See the documentation for a specific Destination for more information on the bytes out calculation.
CPU Load Calculations
The displayed CPU Load Average is an average per Worker Process, updated at 1-minute granularity. (It is not an average for the Worker Node as a whole.)
Use the local time range picker on the CPU Load chart to narrow or expand the time window for analyzing load trends, independently of the global Monitoring time range.
Select View CPU load by node to open a modal showing CPU usage per Worker.
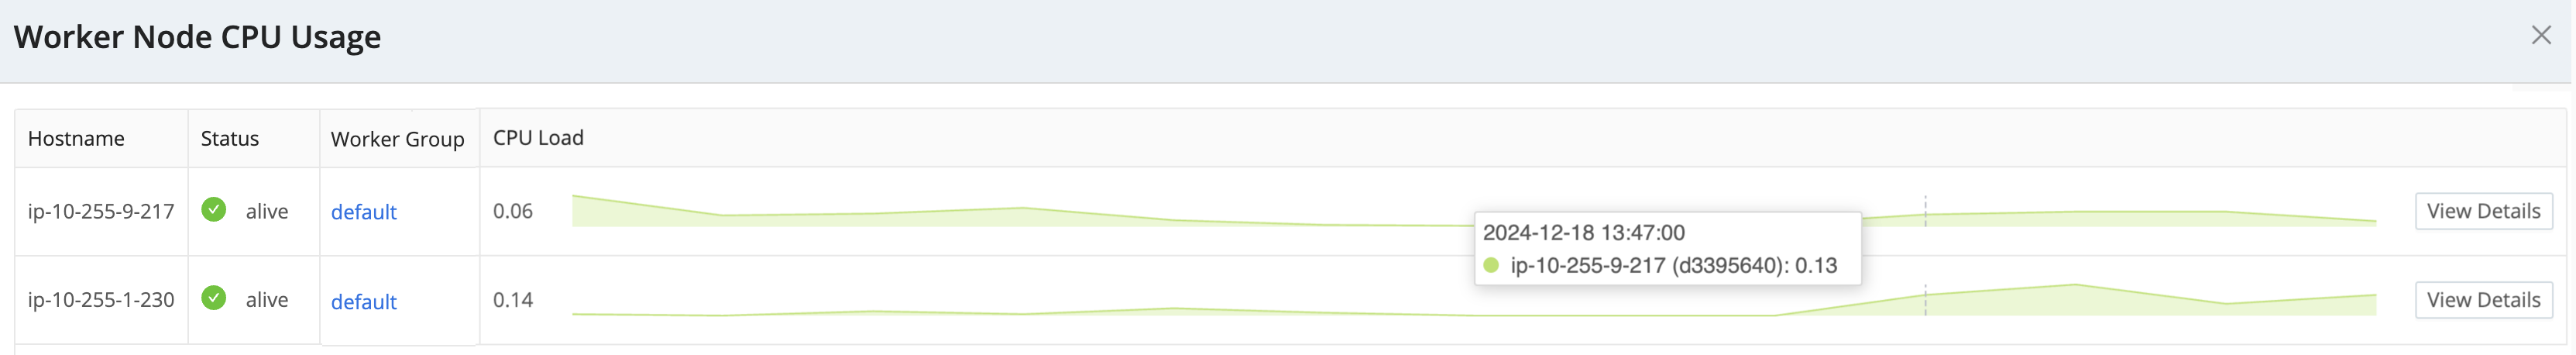
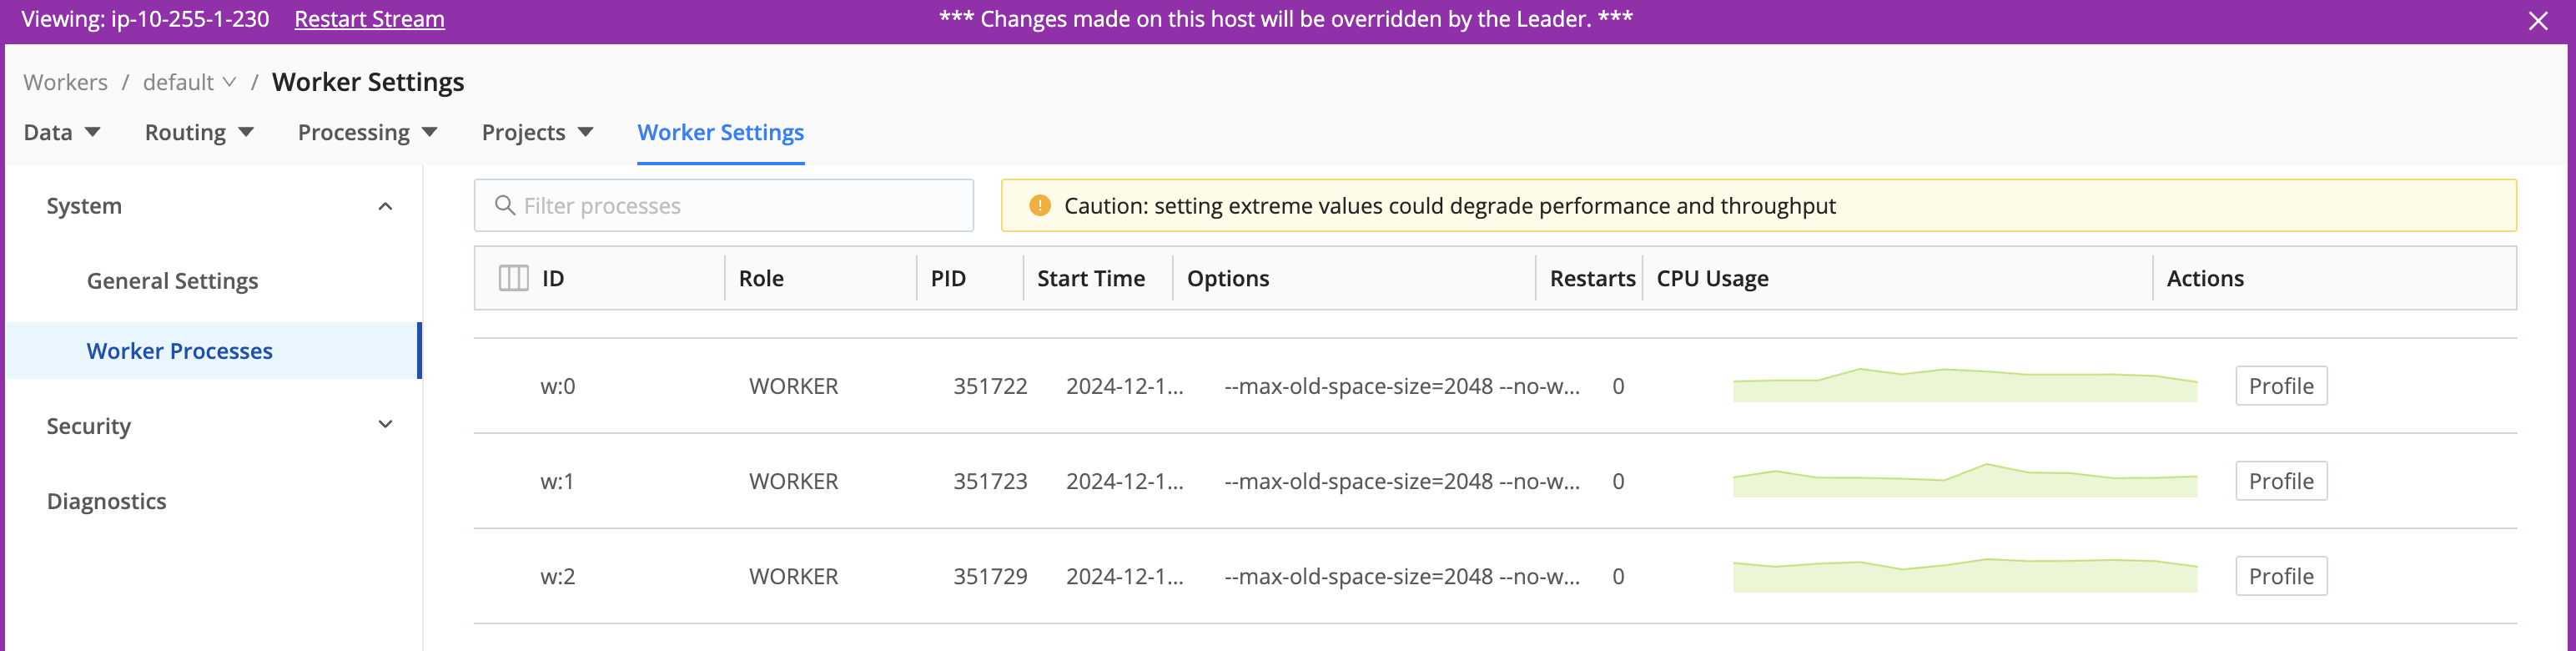
Select a View Details button to access a Worker Node’s Worker Settings, with details per Worker Process. (To enable this button, you must first enable the parent Group’s Remote UI Access.)
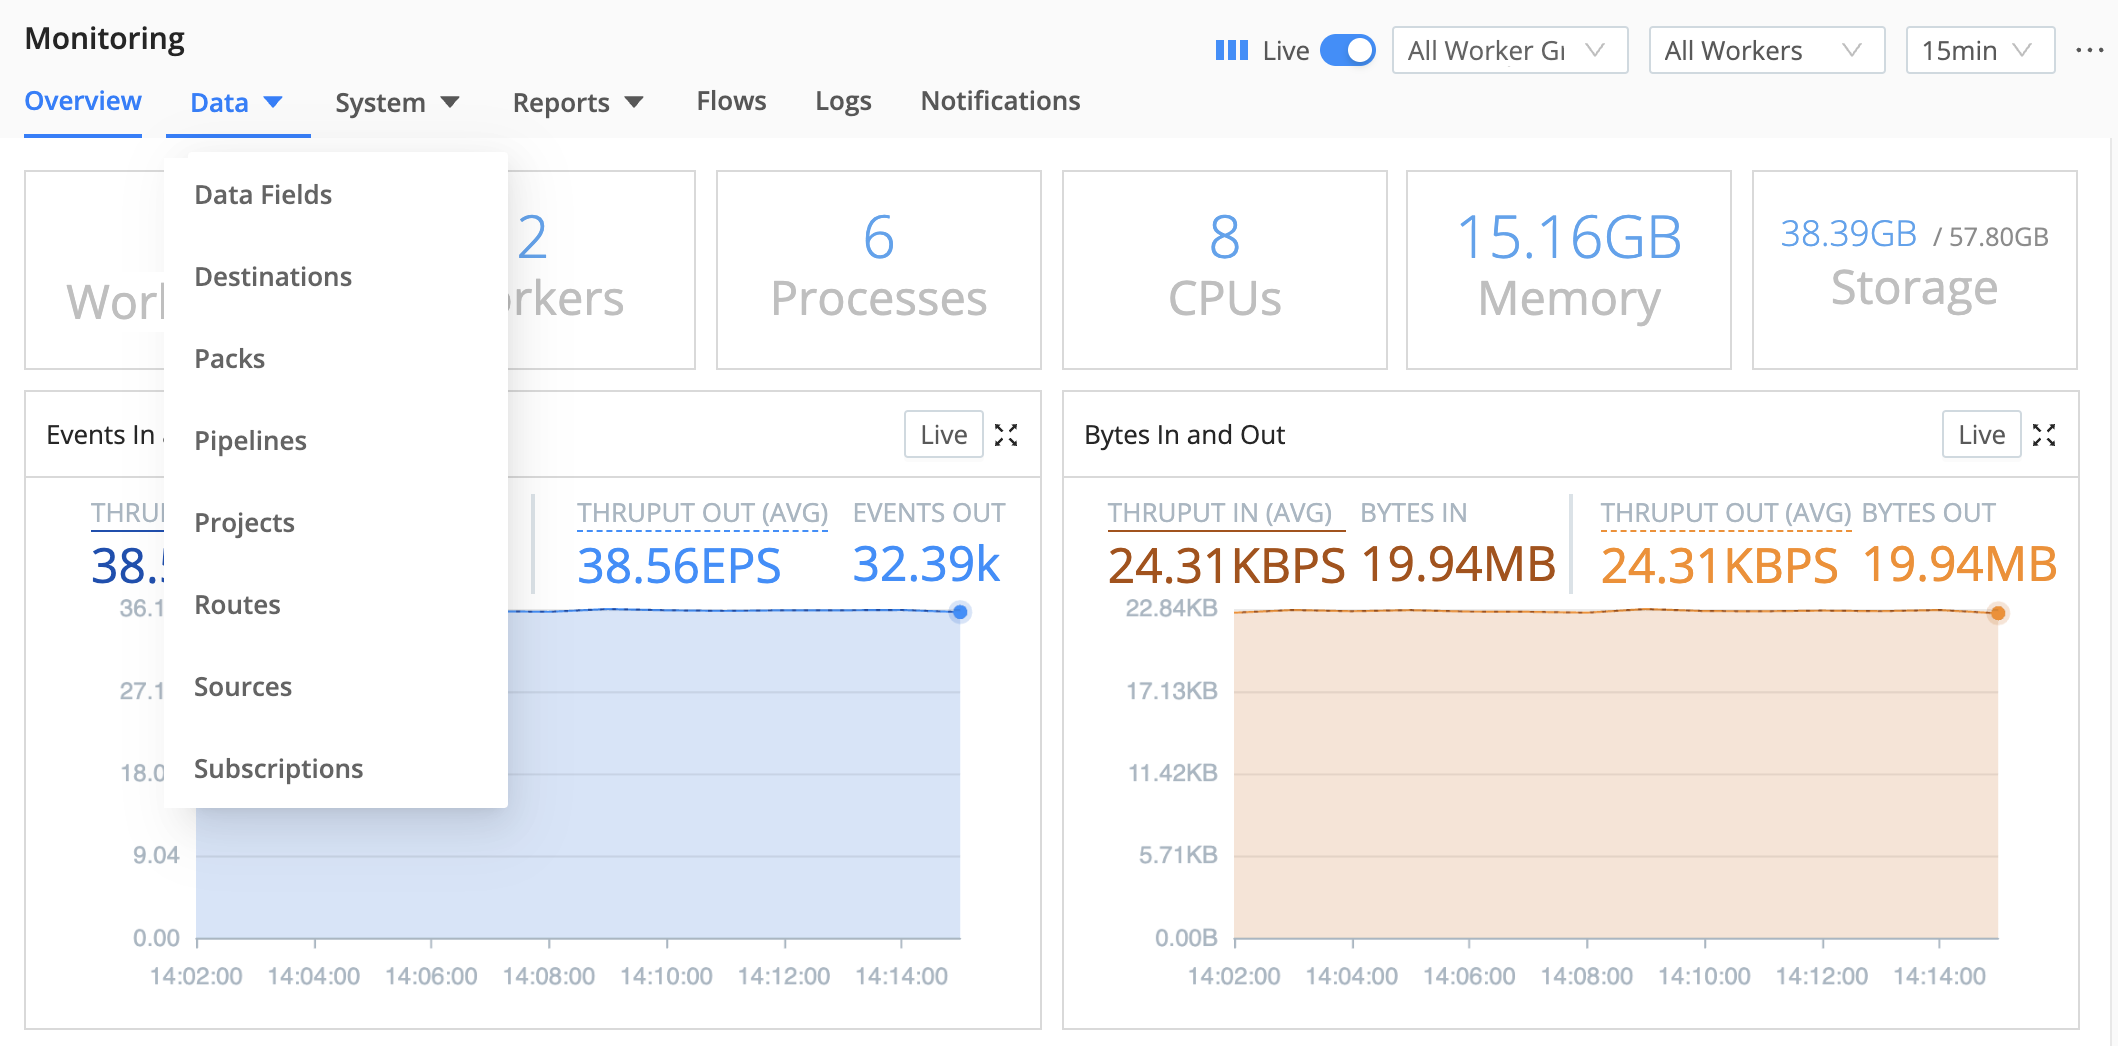
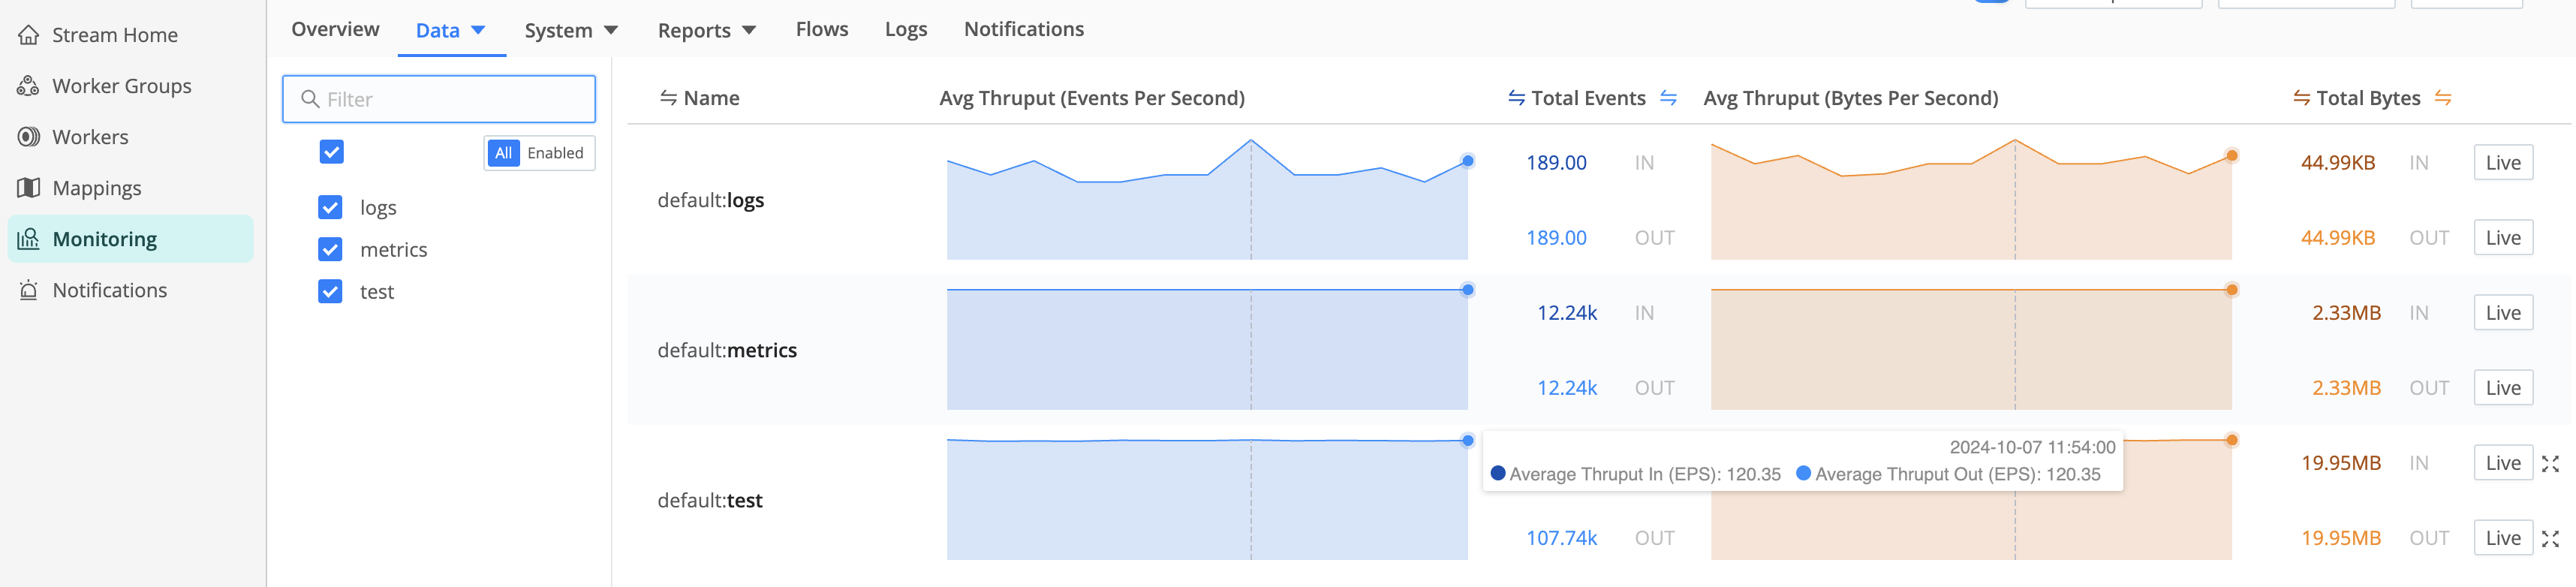
Data
From the Monitoring page, open the Data submenu to isolate throughput for any of the following:
- Data Fields
- Destinations
- Packs
- Pipelines
- Projects
- Routes
- Sources
- Subscriptions
All Monitoring > Data views inherit the global Monitoring time range by default, and each chart on these pages also exposes a local time range picker you can use to zoom in or out on a specific chart without changing the global time range or other charts.
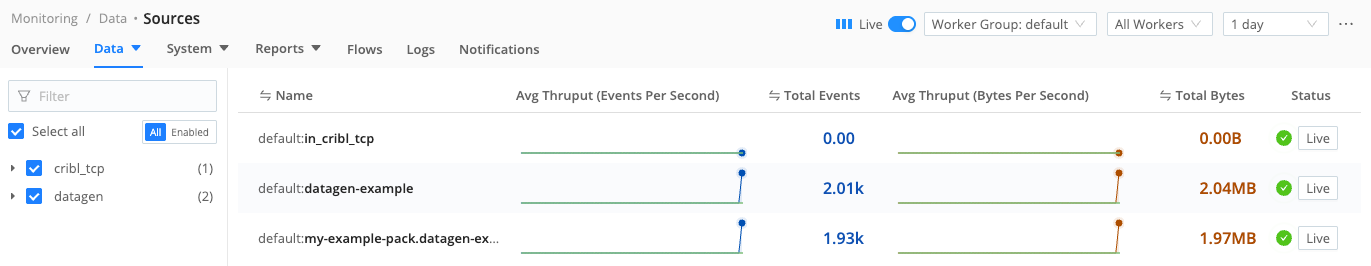
The Monitoring page provides a consolidated view of metrics for all resources (Sources, Destinations, Pipelines, Routes), including those contained within Packs. To distinguish between resources with identical IDs across different contexts, Cribl Stream uses a namespacing schema. Resource names are prefixed according to their location in your deployment:
| Context | Resource name syntax | Example |
|---|---|---|
| Worker Group | Worker-Group/Fleet-name:resource-name | default:my-syslog-example |
| Pack | Worker-Group/Fleet-name:Pack-name.resource-name | default:my-pack.my-syslog-example |
This allows you to filter metrics by a specific Worker Group or Pack using the prefixes.
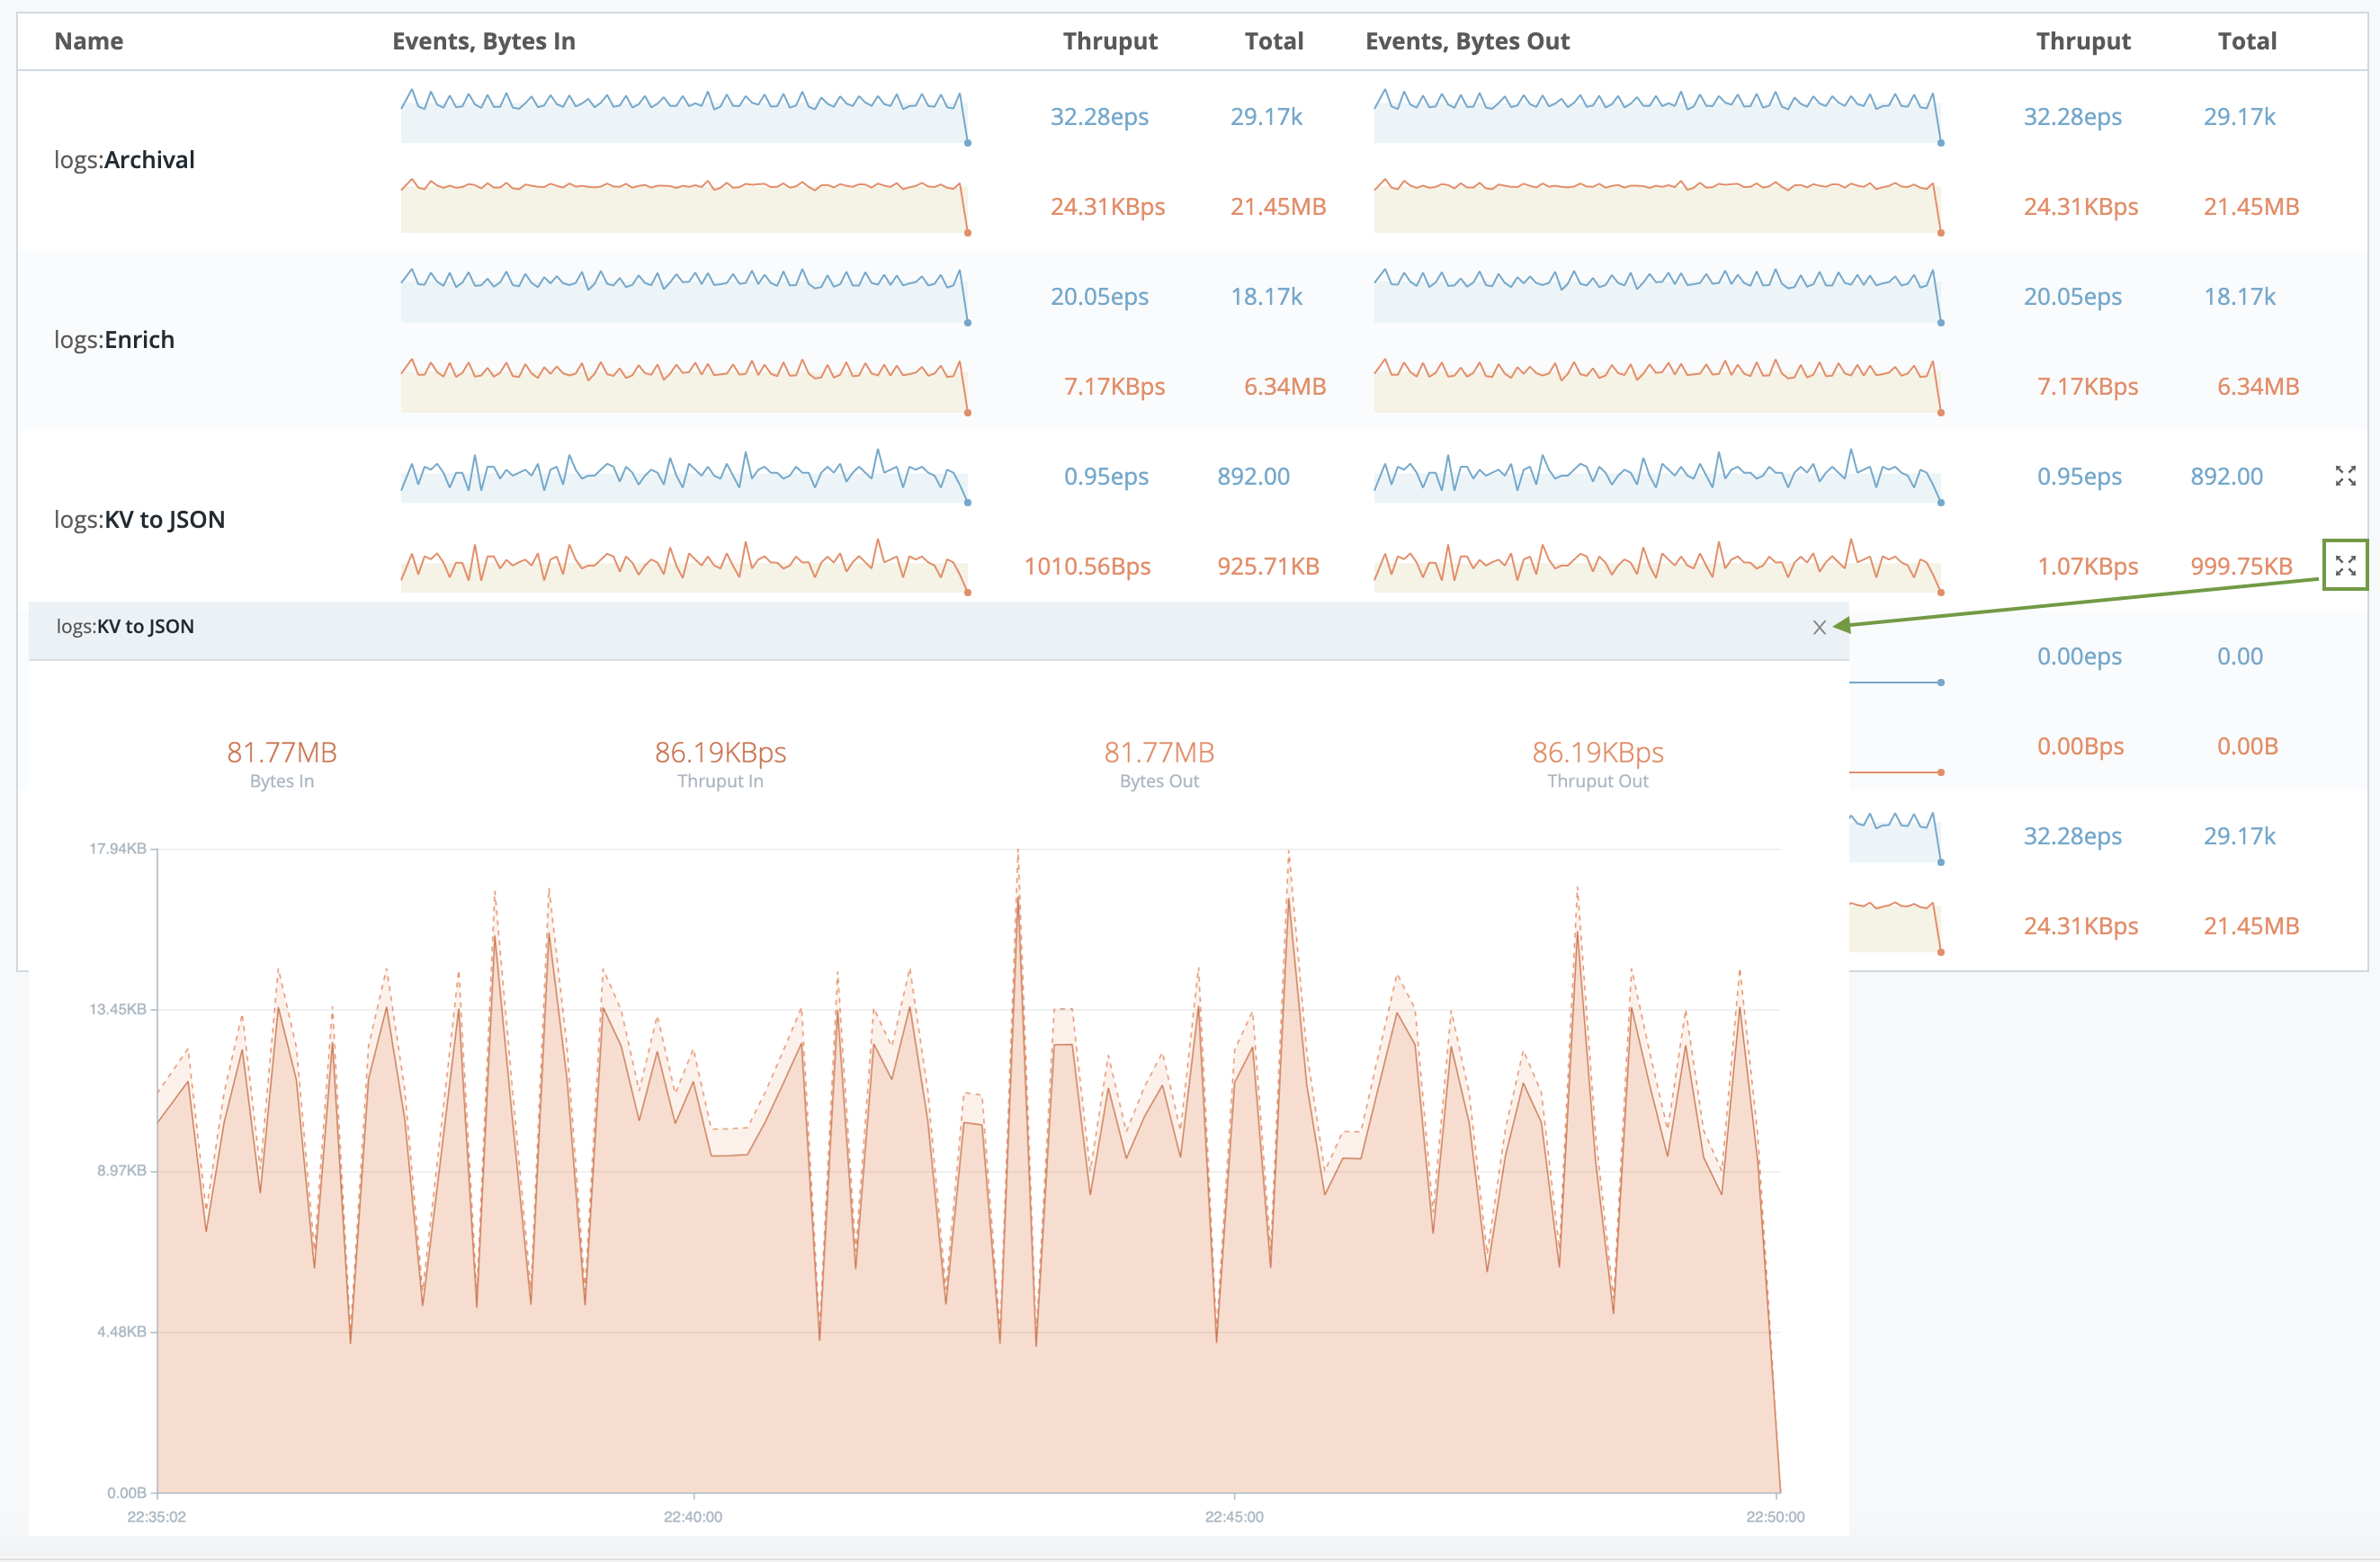
Sparklines
Dense displays are condensed to sparklines for legibility. Hover over the right edge to display Maximize buttons that you can select to zoom these up to detailed graphs.
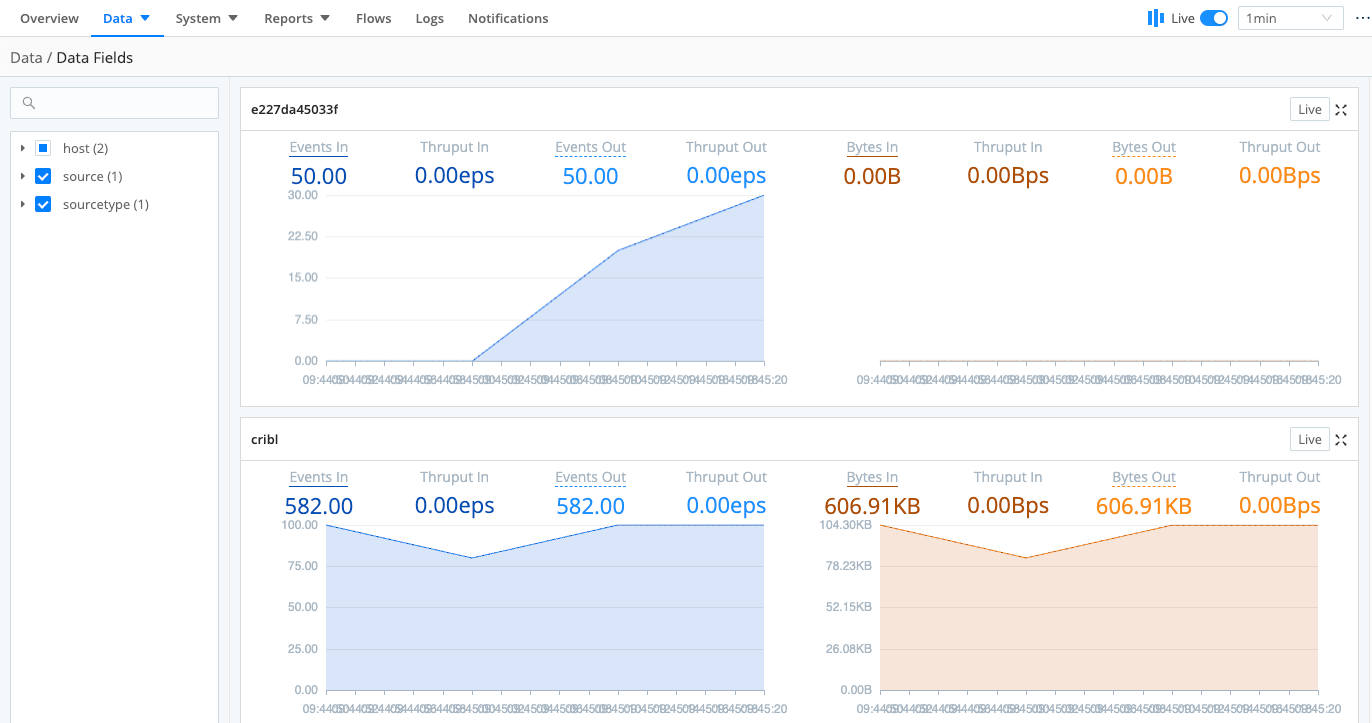
Data Fields
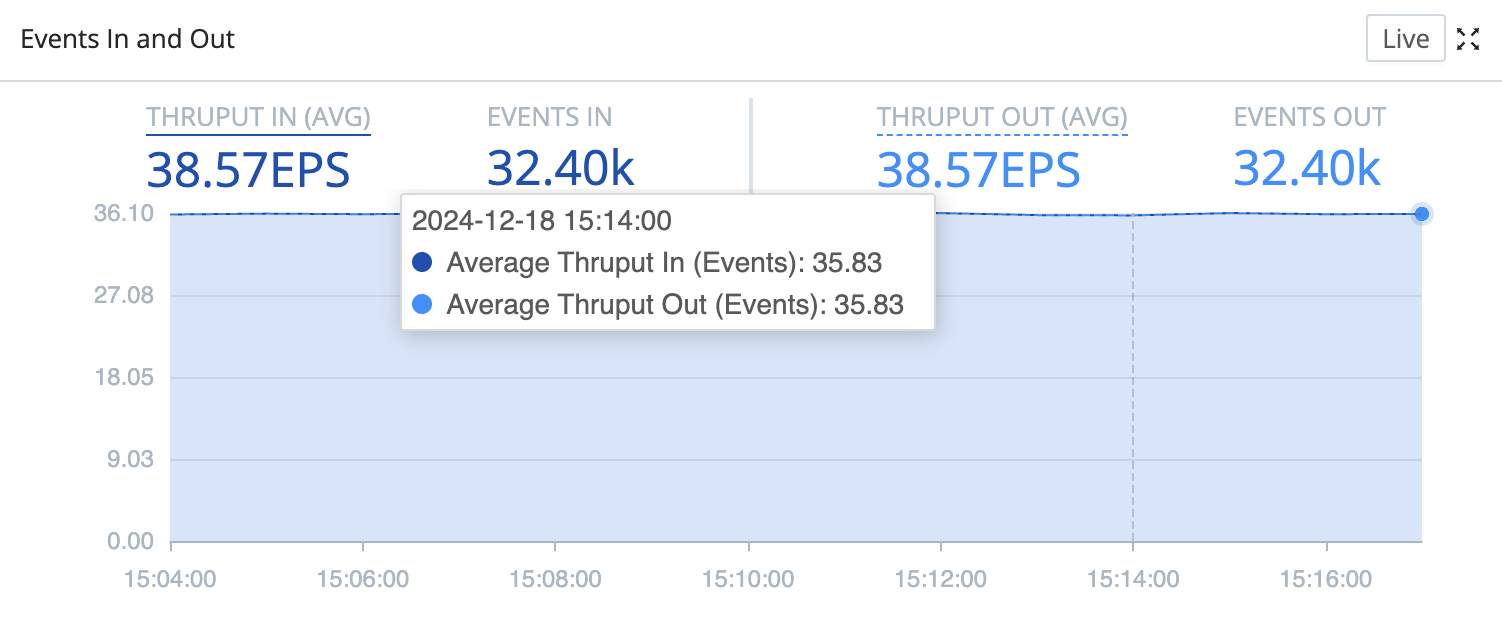
The Data Fields page lets you preview the flow of events that contain a specific data field. The left (blue) side summarizes events in/out. The right (orange) side summarizes bytes in/out.
To control which data fields get included in these graphs, use the Disable field metrics setting.
Disable field metrics settings are not available on Cribl.Cloud-managed Worker Nodes.
Routes
The Routes page condenses multiple details and options:
- Each row independently summarizes throughput for a separate Route.
- The left (blue) side summarizes events in/out. The right (orange) side summarizes bytes in/out.
- On each row, the top number summarizes average events/bytes into the Route, and the bottom number summarizes events/bytes out. Both are averaged over your selected time range.
- On each row, the upper Maximize button zooms up the left (events) graph, and the lower Maximize button zooms up the right (bytes) graph.
Fly-Out Details
You can hover over graphs to display a fly-out with details. The Free Memory and CPU Load Average graphs only display fly-outs for up to 10 Worker Nodes, even when more Nodes are active. These fly-outs will occasionally show transient 0 metrics for some Workers, because Cribl Stream prioritizes reporting current throughput over memory/load metrics.
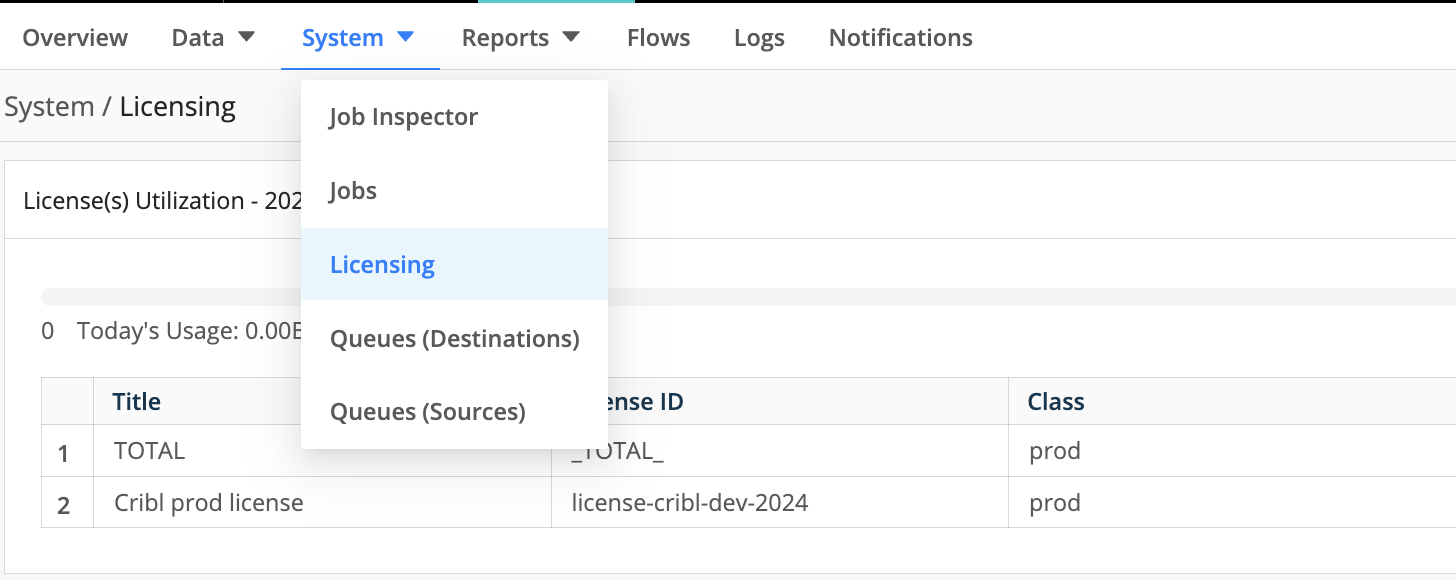
System
From the Monitoring page, open the System submenu to isolate throughput for any of the following:
- Job Inspector
- Jobs (and tasks in-flight, see Collector Sources)
- Leaders (available only with High Availability enabled)
- Licensing (on-prem deployments only)
- Queues (Destinations)
- Queues (Sources)
Charts under Monitoring > System (including CPU Load, Free Memory, queue utilization, and related system metrics) use the global Monitoring time range by default and also provide local time range pickers on each chart so you can refine the time window for a specific metric without altering the global setting.
Job Inspector
Select System then Job Inspector from the Monitoring page to view and manage pending, in-flight, and completed collection jobs and their tasks. For details about the resulting page, see Monitoring and Inspecting Collection Jobs.
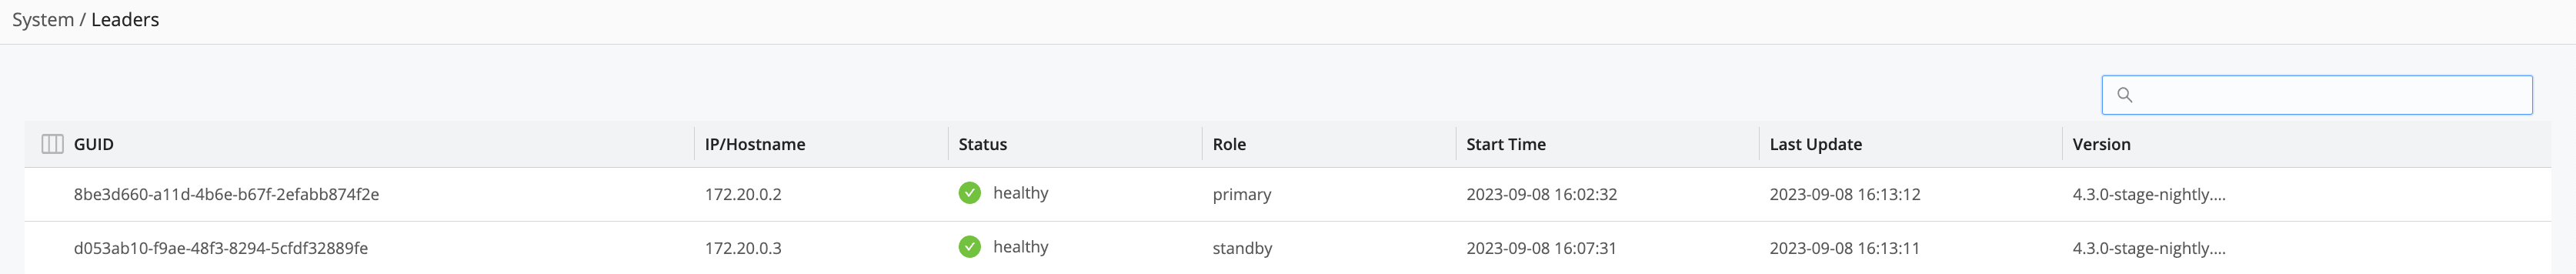
Leaders
This menu item is available only in Distributed Deployments with High Availability (HA) enabled.
Select Monitoring, then System and Leaders to view the status of your Leader Nodes. For more information on how to configure a second Leader Node for failover/durability, see Leader High Availability/Failover.
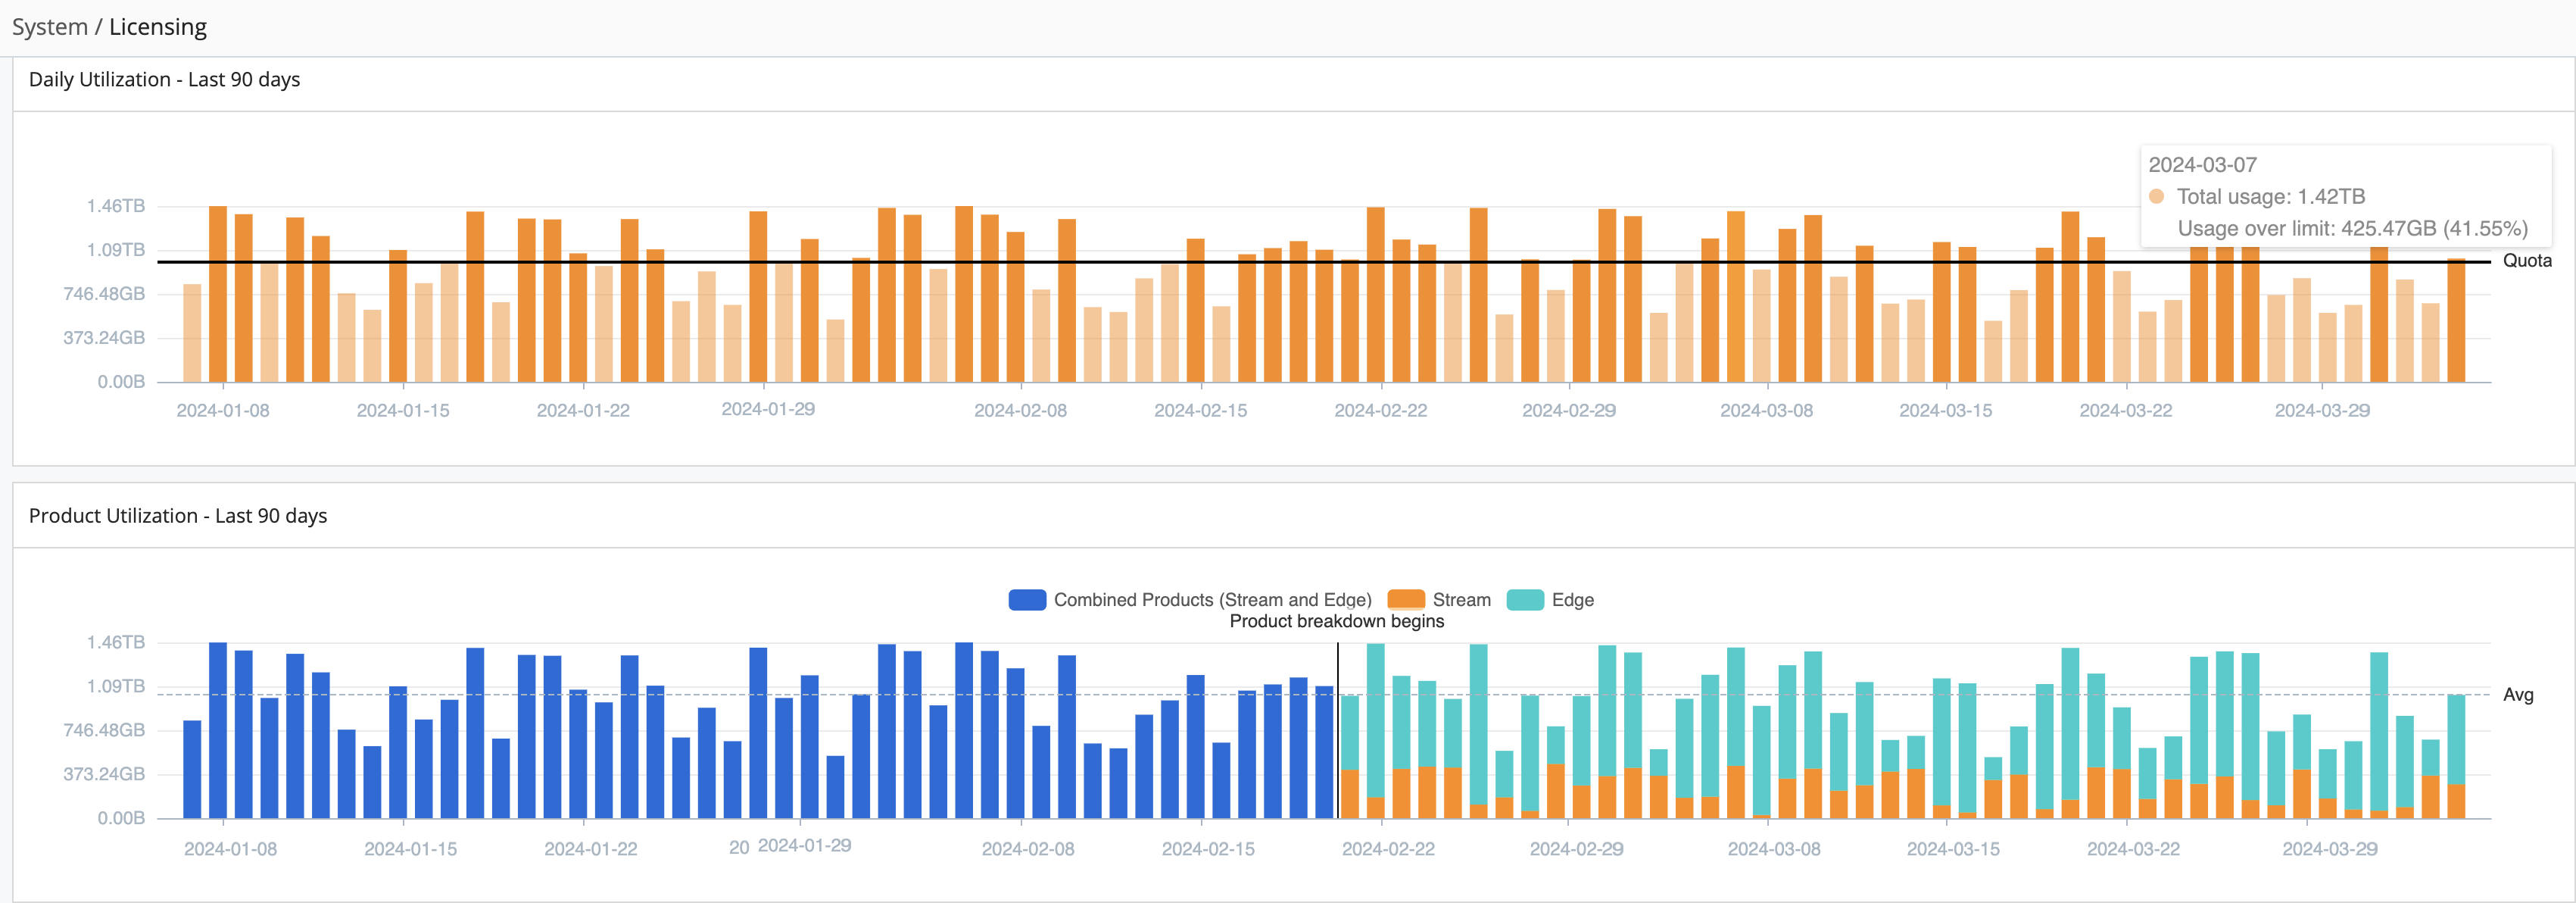
Licensing
Select System, then Licensing from the Monitoring page to check the expiration dates of your licenses, daily data throughput, and events quotas. You can also compare your daily Cribl Stream and Cribl Edge data throughput against your license quota - and against granular and average throughput over the last 30 to 365 days.
In this graph, you’ll see the following:
- A horizontal bar that indicates your quota limit.
- Legacy data is represented by blue bars that show licensing usage in versions older than 4.6.0. Starting in v.4.6.0, the system separated the data, displaying Cribl Edge usage in teal and Cribl Stream usage in orange. If only Cribl Stream is used, Cribl continues to display usage with blue bars.
- Tooltips display details about data usage, data amount over/under license quota, Cribl Edge dropped bytes, and data percentage over/under license quota.
- Dots on the daily usage bar graph represent configuration changes in the system.
- The Daily Events In chart only shows events that count towards your license, broken out by product (Cribl Stream and Cribl Edge). It filters out
datagen,cribl_http, andcribl_tcpevents.
Even on single-instance deployments, you must have
gitinstalled in order for the Monitoring > Licensing page to display configuration change markers.For the most current and accurate throughput data, enable the Cribl Internal Source’s CriblMetrics option. Forward metrics to your metrics Destination of choice, and run a report on
cribl.total.in_bytes. CriblMetrics aggregates metrics at the Worker Process level, every 2 seconds.
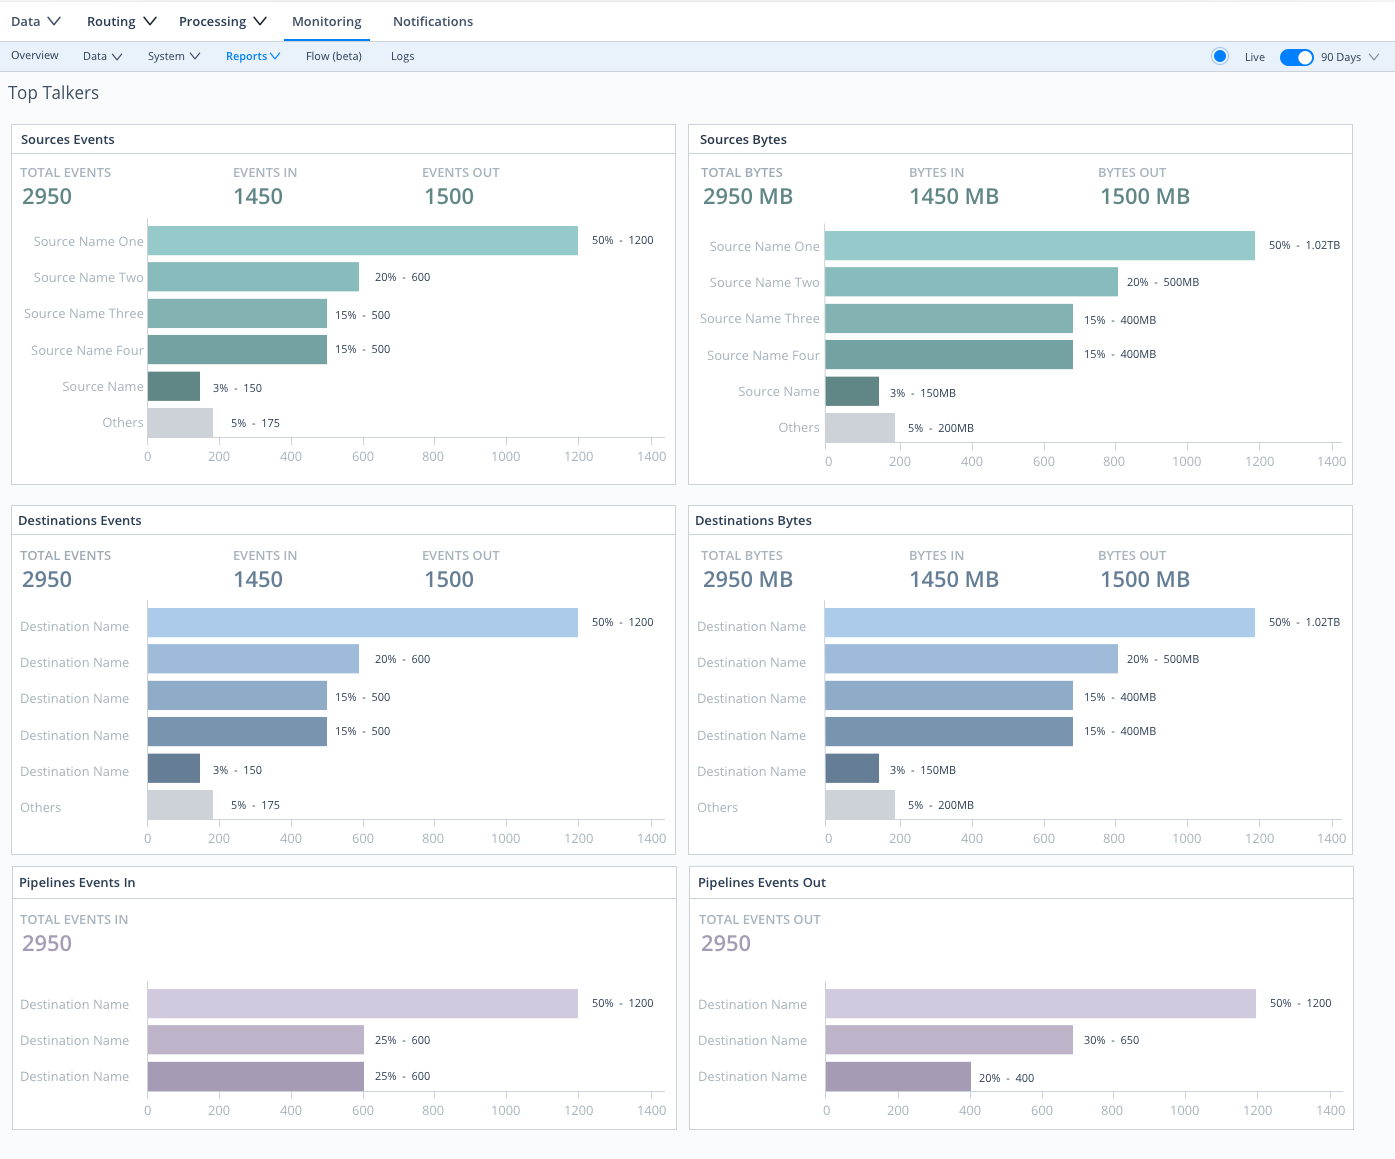
Reports
Select Monitoring > Reports / Top Talkers > Top Talkers, where you can examine your five highest-volume Sources, Destinations, Pipelines, Routes, and Packs. Cribl Stream ranks all components by events throughput. Sources and Destinations get separate rankings by bytes in and out, respectively.
Flows
Select Flows from the Monitoring page’s submenu or ••• overflow menu to see a graphical, left-to-right visualization of data flow through your Cribl Stream deployment.
Logs
Select Logs from the Monitoring page submenu to access the log viewer. This view lists the internal logs generated by Cribl Stream, which are records of various system events. Use these logs to monitor the health of your Cribl Stream deployment and troubleshoot operational issues.
Each log is structured data containing specific fields about the event that generated it. See Internal Logs for detailed information about the available logs and fields.
You can filter and analyze the list of log events to find specific data:
- Filter by log type: Use the main menu to select a type of log to view (such as the API Process, Access, Audit).
- Search with expressions: Enter a JavaScript expression in the main search bar to filter logs.
- Interact with log events: On the list of logs, you can select an event from an individual field to:
- Add or exclude that field from the search bar.
- Copy the event value to your clipboard.
Notifications
Notifications alert Cribl Stream admins about issues that require their immediate attention, such as alerts for Sources and Destinations and upcoming license expiration dates. You can view all Notification events on this tab. See Notifications for more information about available Notifications and how to configure them.
Types of Logs
Cribl Stream produces several categories of internal logs:
- API Server Logs: Generated by the main
API/mainprocess and written under$CRIBL_HOME/log/. For example,cribl.log,access.log,audit.log,notifications.log,ui-access.log. - Worker Node Process Logs: Generated by Worker Node processes and written under
$CRIBL_HOME/log/worker/<N>/...on each Worker Node. - Worker Group Logs: Generated by processes that manage configuration for Worker Groups, typically under
$CRIBL_HOME/log/group/<GROUPNAME>/.... - Service Process Logs on Leader Nodes: Generated by supporting services such as connections, metrics, notifications, and others, typically under
$CRIBL_HOME/log/service/<serviceName>/.... - Stderr-based Logs: Generated when certain processes encounter fatal errors, including
cribl_stderr.log.
Use the Monitoring > Logs page to search across these logs from the UI. For a complete list of internal log types, their locations, and their rotation behavior, see Internal Logs.
Forward Logs and Metrics Externally
Cribl Stream supports forwarding internal logs and metrics to your preferred external monitoring solution. The Cribl Internal Source captures internal logs and metrics to send to Destinations.
In the following steps, we’ll use the graphical QuickConnect UI to set up the Cribl Internal Source and how data is sent to your Destination. See Cribl Internal for details on how to instead configure the Cribl Internal Source via the Data > Sources (Stream) or More > Sources (Edge) submenus.
- On the top bar, select Products, and then select Cribl Stream. Then select a Worker Group to configure.
- To open QuickConnect: Stream - select the QuickConnect tile on the Overview page. Edge - select the Collect submenu.
- Select Add Source.
- From the resulting drawer’s tiles, select System and Internal, then hover over the Cribl Internal tile.
- Select Select Existing.
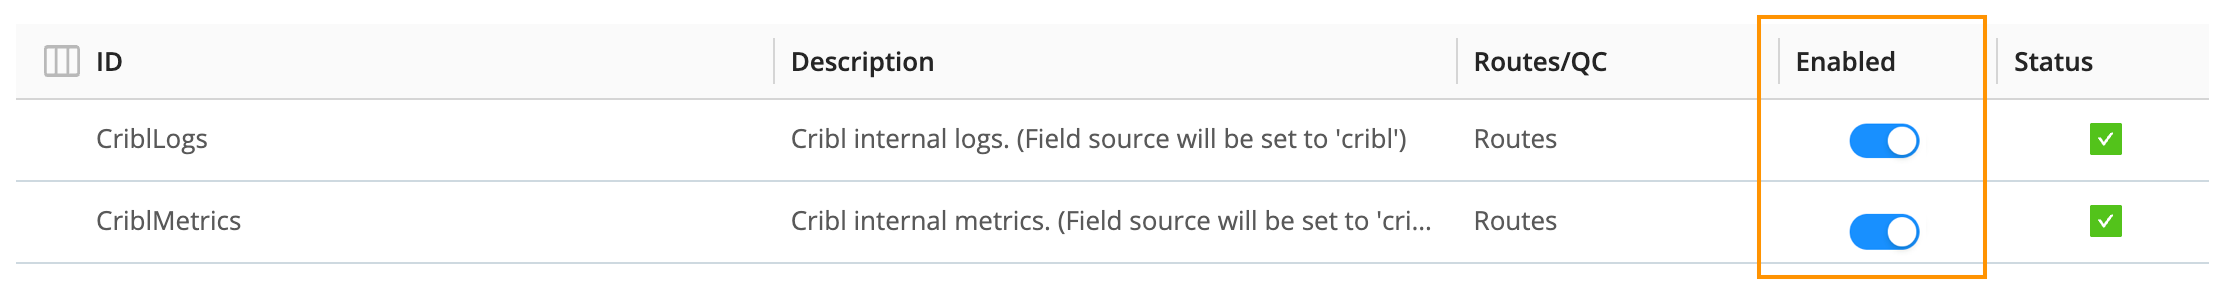
- On the CriblLogs and/or the CriblMetrics row, toggle Enabled on. Confirm your choice in the resulting message box.
- Notice how the Routes/QC column still says Routes. We want to use QuickConnect, so we’ll change this by clicking on the CriblLogs and/or the CriblMetrics row again. Once clicked, you’ll confirm Yes to the message box asking to switch the Source to send to QuickConnect instead of Routes.
- Select and drag the + button on the right side of the Source to your desired Destination. A Connection Configuration modal will prompt you to select a Passthru, Pipeline, or Pack connection. See QuickConnect for details.
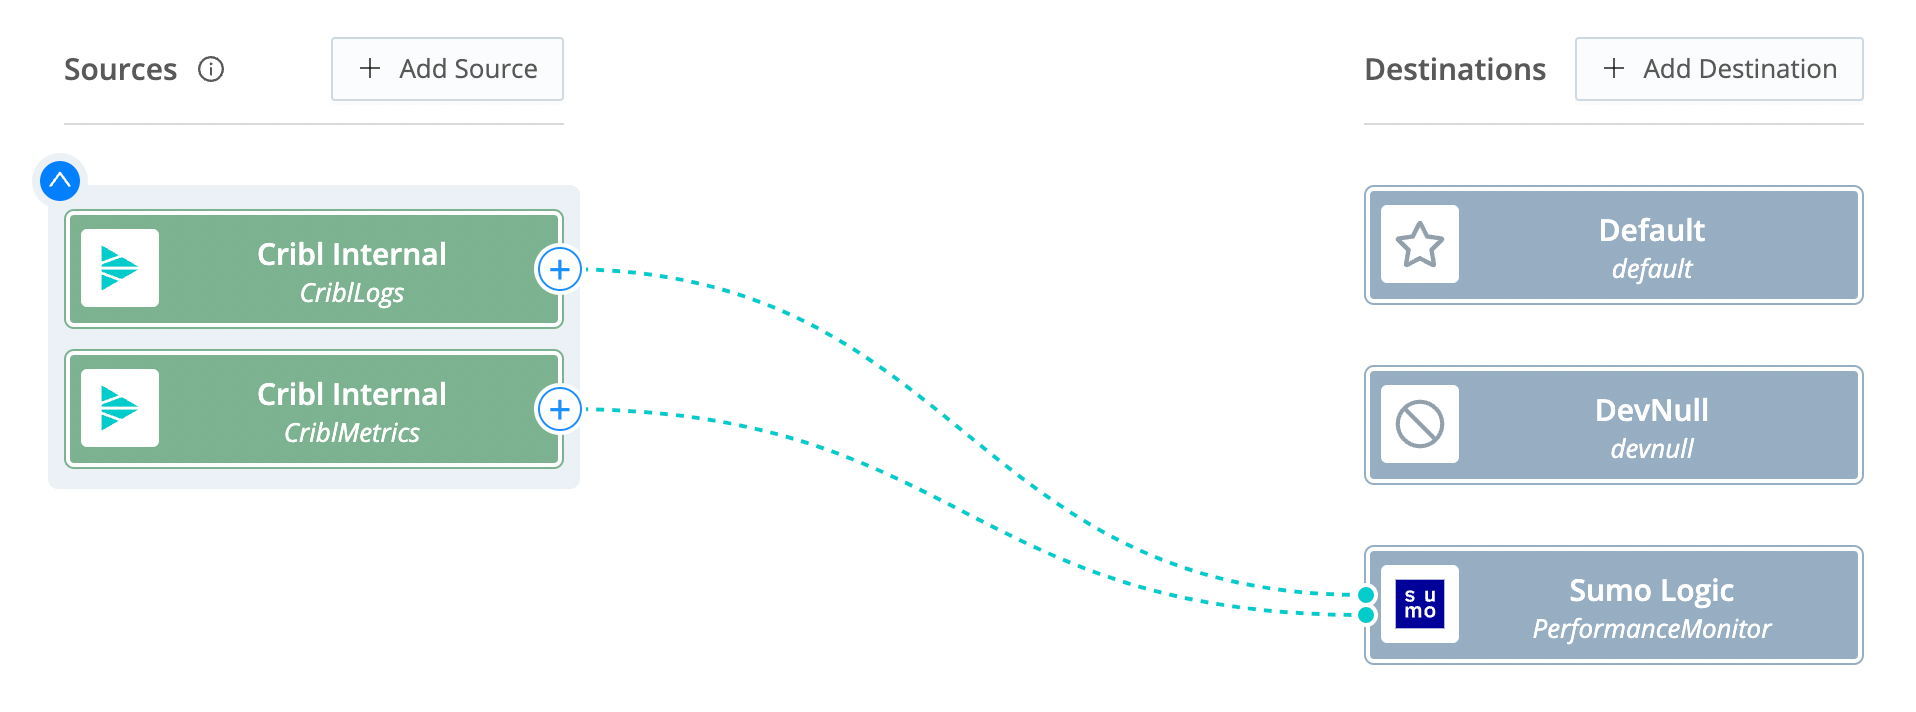
- This will send internal logs and metrics to your Destination, just like another data Source. Both logs and metrics will have a field called
source, set to the valuecribl, which you can use in Routes’ filters.
Note that the only logs supported here are Worker Process logs (see Types of Logs above). You can, however, use a Script Collector to listen for API Server or Worker Group events.
For recommendations about useful Cribl metrics to monitor, see Internal Metrics.
Controlling Metrics Volume
To reduce the volume of metrics sent through Cribl Stream, see options on the Cribl Internal Source.
Disable Field Metrics
To send fewer metrics to the Leader Node, you can disable specific metrics types.
By default, Cribl Stream does not send metrics for the host, source, sourcetype, index, and project fields.
You can remove any of these defaults, or add other fields you do not want to send as metrics.
To do this, specify the fields in the Disable field metrics blocklist in two places:
- In Settings > Global > System > General Settings > Limits > Metrics.
- Per Worker Group, in Worker Group Settings > System > General Settings > Limits > Metrics.
However, when you enable the Cribl Internal Source, Cribl Stream ignores this Disable field metrics setting, and full-fidelity data will flow down the Routes.
The Disable field metrics setting is not available on Cribl-managed Worker Groups in Cribl.Cloud. The Group Settings > System > General Settings > Limits > Metrics path is not exposed on these Groups, where Cribl manages metrics limits for you. This setting applies only to customer-managed hybrid and on-prem Worker Groups.
Dropping Metrics
When the number of in-flight requests for sending metrics from Worker to Leader exceeds a limit (1,000 requests),
Workers will stop sending metrics. Check channel="clustercomm" for a log of dropped metrics if needed.
You can exclude certain metrics from being dropped due to exceeding limits. Specify these metrics at Settings > System > General Settings > Limits > Metrics > Metrics never-drop list.
This setting is available only on Worker Nodes.
The Metrics never-drop list setting is not available on Cribl-managed Worker Groups in Cribl.Cloud. The Group Settings > System > General Settings > Limits > Metrics path is not exposed on these Groups, where Cribl manages metrics limits for you. This setting applies only to customer-managed hybrid and on-prem Worker Groups.
Metrics Garbage Collection
Metrics garbage collection (GC) runs when the total number of stored metrics exceeds the max metrics limit (default 1,000,000). Metrics are then removed, starting with the oldest ones. This happens both on Workers and Leaders.
You can define how often to run garbage collection on each Worker Group. Select Group Settings > System > General Settings > Limits > Metrics > Metrics GC period. The default is 60 seconds.
The Metrics GC period setting is not available on Cribl-managed Worker Groups in Cribl.Cloud. The Group Settings > System > General Settings > Limits > Metrics path is not exposed on these Groups, where Cribl manages metrics limits for you. This setting applies only to customer-managed hybrid and on-prem Worker Groups.
Metrics Tracking by Worker ID
Typically, Cribl Stream assigns all metrics their own Worker Node ID dimensions so they can be split by Worker if needed.
You can define which metrics are not assigned a Worker Node ID dimension by adding them to the list at Group Settings > System > General Settings > Limits > Metrics > Metrics worker tracking.
Control Metrics Lag and Disk Usage
If one or more Worker Groups has a large number of enabled Sources, and clicking into these Sources does not promptly display their status, a workaround is to prevent Cribl Stream from writing metrics to disk. On the Leader (versions 4.1.2 and newer), navigate to Settings > Global Settings > System > General Settings > Limits > Storage, and disable the Persist metrics toggle. Then restart the Leader.
If you keep Persist metrics enabled, you can use the adjacent Metrics max disk space field to control the written metrics’ footprint. This threshold defaults to 64 GB.
Cardinality Limit
You can define the cardinality limit or metrics on each Worker Group. Select Group Settings > System > General Settings > Limits > Metrics > Metrics cardinality limit The default is 1,000.
Refer to Monitoring > Data > Data Fields to identify the fields that have the highest cardinality.
Search Internal Logs
Cribl Stream exists because logs are great and wonderful things! Using Cribl Stream’s Monitoring > Logs page, you can search all Cribl Stream’s internal logs at once - from a single location, for both Leader and Worker. This enables you to query across all internal logs for strings of interest.
The labels on this screenshot highlight the key controls you can use (see the descriptions below):
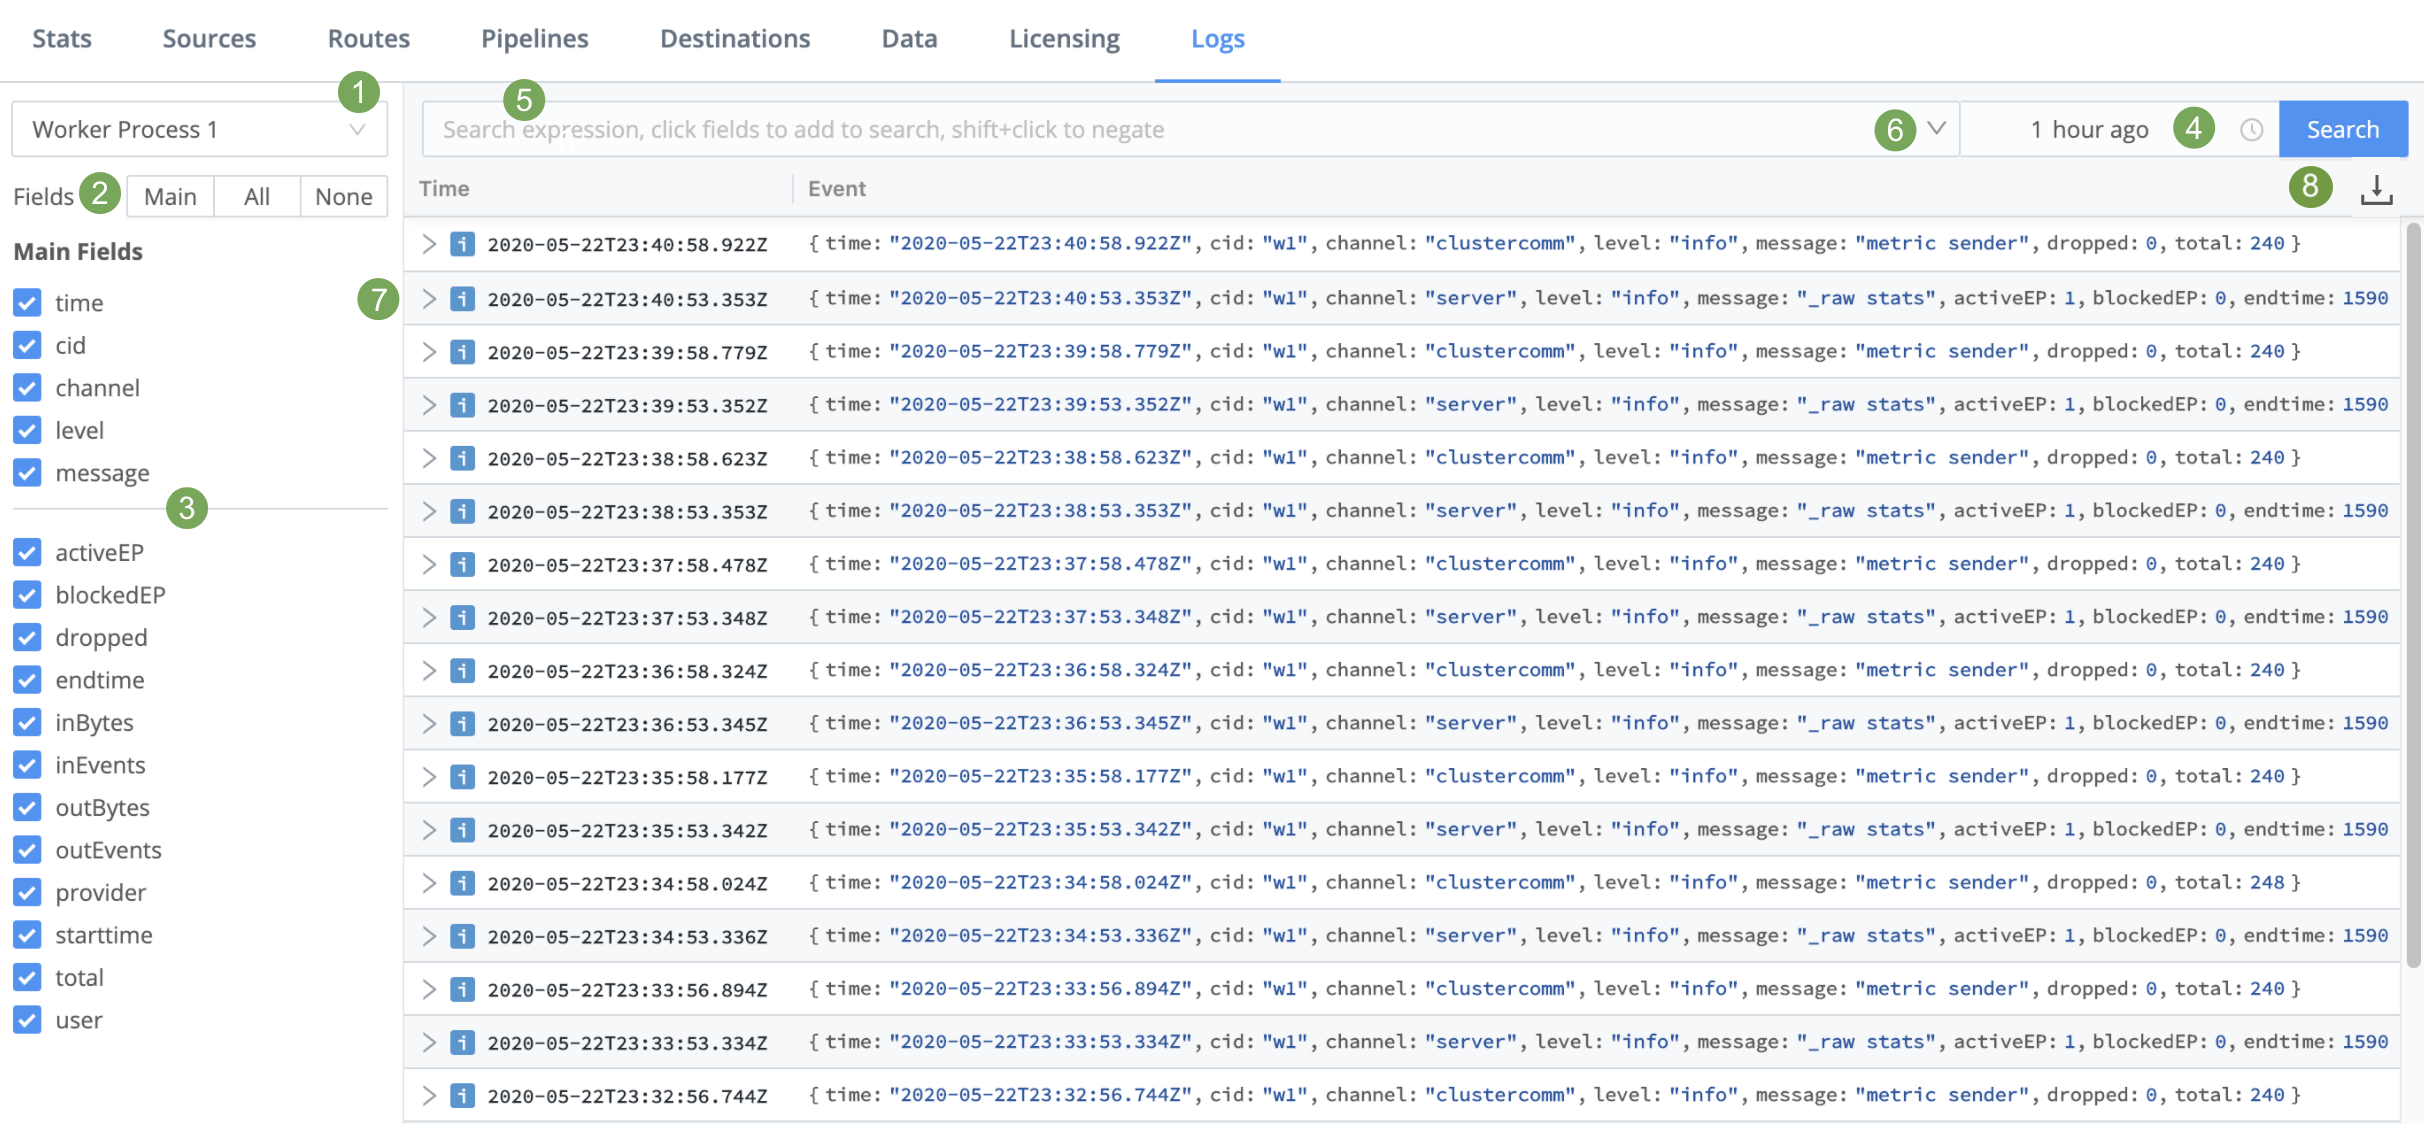
Log file selector: Choose the Node to view. In a distributed deployment (Stream), this list will be hierarchical, with Workers displayed inside their Leader.
Fields selector: Click the Main | All | None toggles to quickly select or deselect multiple check boxes below. Beside these toggles, a Copy button enables you to copy field names to the clipboard in CSV format.
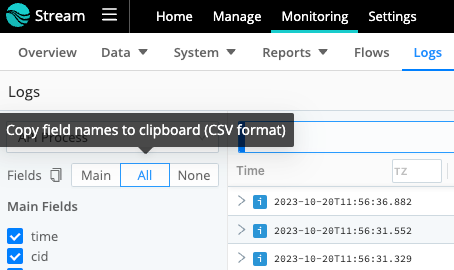
Monitoring - Copy Fields Icon Fields: Select or deselect these check boxes to change the columns displayed in the Results pane at right. (The upper Main Fields group will contain data for every event; other fields might not display data for all events.)
Time range selector: Select a standard or custom range of log data to display. (The Custom Time Range pickers use your local time, even though the logs’ timestamps are in UTC.)
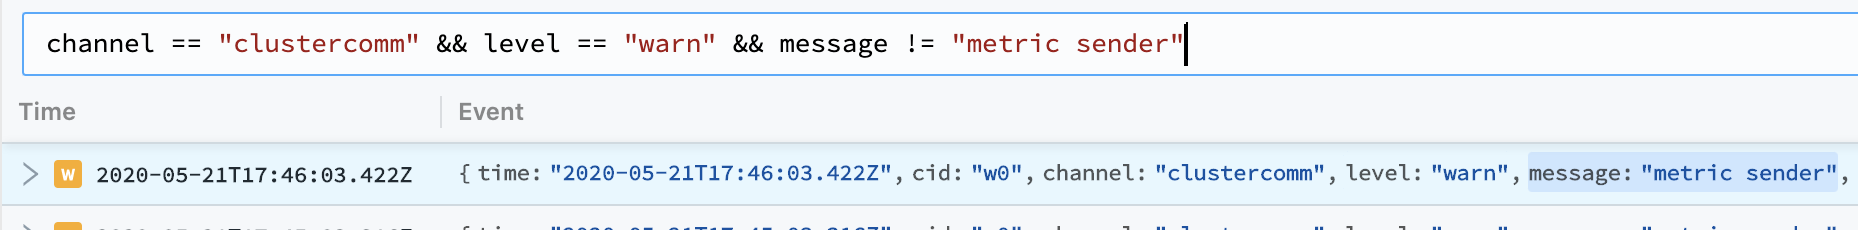
Search box: To limit the displayed results, enter a JavaScript expression here. An expression must evaluate to
truthyto return results. You can press Shift+Enter to insert a newline.
Typeahead assist is available for expression completion:
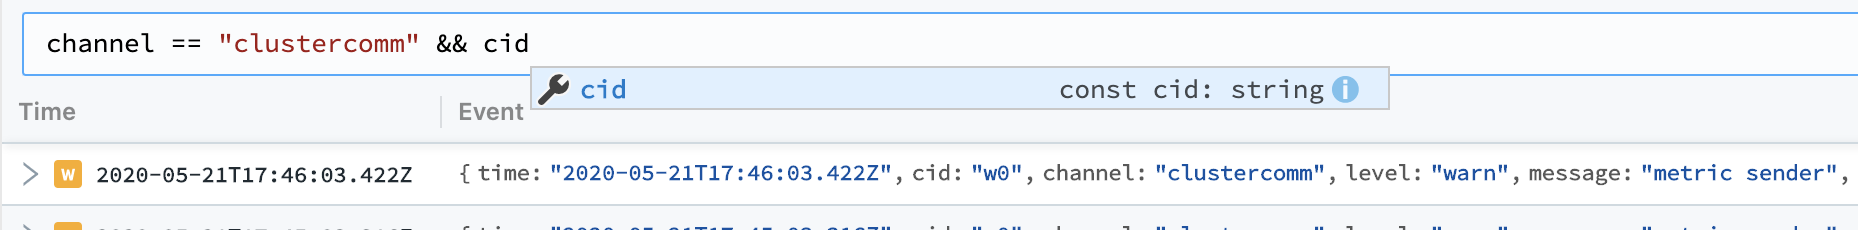
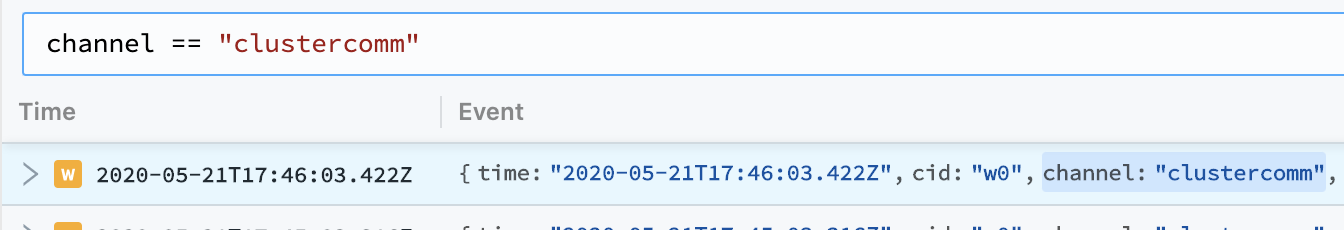
Click a field in any event to add it to a query:
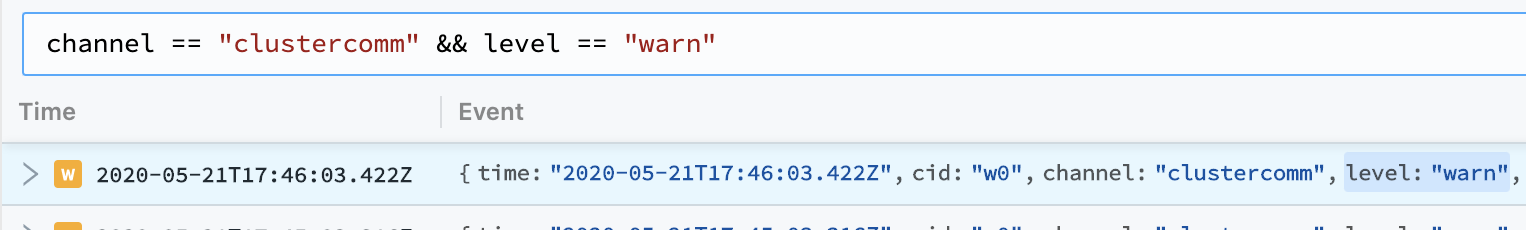
Click other fields to append them to a query:
Shift+click to negate a field:
To modify the depth of information that is originally input to the Logs page, see Logging Settings.
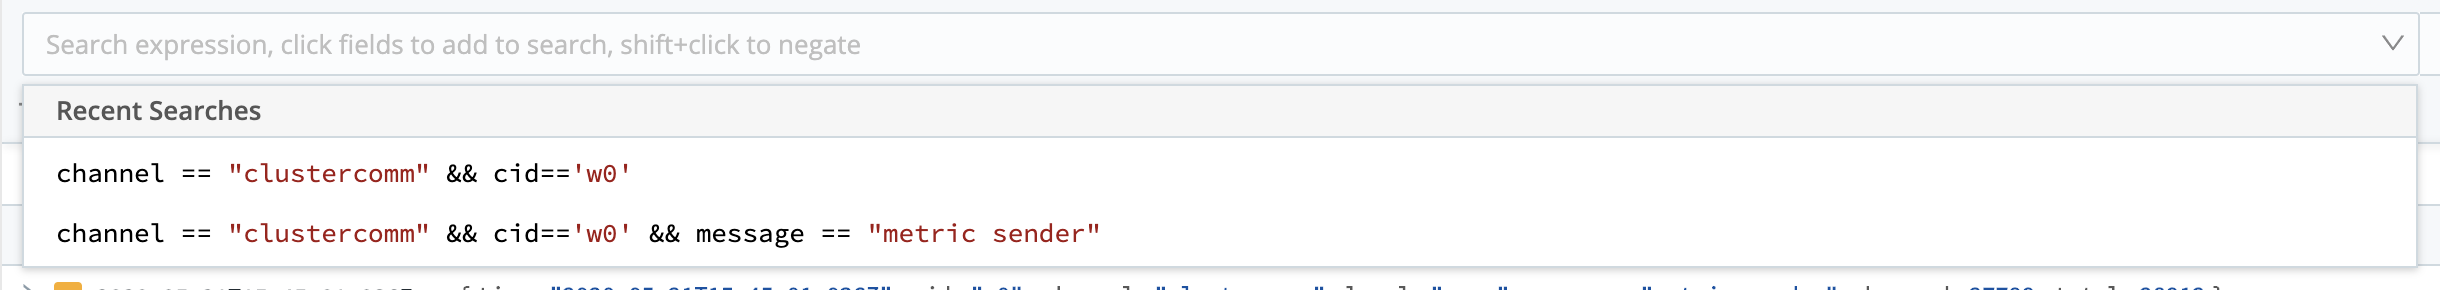
- Click the Search box’s history arrow (right side) to retrieve recent queries:
- The Results pane displays most-recent events first. Each event’s icon is color-coded to match the event’s severity level.
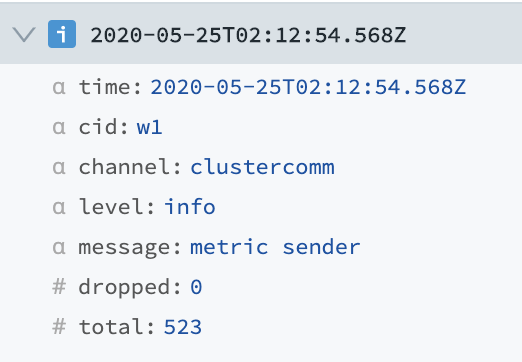
Click individual log events to unwrap an expanded view of their fields:
- Export Logs as JSON button: Exports logs as a file initially named
CriblMonitoringLogs.json. (You can edit this name upon export.) The logs’ scope will be filtered both by your Time range selector setting, and by how fully you’ve scrolled down to lazy-load that time range into the displayed UI.
Logging Settings
On Cribl Stream’s Settings pages, you can adjust the level (verbosity) of internal logging data processed, per logging channel. You can also redact fields in customized ways. In a Distributed Deployment, you manage each of these settings per Worker Group.
The logging levels help to categorize the detail and severity of logged information. Choosing the right level ensures you get the information you need for troubleshooting without getting overwhelmed by a flood of data.
Here’s a breakdown of each logging level:
| Code | Description |
|---|---|
critical | Logs unexpected failures that need to be resolved immediately. |
error | Logs only errors which need immediate attention to ensure the system’s integrity. |
warn | Logs warnings about potential issues that might not be critical but warrant attention to prevent future problems. |
info | Logs general information about the system’s operation, providing insights into standard processes and procedures. |
debug | Logs detailed information for diagnosing and troubleshooting potential problems, providing deep insights into the system’s behavior. |
silly | Logs extremely detailed information and metrics, primarily used for in-depth troubleshooting of inputs and other operations.Use it sparingly and only for short debugging bursts, treating it as “use at your own risk.” Enable temporarily, then disable promptly. |
By default, all the integration logging levels are set to info. This default setting displays logs whose level is info and more-severe (warn and error). To expose more-verbose debug and silly logs, adjust this setting per integration.
In Cribl.Cloud, you can’t directly change the logging level on Cribl-managed Worker Groups or their integrations. These levels take the default
infolevel. To adjust these levels, please contact Cribl Support, who will engage the appropriate team to make the necessary changes for you.
Change Logging Levels
To adjust logging levels:
In a single-instance deployment, select Settings > System > Logging > Levels.
For the Leader Node’s own logs, select Settings > Global Settings > System > Logging > Levels.
In a distributed deployment, select the group you want to configure. Next, select Worker Group/Fleet Settings > System > Logging > Levels.
On the resulting Levels page, you can:
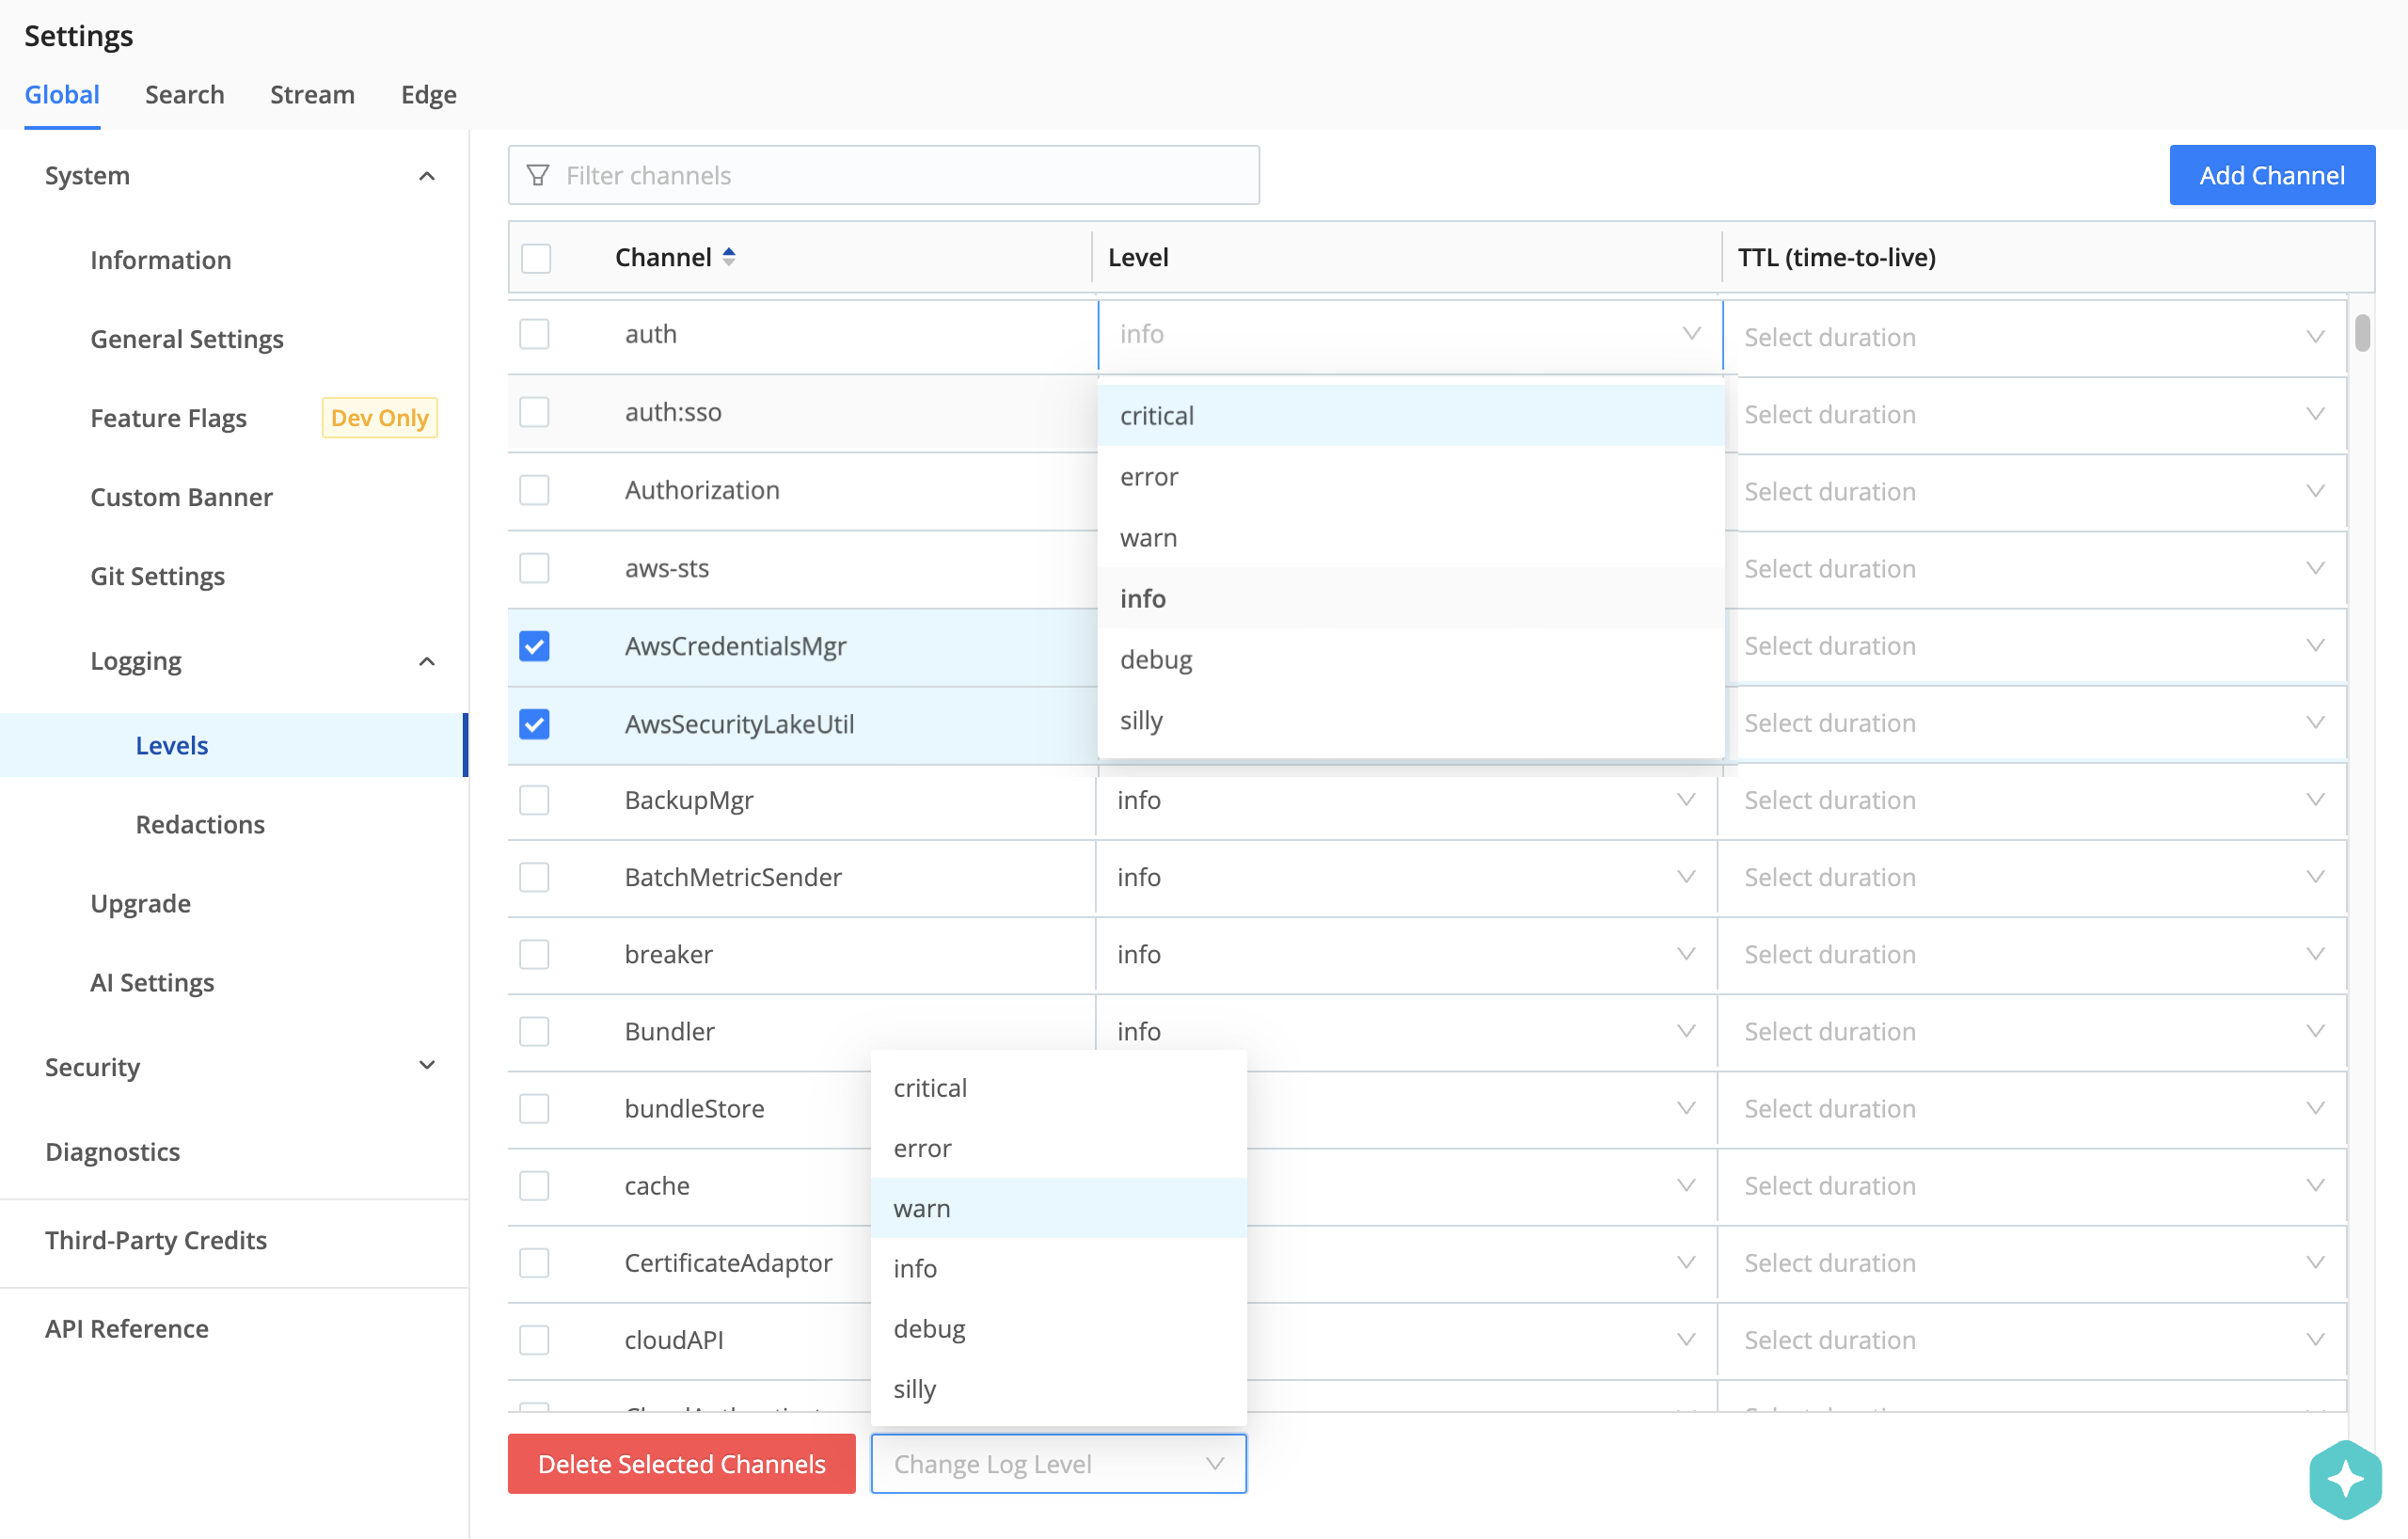
Modify one channel by clicking its Level column. In the resulting drop-down, you can set a verbosity level ranging from critical up to silly. (Top of composite screenshot below.)
Modify multiple channels by selecting their check boxes, then clicking the Change log level drop-down at the bottom of the page. (Bottom of composite screenshot below.) You can select all channels at once by clicking the top check box. You can search for channels at top right.
Set temporary logging levels for one or more channels.
Set Temporary Logging Levels
The TTL (time-to-live) setting allows you to temporarily change log levels so that you can debug without overwhelming your logs or incurring unnecessary storage costs. You can set temporary log levels for up to 24 hours.
To set temporary logging levels for logging channels:
Navigate to the Levels page.
Modify the logging level for the desired channels using either the Level column or the Change log level drop-down at the bottom of the page.
For each modified channel, select a duration for the temporary logging level in the TTL (time-to-live) column.
Select Save. The TTL (time-to-live) setting applies instantly.
Make sure to set temporary log levels for individual channels after you save any settings for the DEFAULT channel. The DEFAULT channel has special override behavior that affects log level settings for all other channels as follows:
On Cribl.Cloud and in on-prem deployments, setting a temporary log level for DEFAULT overrides all channel levels, including existing TTLs on other channels.
In on-prem deployments, setting a permanent log level (no TTL (time-to-live) duration) for DEFAULT overrides all log levels and deletes any existing temporary log level settings on other channels.
Cribl.Cloud does not support changing the permanent log level for the DEFAULT channel when any individual channels have a temporary log level setting.
Log levels automatically revert to previous settings when the TTL (time-to-live) duration expires, falling back as needed according to the following order of precedence:
The last log level that was set for the channel without an associated TTL (time-to-live) duration.
The log level set for the DEFAULT channel.
The
infolog level.
The TTL (time-to-live) setting uses timestamps in Unix time for persistence across restarts. Temporary log level settings do not permanently update persisted configurations for logging channels.
Change Logging Redactions
On the Redact Internal Log Fields page, you can customize the redaction of sensitive, verbose, or just ugly data within Cribl Stream’s internal logs. To access these settings:
In a single-instance deployment, select Settings > System > Logging > Redactions.
In a single-instance deployment, or for the Leader Node’s own logs, select Settings > Global Settings > System > Logging > Redactions.
In a distributed deployment, select the group you want to configure. Next, select that group’s Worker Group/Fleet Settings > System > Logging > Redactions.
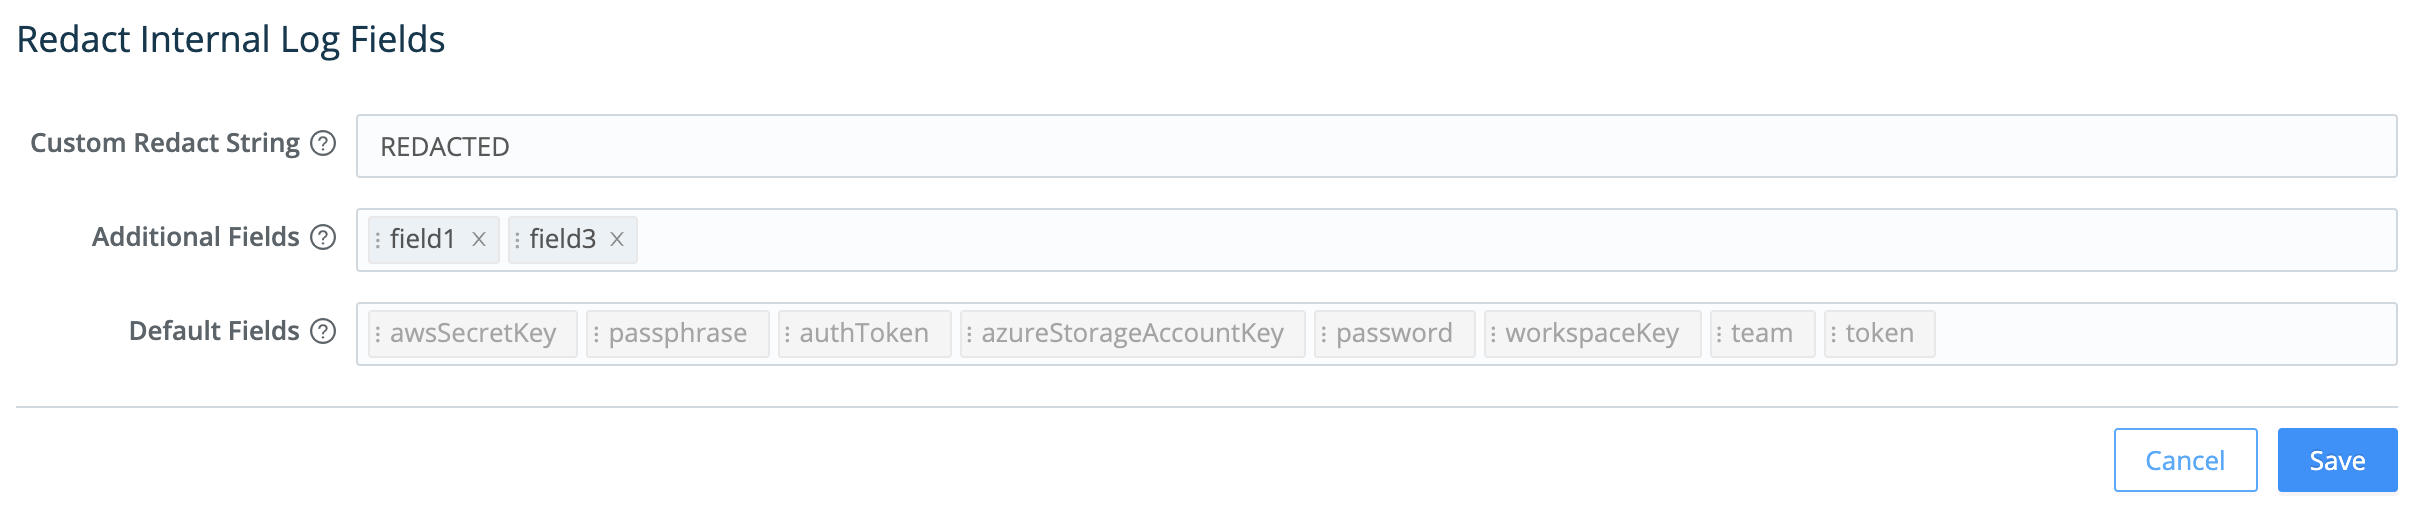
It’s easiest to understand the resulting Redact Internal Log Fields page’s fields from bottom to top:
- Default fields: Cribl Stream always redacts these fields, and you can’t modify this list to allow any of them through. However, you can use the two adjacent fields to define stricter redaction:
- Additional fields: Type or paste in the names of extra fields you want to redact. Use a tab or hard return to confirm each entry.
- Custom redact string: Unless this field is empty, it defines a literal string that will override Cribl Stream’s default redaction pattern (explained below) on the affected fields.
Default Redact String
By default, Cribl Stream transforms this page’s selected fields by applying the following redaction pattern:
- Echo the field value’s first two characters.
- Replace all intermediate characters with a literal
...ellipsis. - Echo the value’s last two characters.
Anything you enter in the Custom redact string field will override this default ??...?? pattern.
Health Endpoint
Each Cribl Stream instance exposes a /health endpoint that is commonly used along with a load balancer to support operational decision-making. See Leader High Availability/Failover: Load Balancers for more information.
Query the /health endpoint on any instance to check the instance’s health.
For many HTTP-based Sources, you can enable a Source-level health check endpoint in the Advanced Settings tab. The request URL format for these endpoints is
http(s)://${hostName}:${port}/cribl_health. Refer to the configuration instructions for a Source to learn whether the health check endpoint is available for it.