


Bubble Map
Show a value at each latitude and longitude on a map.
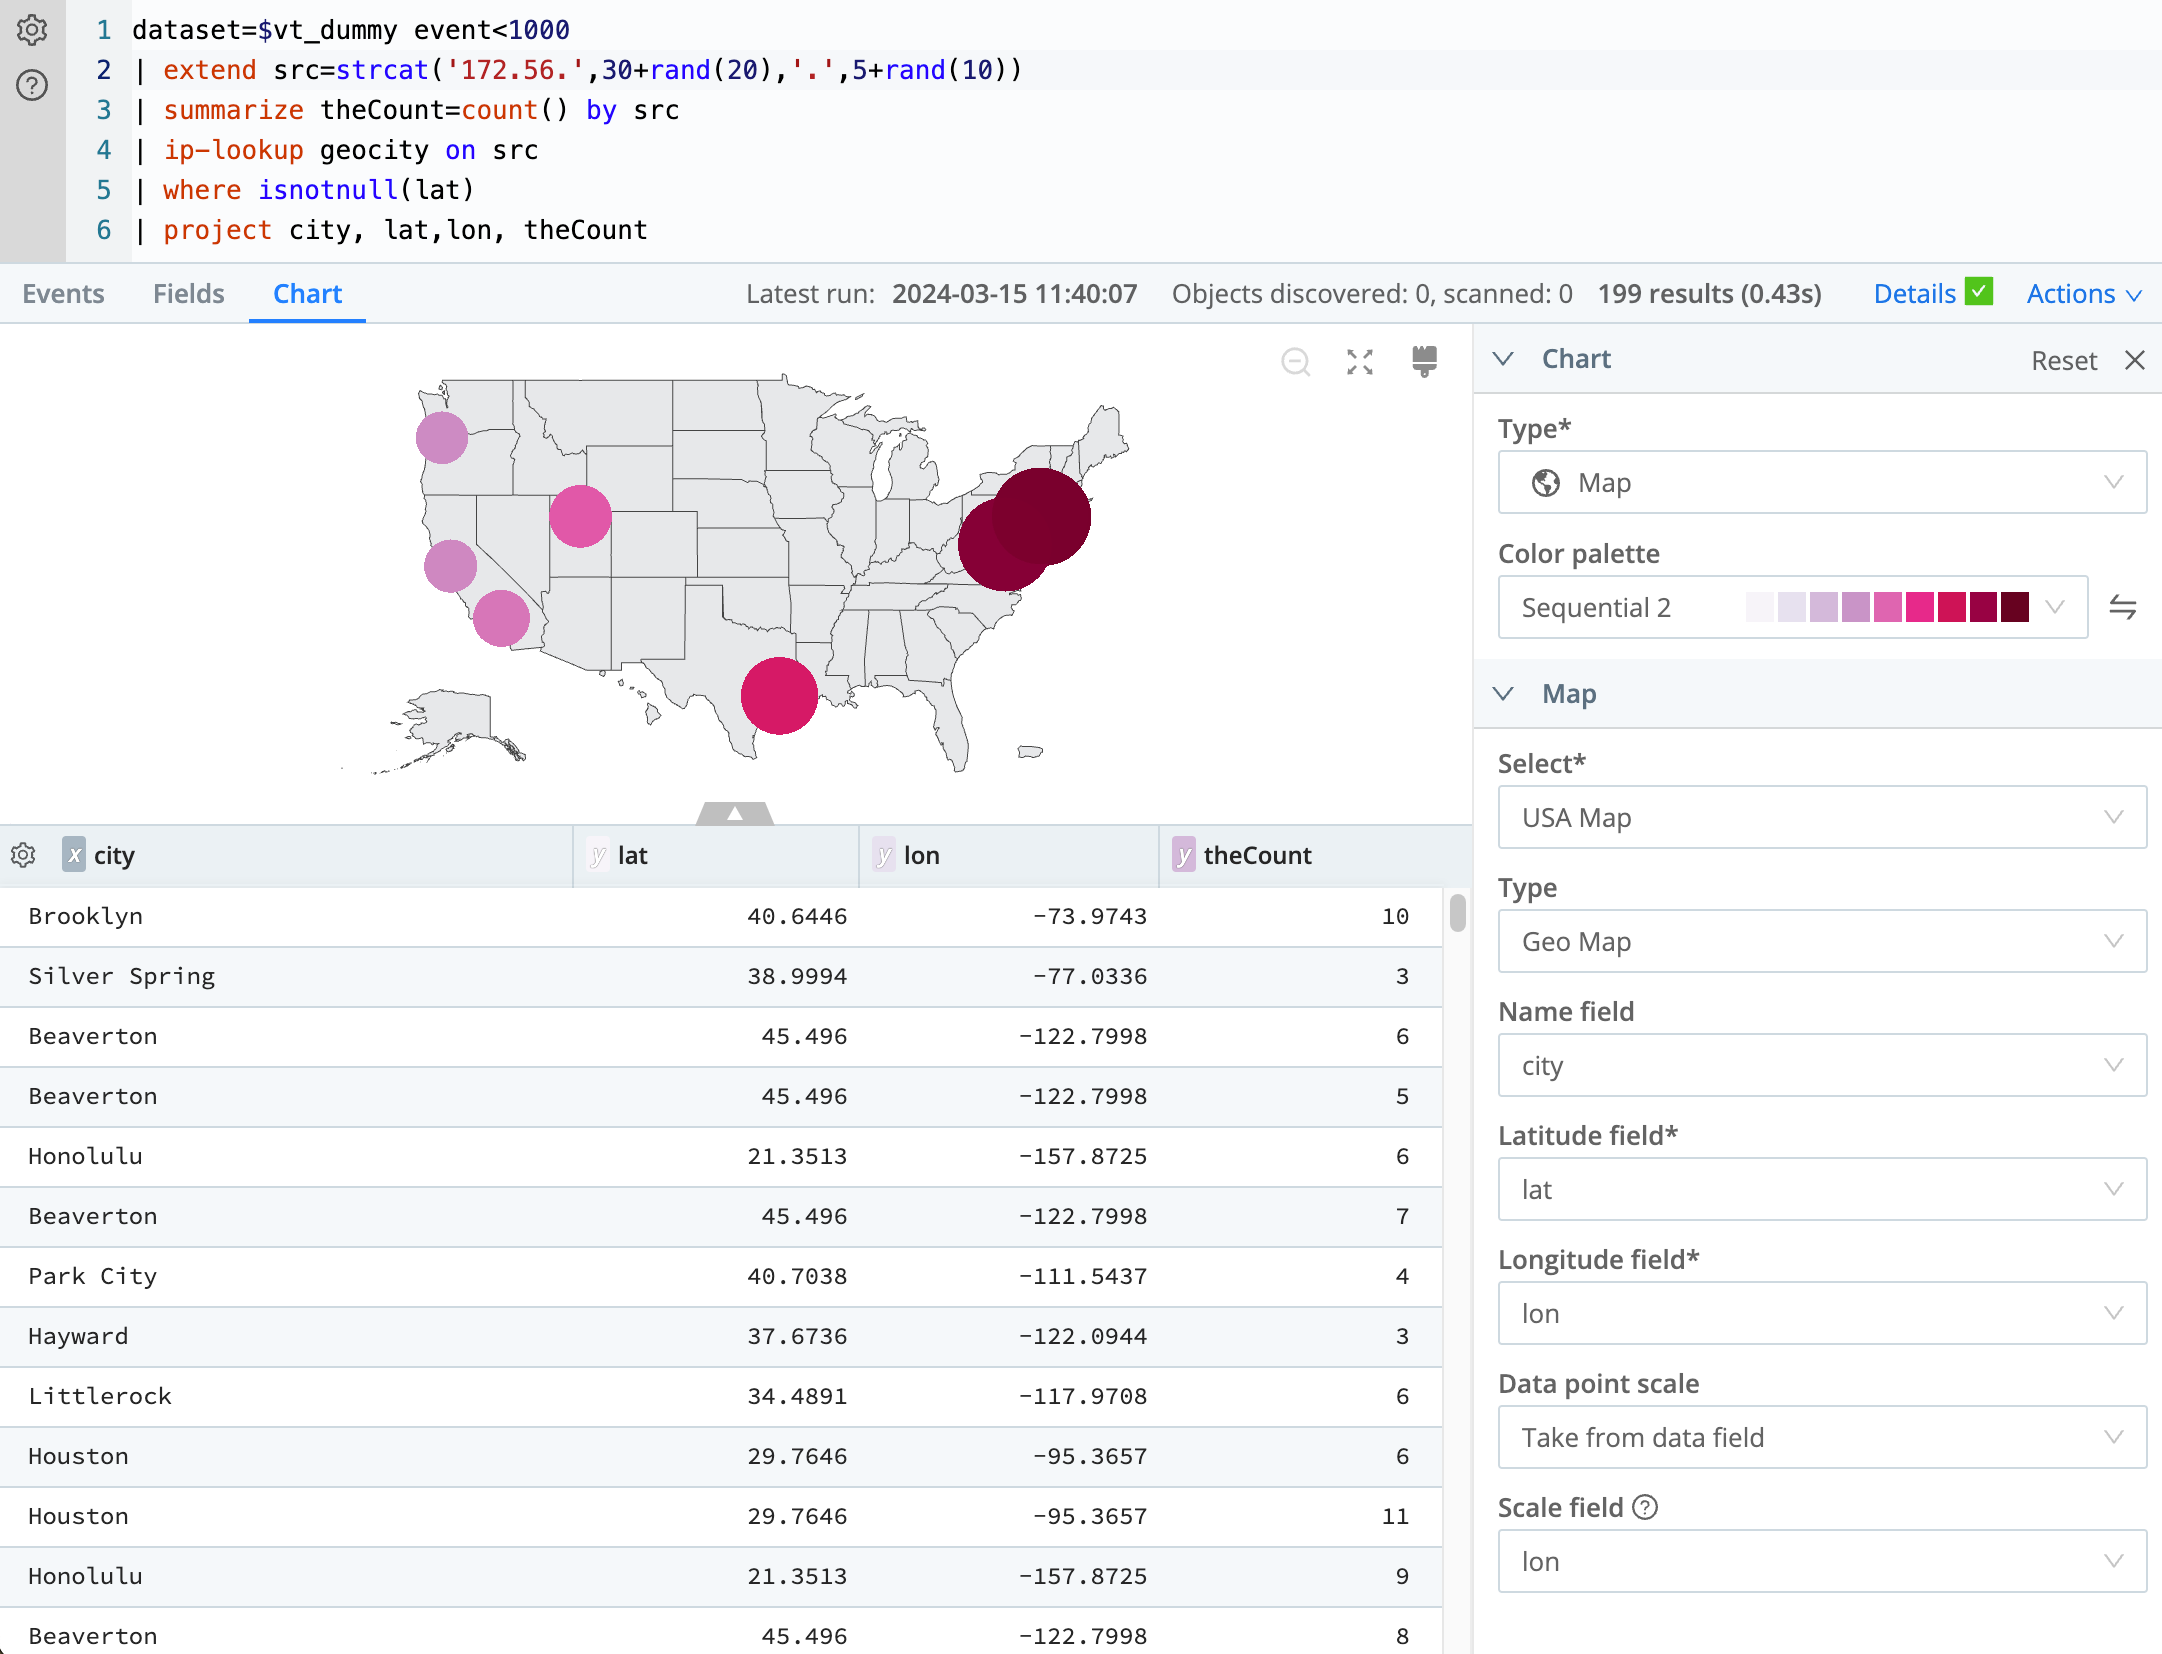
Use a Bubble map to compare a count or total across specific locations, such as events by city. Latitude and longitude place each marker.
A bubble map needs latitude and longitude fields and a numeric field. The city search on the Choropleth map page returns a latitude, a longitude, and a count.
Coordinates
Latitude: Select the numeric field for the north-south position.
Longitude: Select the numeric field for the east-west position.
Name (optional): Select the field that labels each marker.
Display
Map source: Select World Map or USA Map. World Map is the default.
Series colors: Select the color scheme for the markers.
Dot size: Select Small, Medium, or Large. When another numeric field is available, select Scale by field, and then select that field in Size.
Legend
Position: Select Top, Bottom, Left, or Right.
Hide the legend to remove it from the chart.
Tooltip
Additional fields: Select extra result fields for the tooltip.
Hide the tooltip to leave it off the chart.