


Gauge Chart
Visualize your search results, using a Gauge Chart.
Gauge Charts (also known as dial or speedometer Charts) show progress toward a specific target or metric, displaying a specific value as a measure of progress toward that target.
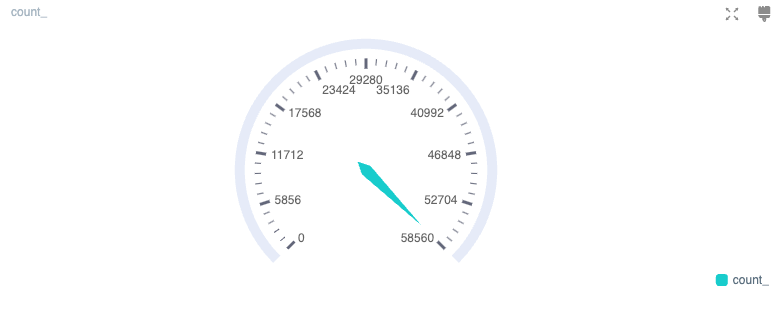
Chart Settings
Apply threshold: Apply custom color threshold settings.
Enable Apply threshold, and then change or add custom colors and threshold values to change the display of the Chart.
Legend Settings
Position: Where to display the legend relative to the chart.
Truncate: By default, Cribl Search truncates labels to fit your browser viewport, substituting a ... for omitted characters. Toggle this off if you prefer to not alter labels.