


Map Chart
Visualize your search results, using a Map Chart.
Map Chart use geographical maps to display data points or categories associated with specific geographic locations.
To create Map Charts, your search needs to return supported geolocation data. You can use the ip-lookup
operator, which references geolocation data from MaxMind’s databases, or extract this information from your data. The
Map Chart uses the first column (X-axis) to match the polygon name, and the second column (Y-axis) as the data.
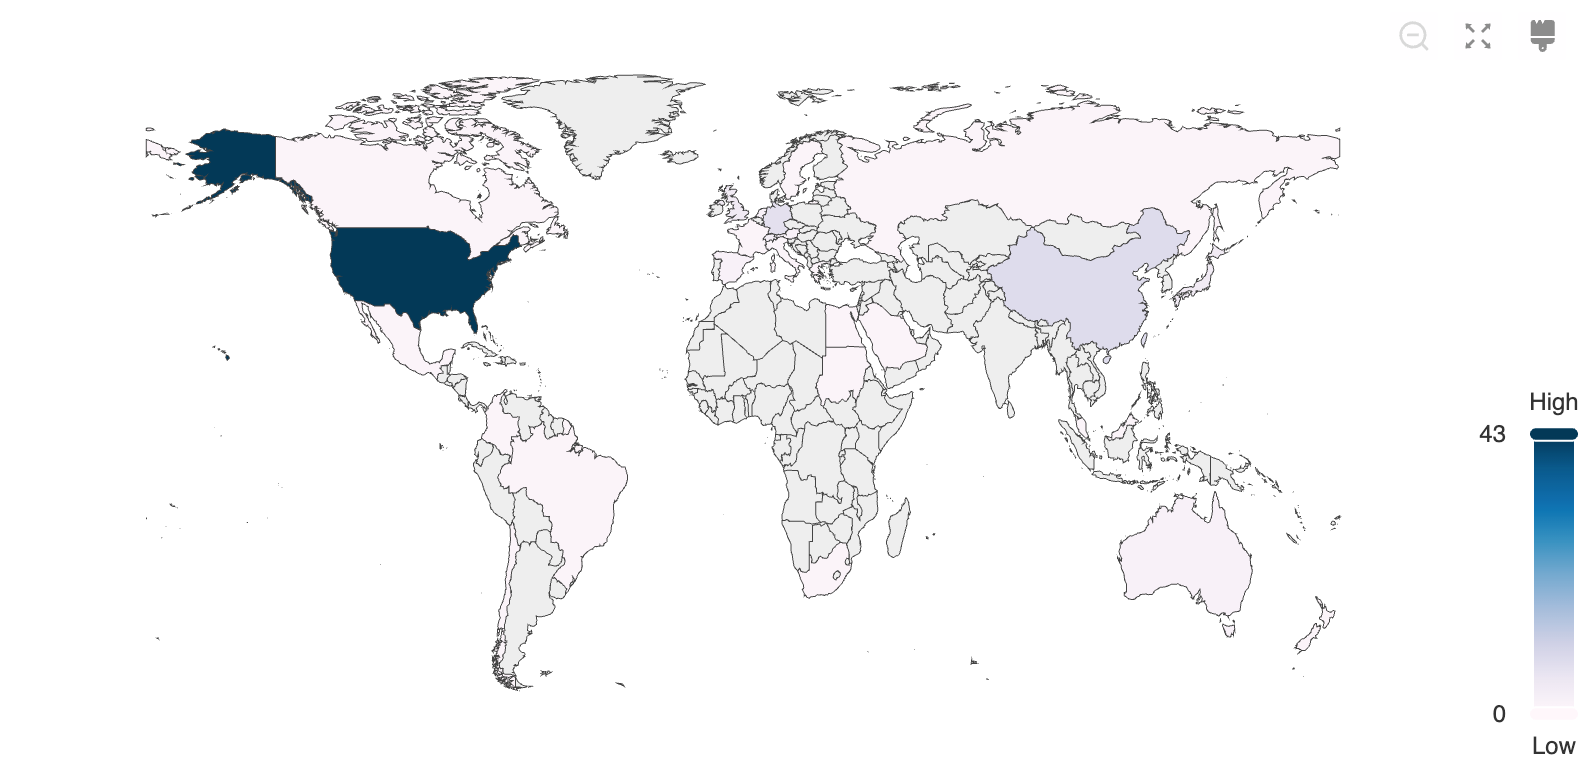
Chart Settings
Color palette: Select the color scheme you want to use in your Chart.
Map Settings
First select either World Map or USA Map. Then choose whether you want to display the map as Choropleth or Geo Map.
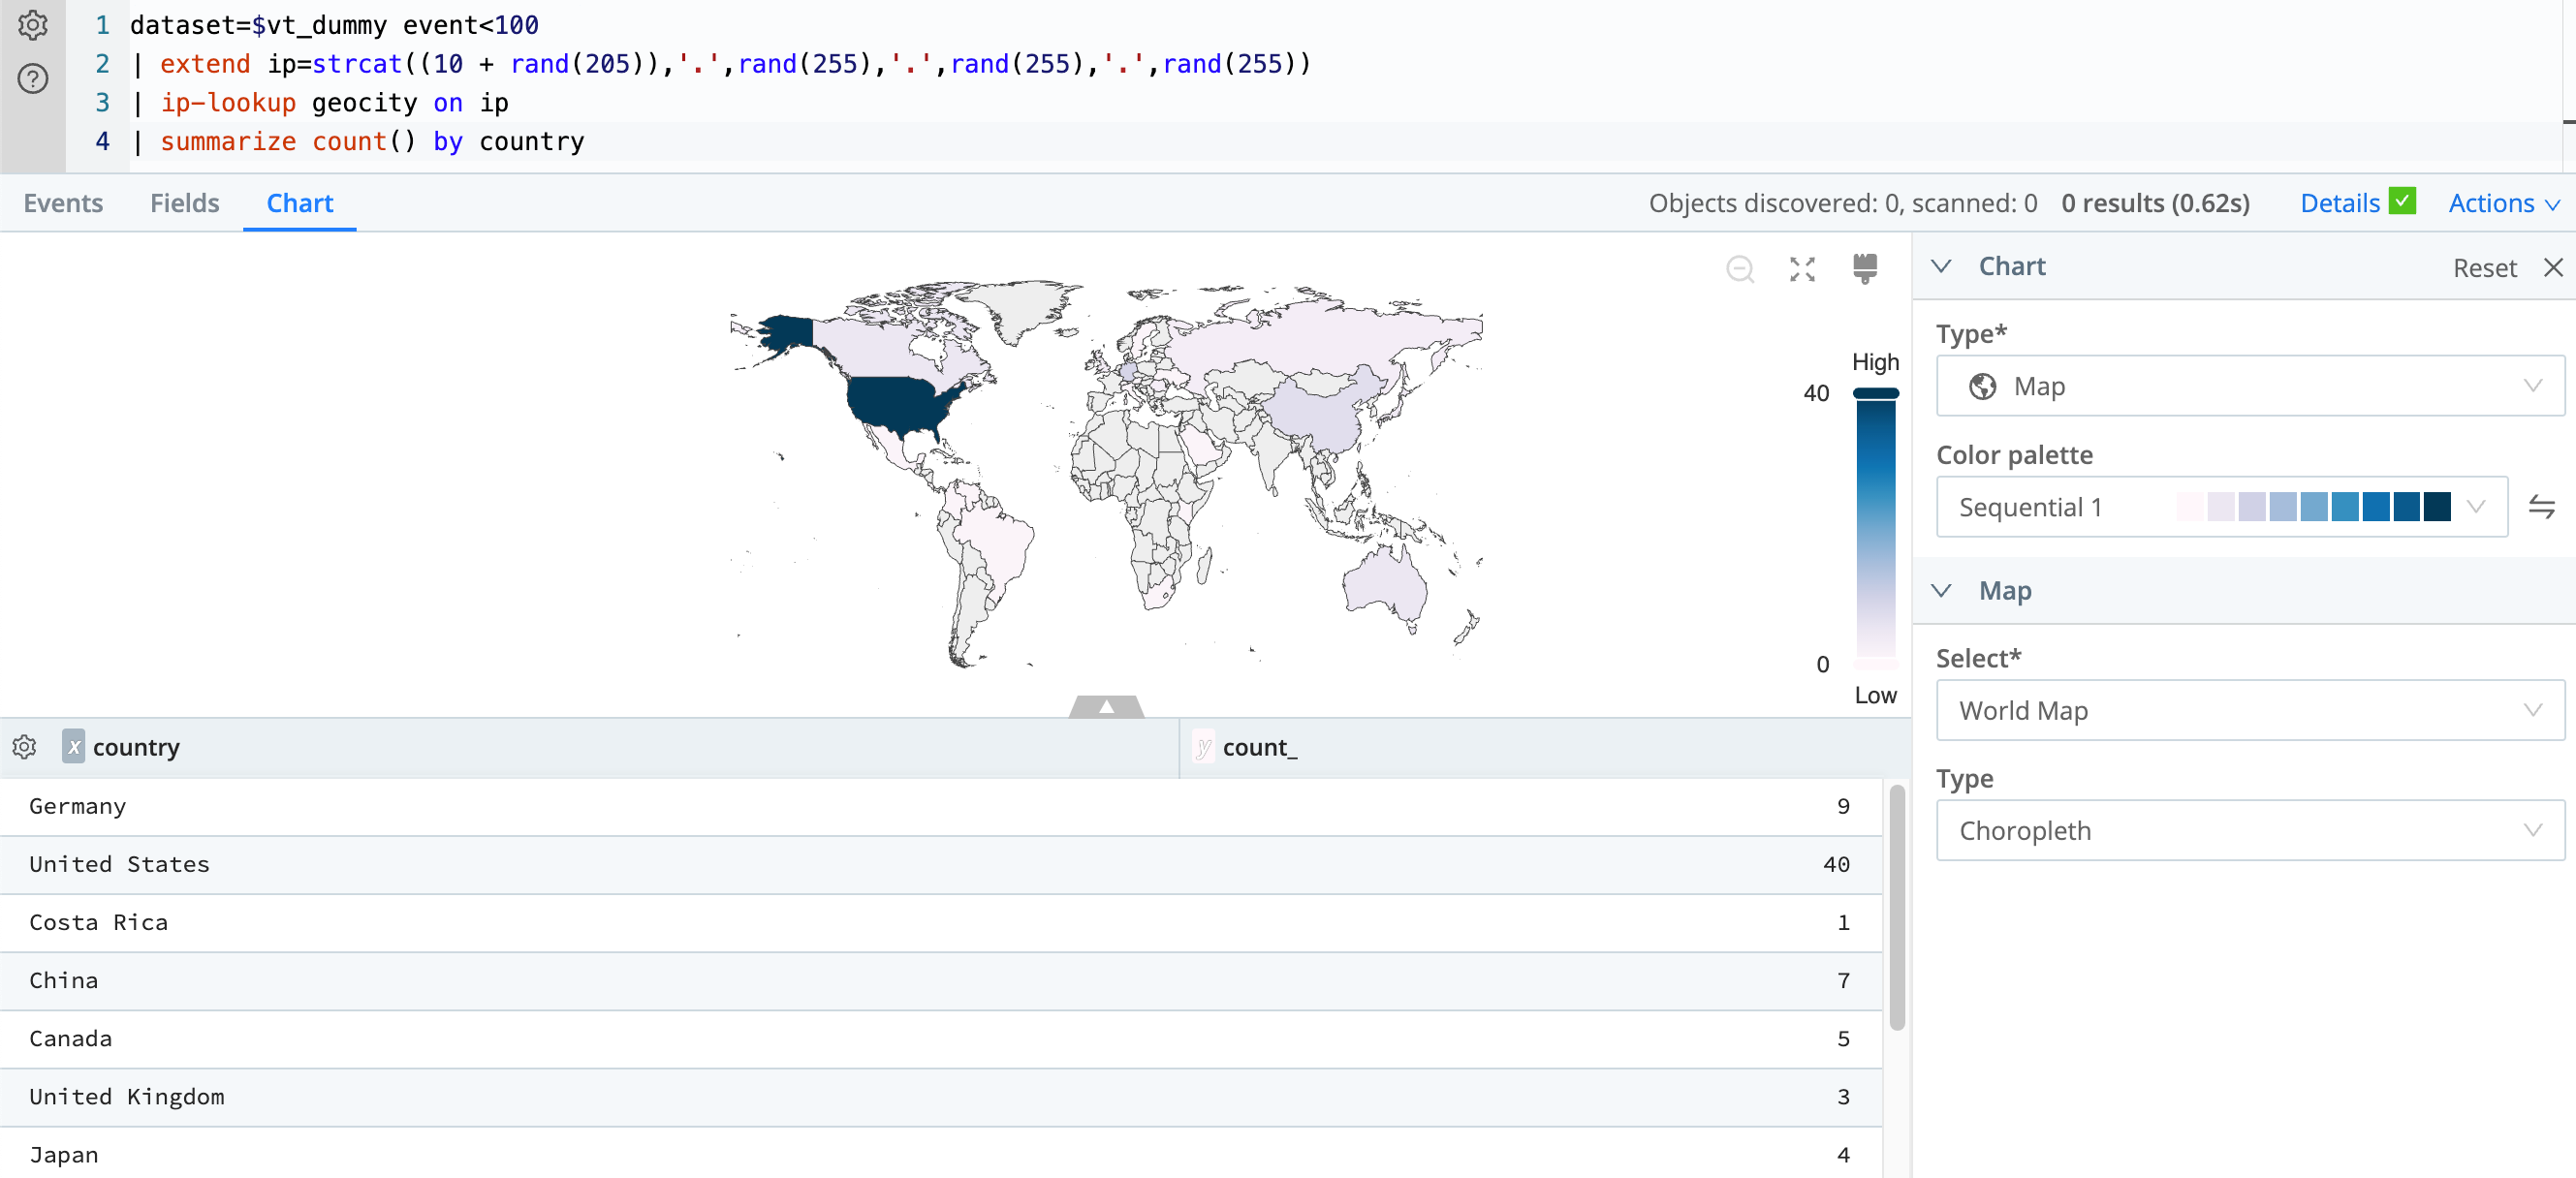
A choropleth map displays divided geographical regions colored in relation to a data variable. This Chart uses the first column (X-axis) to match the polygon name, and the second column (Y-axis) as the data. A choropleth map is good for comparing high-level data at a glance.
To narrow the Chart’s display of data in a choropleth map to show only a certain range of values, drag the High/Low slider handles from the top or bottom. To see individual data points highlighted on the map, hover your pointer over different parts of the High/Low slider.
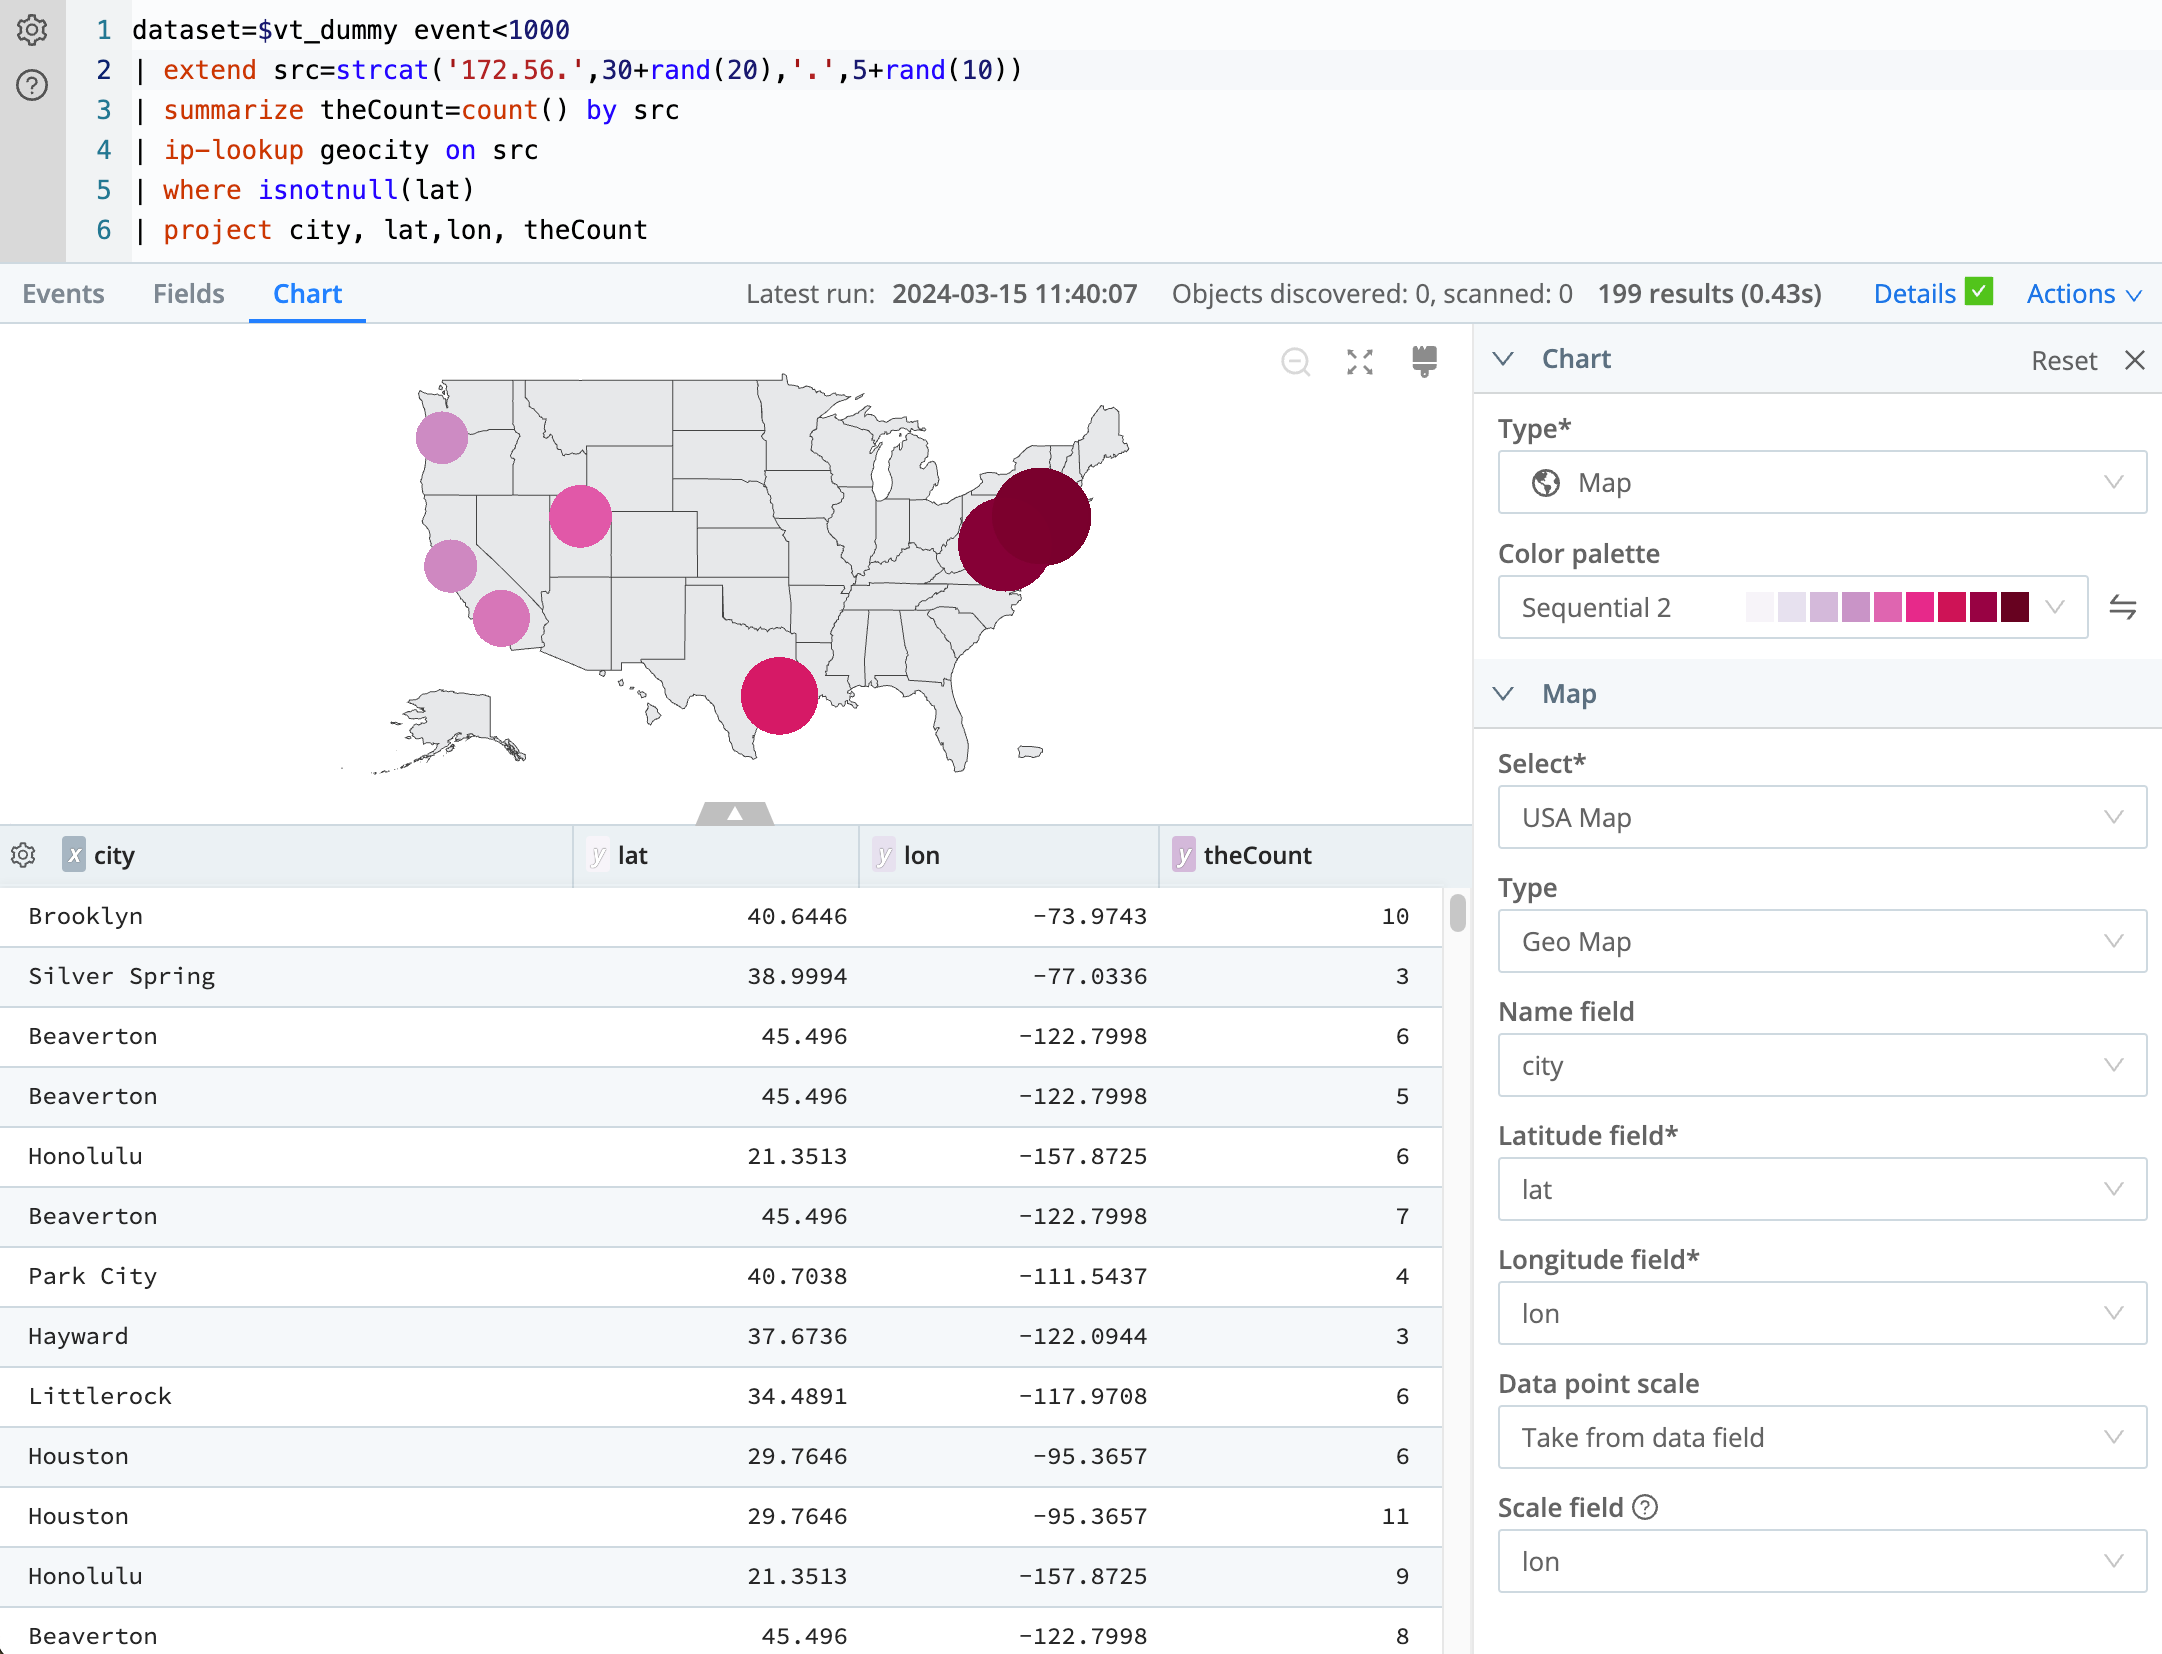
A geo (geographic) map displays scaled data points based on a numeric value. You can customize the visualization by specifying the Name, Latitude, and Longitude fields, and you can select a specific scale or apply scale based on a data set in your query.
Sample Searches
The following example searches use the
GeoLite2-City
database in a lookup table called geocity. Note that to set them up, you’ll need to first download a MaxMind .mmdb file and install it as a lookup table (follow the instructions in ip-lookup):
World Map
dataset=$vt_dummy event<100
| extend ip=strcat((10 + rand(205)),'.',rand(255),'.',rand(255),'.',rand(255))
| ip-lookup geocity on ip
| summarize count() by countryUSA Map
dataset=$vt_dummy event<1000
| extend src=strcat('172.56.',30+rand(20),'.',5+rand(10))
| summarize theCount=count() by src
| ip-lookup geocity on src
| where isnotnull(lat)
| project city, lat,lon, theCountAfter running these searches, change the chart type to map, to see a map of the results.