Charts
Visualize your search results, using Charts.
Cribl Search provides Charts to display aggregate search results. Cribl
and statistical functions are used together with the summarize,
eventstats, and timestats operators to aggregate your data.
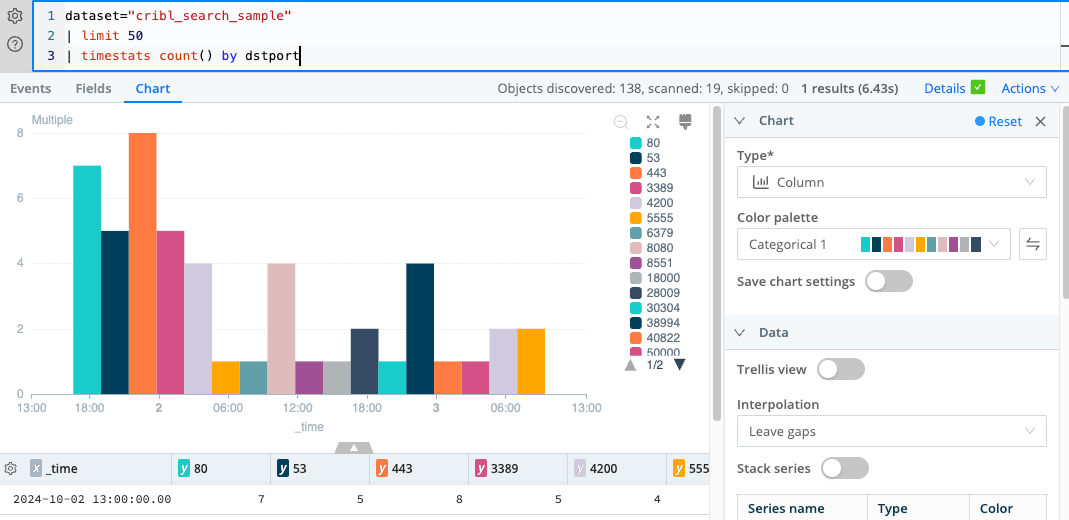
When you run an aggregate search, your results display on a Chart. You can select from various Chart types and color palettes, and you can manipulate how your results are plotted.
See the following topics:
- Types of Charts in Cribl Search - Each page explains an available Chart type, the types of data it’s best used for, and the settings available.
- Results Tables - covers the available options for the results table associated with a Chart, including sorting, filtering, and formatting tabular results.
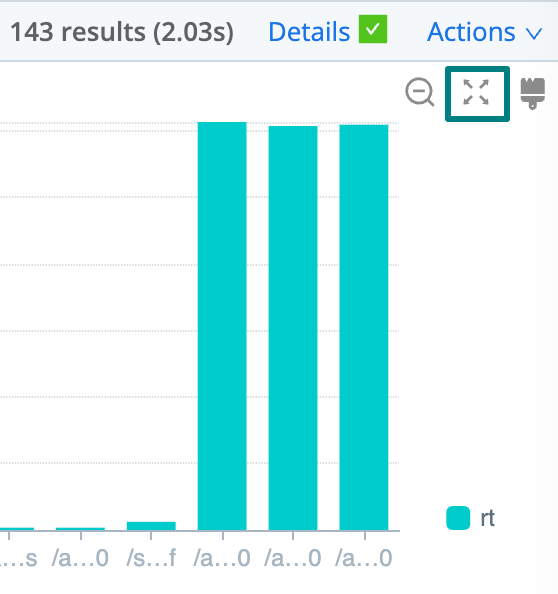
See a Chart in Full Screen
To zoom your Chart up to a larger view, select the expand (Full screen) button at the Chart’s top right.
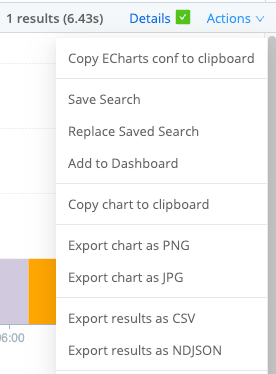
Export a Chart as an Image
To export your search results or Chart, open the Actions drop-down and select one of the following:
- Export chart as PNG.
- Export chart as JPG.
- Export results as CSV.
- Export results as JSON.
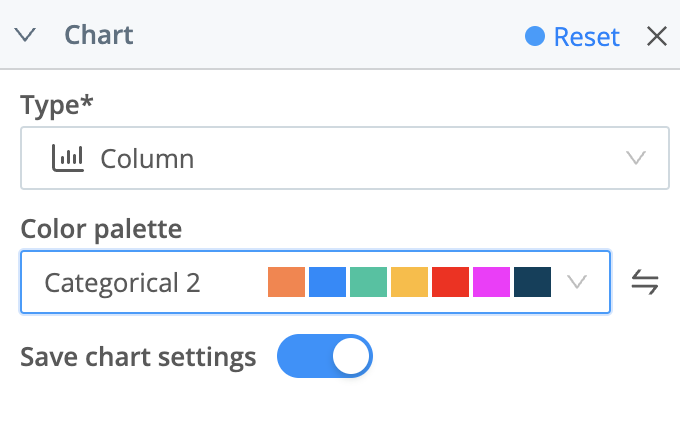
Save or Reset Chart Settings
The Chart tab provides a Save chart settings option (off by default). Enable this if you want to persist your Chart customizations when running later queries on the same page. If the Chart re-renders in unexpected ways (because some custiomizations conflict with new query terms), try turning this back off.
Selecting the Reset link will restore Chart defaults. This includes restoring the default Chart type (Column) and turning off the Save chart settings setting itself.
On Dashboards, visualizations do not provide this Save option. This is to maintain Dashboards’ dynamic nature.