


Add Visualizations Using Cribl Copilot
Use the Cribl Copilot AI assistant to generate Dashboard visualizations.
As an alternative to designing Dashboard visualizations from scratch, you can use the Cribl Copilot visualization assistant to analyze your Dataset and suggest effective display options. You can then adapt one of the initial suggestions, request different suggestions, or reject all suggestions and configure your own visualization.
To globally enable or disable Cribl Copilot for all Cribl products in your Organization, select ⚙️ Settings > Global > AI Settings.
Add a Visualization from a Dataset
Cribl Copilot can suggest visualizations directly from the Search Home page. Hover your pointer over any Dataset to expose a Visualize button, as shown below.
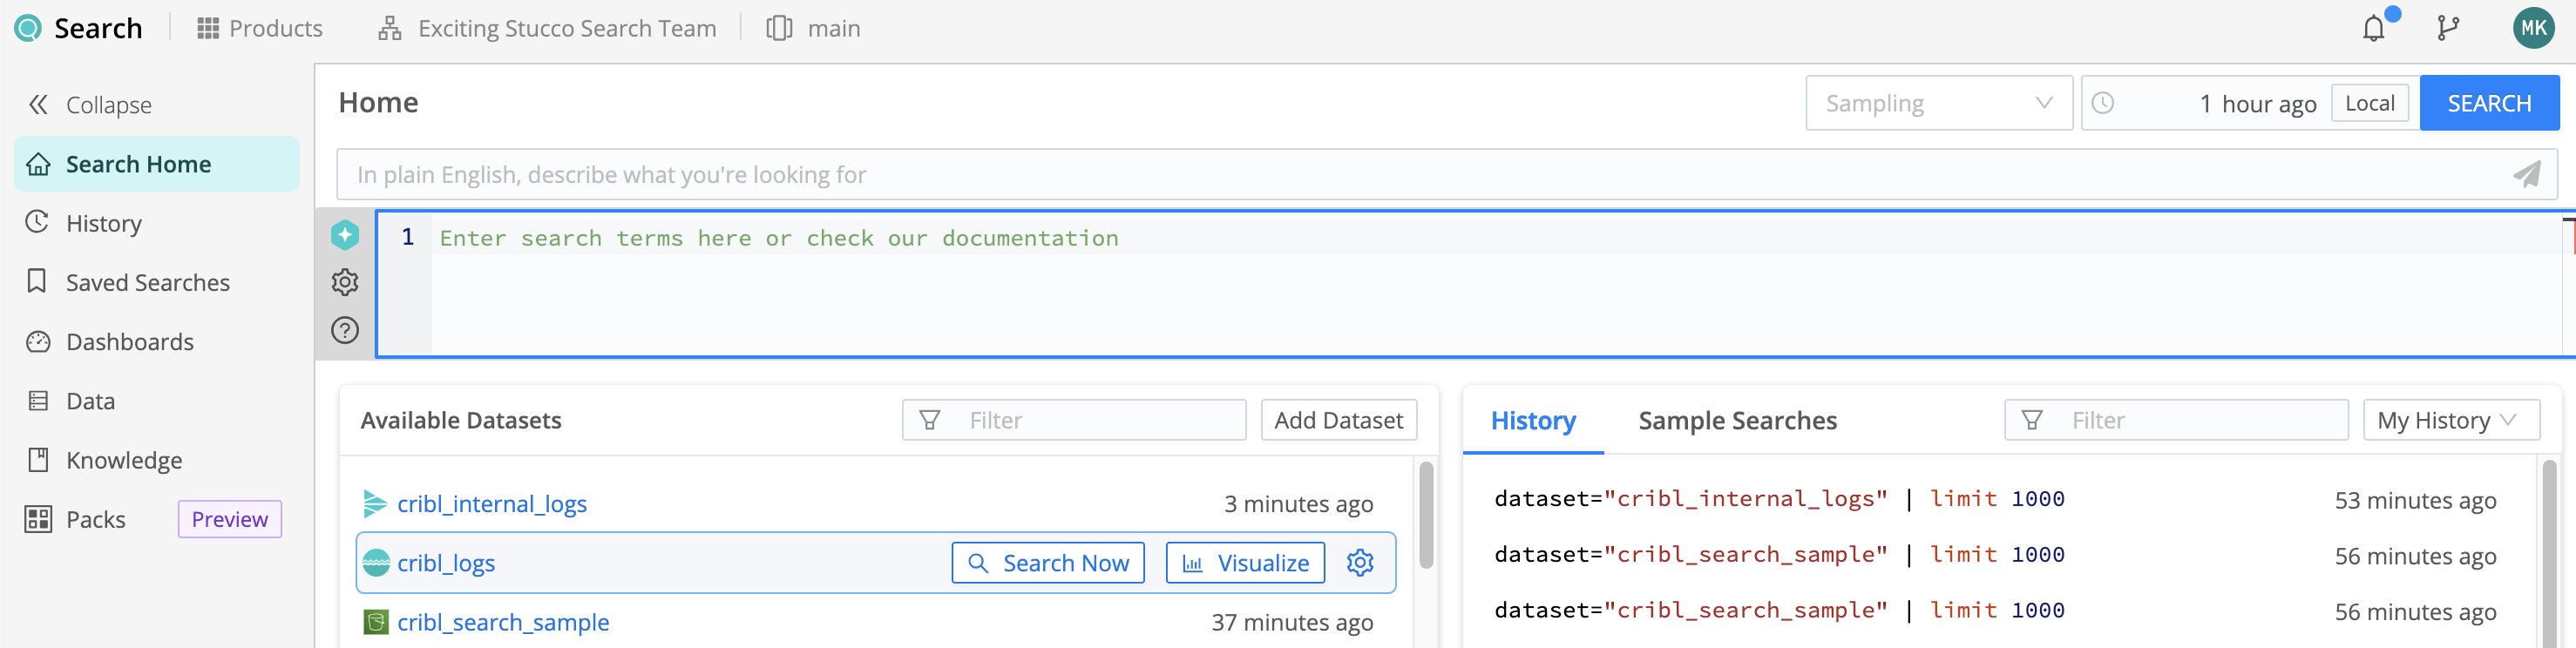
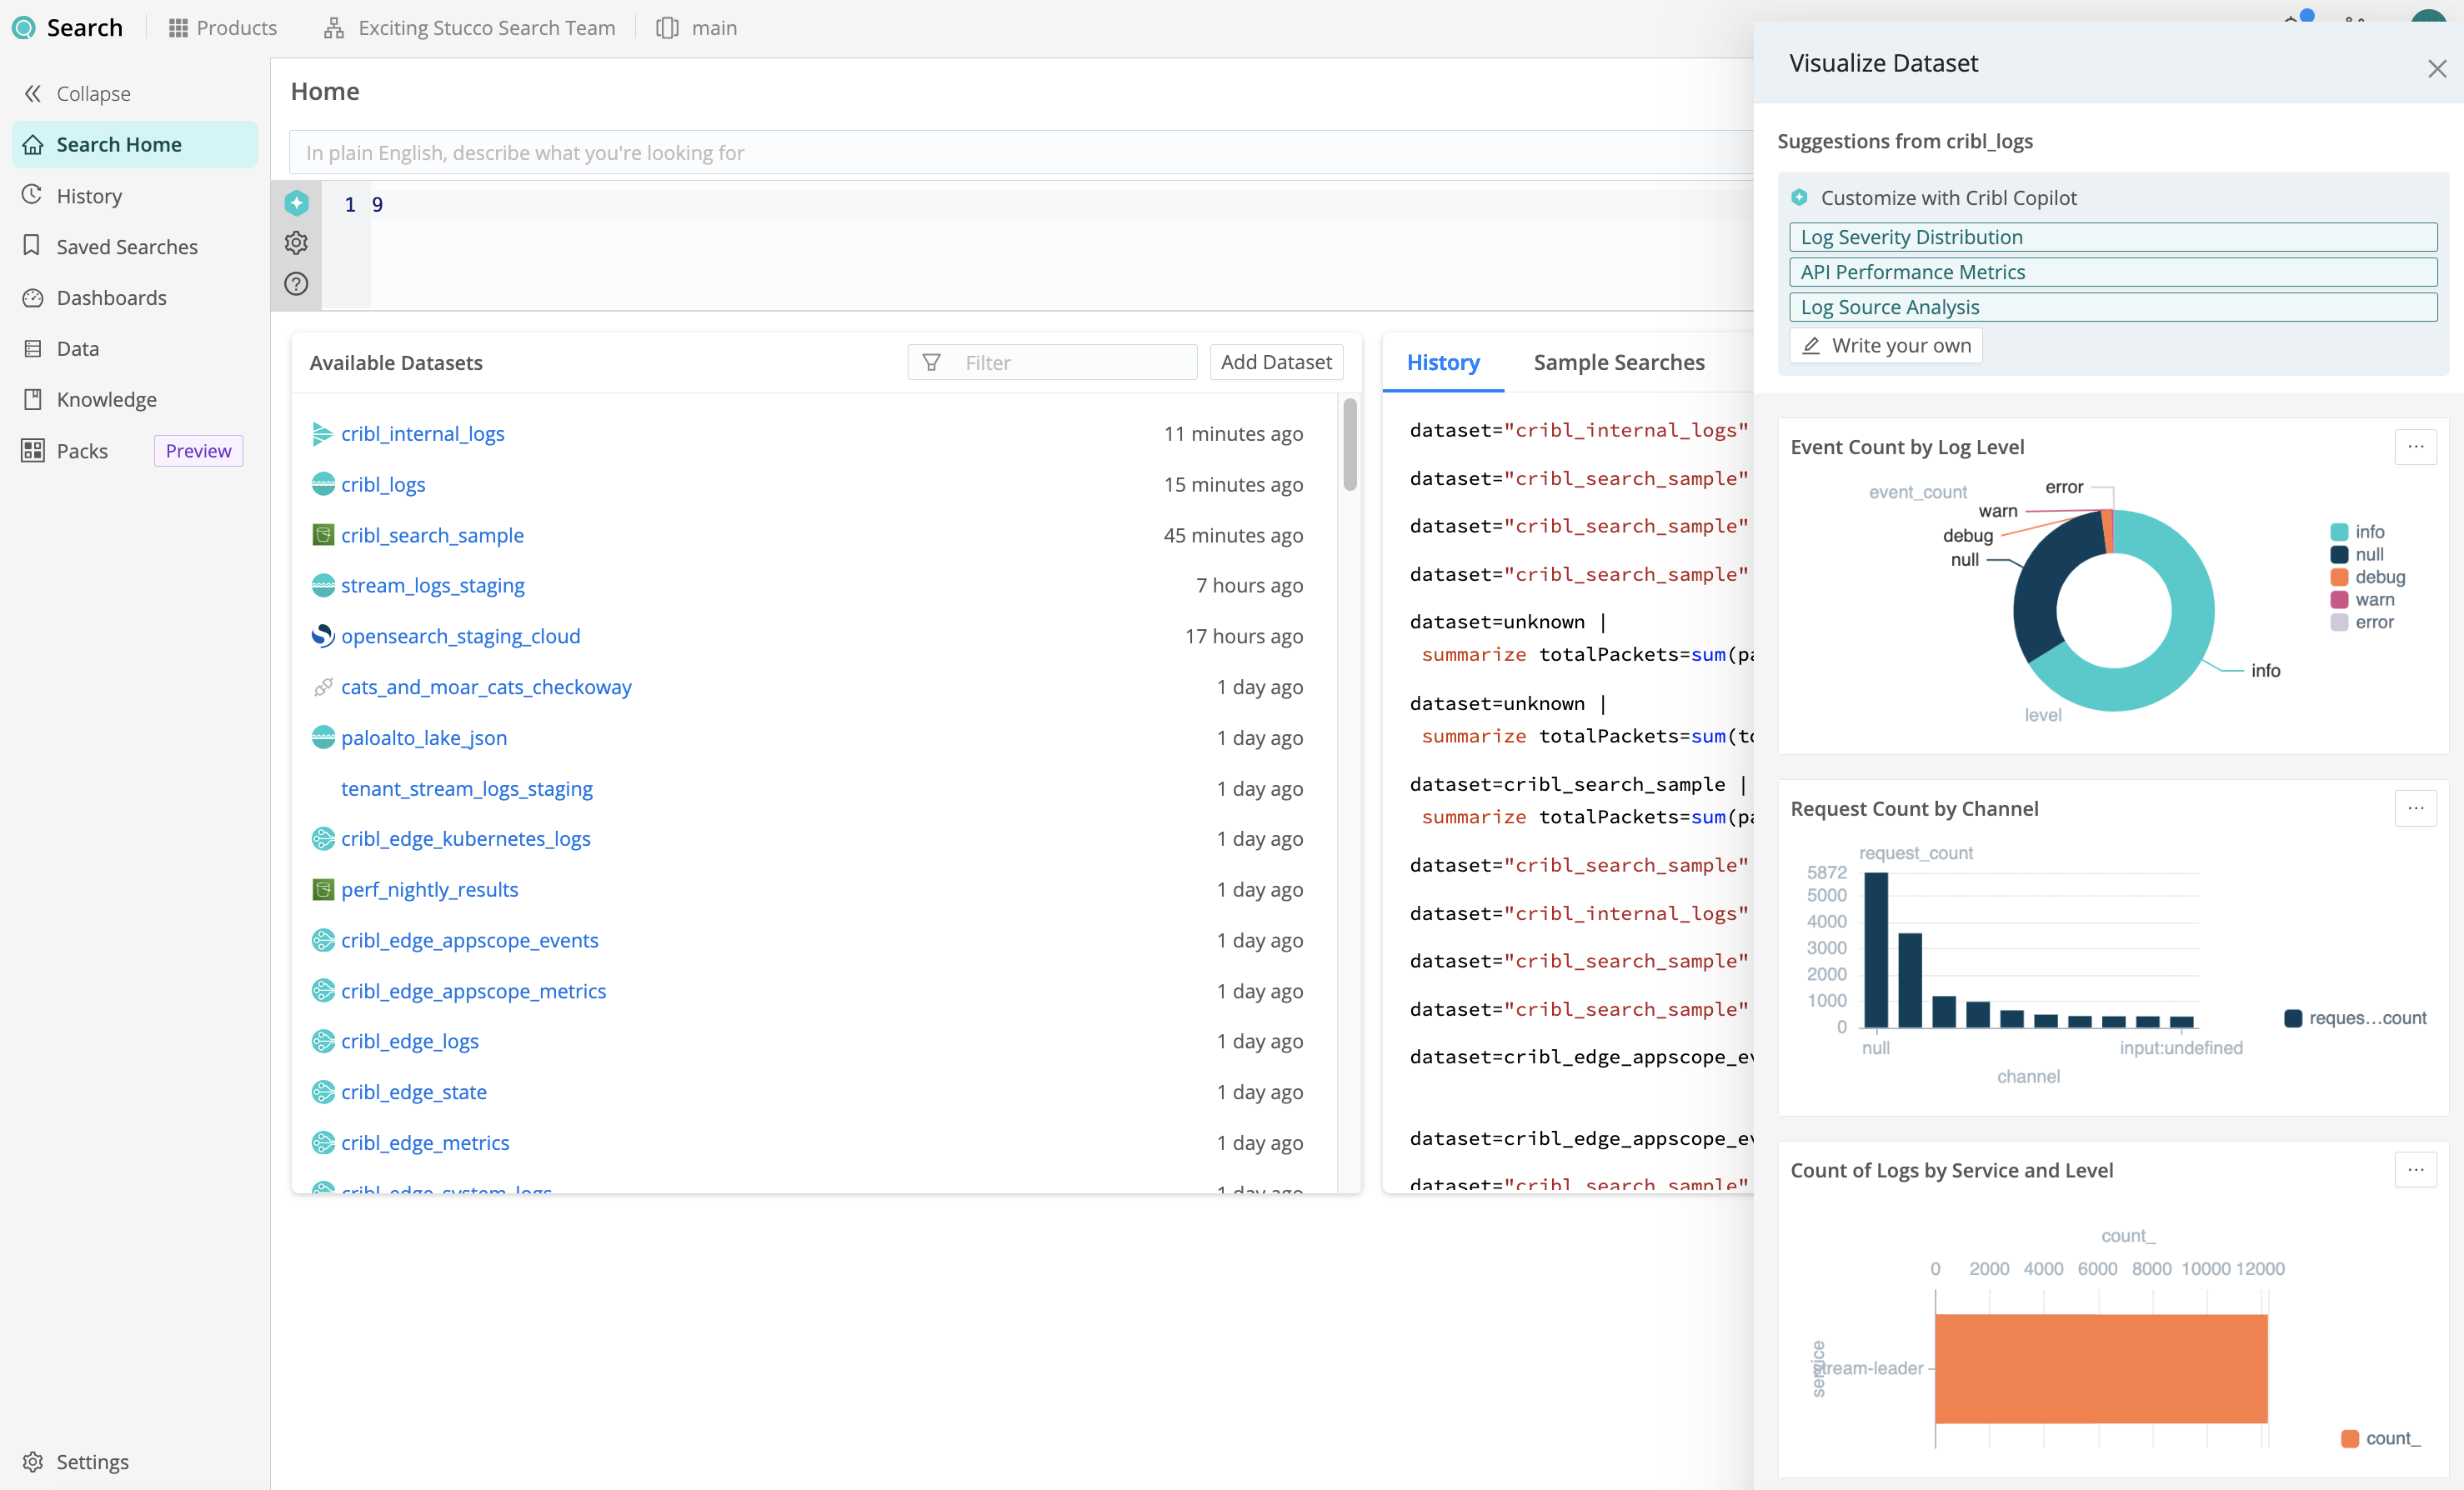
Select the button, and a Visualize Dataset drawer will open on the right. Here, Cribl Copilot will analyze the selected Dataset. After a few seconds, if the analysis is successful, the drawer will suggest three visualizations that might be useful in displaying the discovered data. Above the visualization panels, you will also see several buttons to generate alternative queries.
You have the following options here:
To accept one of the suggested visualizations, select its Actions
 button (upper right), then select Add to Dashboard.
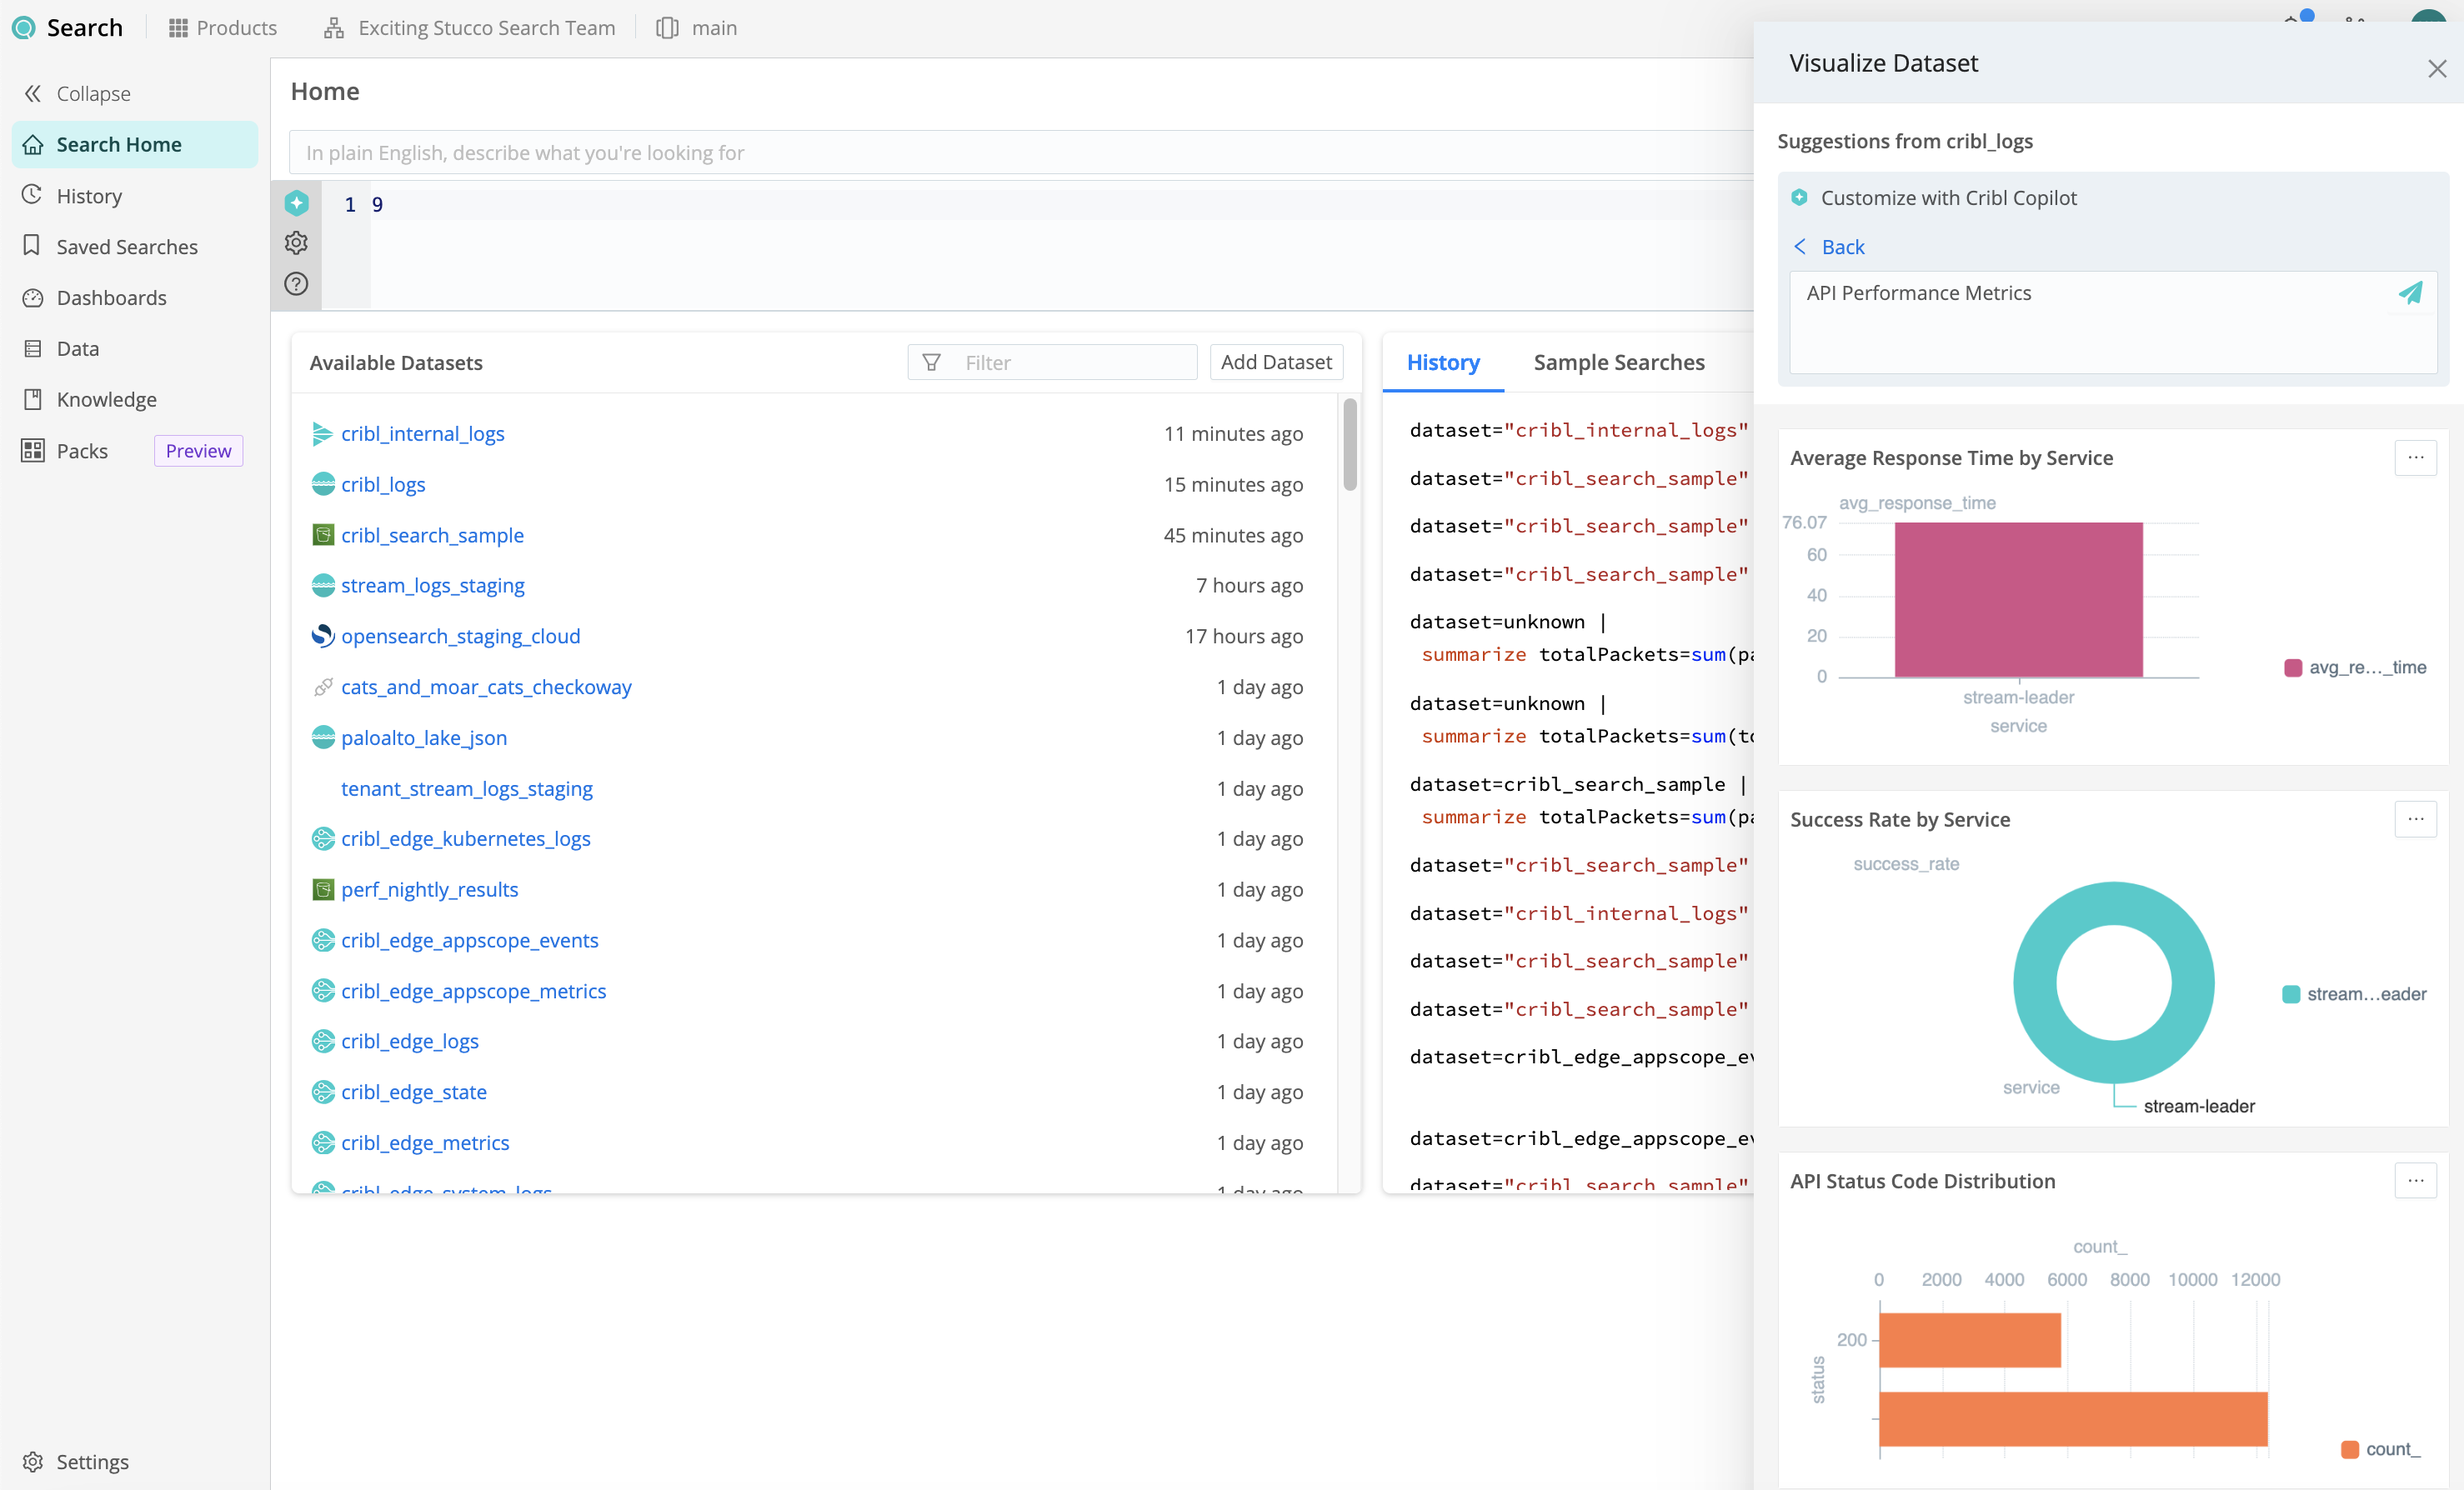
To substitute a new query and generate a different set of visualizations, select one of the three buttons at the top right. As shown below, this will open a corresponding natural language prompt in a new query box. Refine the query as desired, then select the Send
 button - or press
 Enter/return- to see your new visualization options.Select Write your own. This will open a similar query box, where you can describe your own natural language query from scratch. As with the predefined query buttons, this will generate new suggested visualizations.
Add a Visualization when Creating a Dashboard
When you add a new Dashboard, you can use Cribl Copilot to generate suggested visualizations.
From the Cribl Search sidebar, select Dashboards.
Select Add Dashboard.
Give your Dashboard a name, configure any additional settings you want, and then select Save.
Select Add Visualization Using Copilot.

Add Visualization Using Copilot button Select the Dataset you want to use as your visualization’s base.
Soon, Cribl Copilot will display three recommended visualizations. (This could take up to several minutes with large Datasets.)
- Select Add to add any suggested visualization to your new Dashboard, or select Refresh
 to generate three new visualizations.
 - You’re now working in edit mode (described in the following section).
To add more visualizations, select the Cribl Copilot button near the upper right.
Add a Visualization when Editing a Dashboard
When you’re editing an existing Dashboard, you can use Cribl Copilot to generate suggested visualizations.
- From the Cribl Search sidebar, select Dashboards.
- Select the Dashboard you want to edit.
- Select the Actions
button at the upper right, and then select Edit.
- Near the upper right, select the Cribl Copilot button
.
If the Dashboard is empty, you’ll instead see the Add Visualization Using Copilot option, described in the preceding section.
- From the list on the right, select the Dataset you want to use as your visualization’s base.
Soon, Cribl Copilot will display three recommended visualizations. (This could take up to several minutes with large Datasets.)
- Select Add to add any visualization to your new Dashboard, or select Refresh
to generate three new suggested visualizations.
You have two additional options when editing an existing Dashboard:
To replace the Dataset used for your visualization, select Change Dataset.
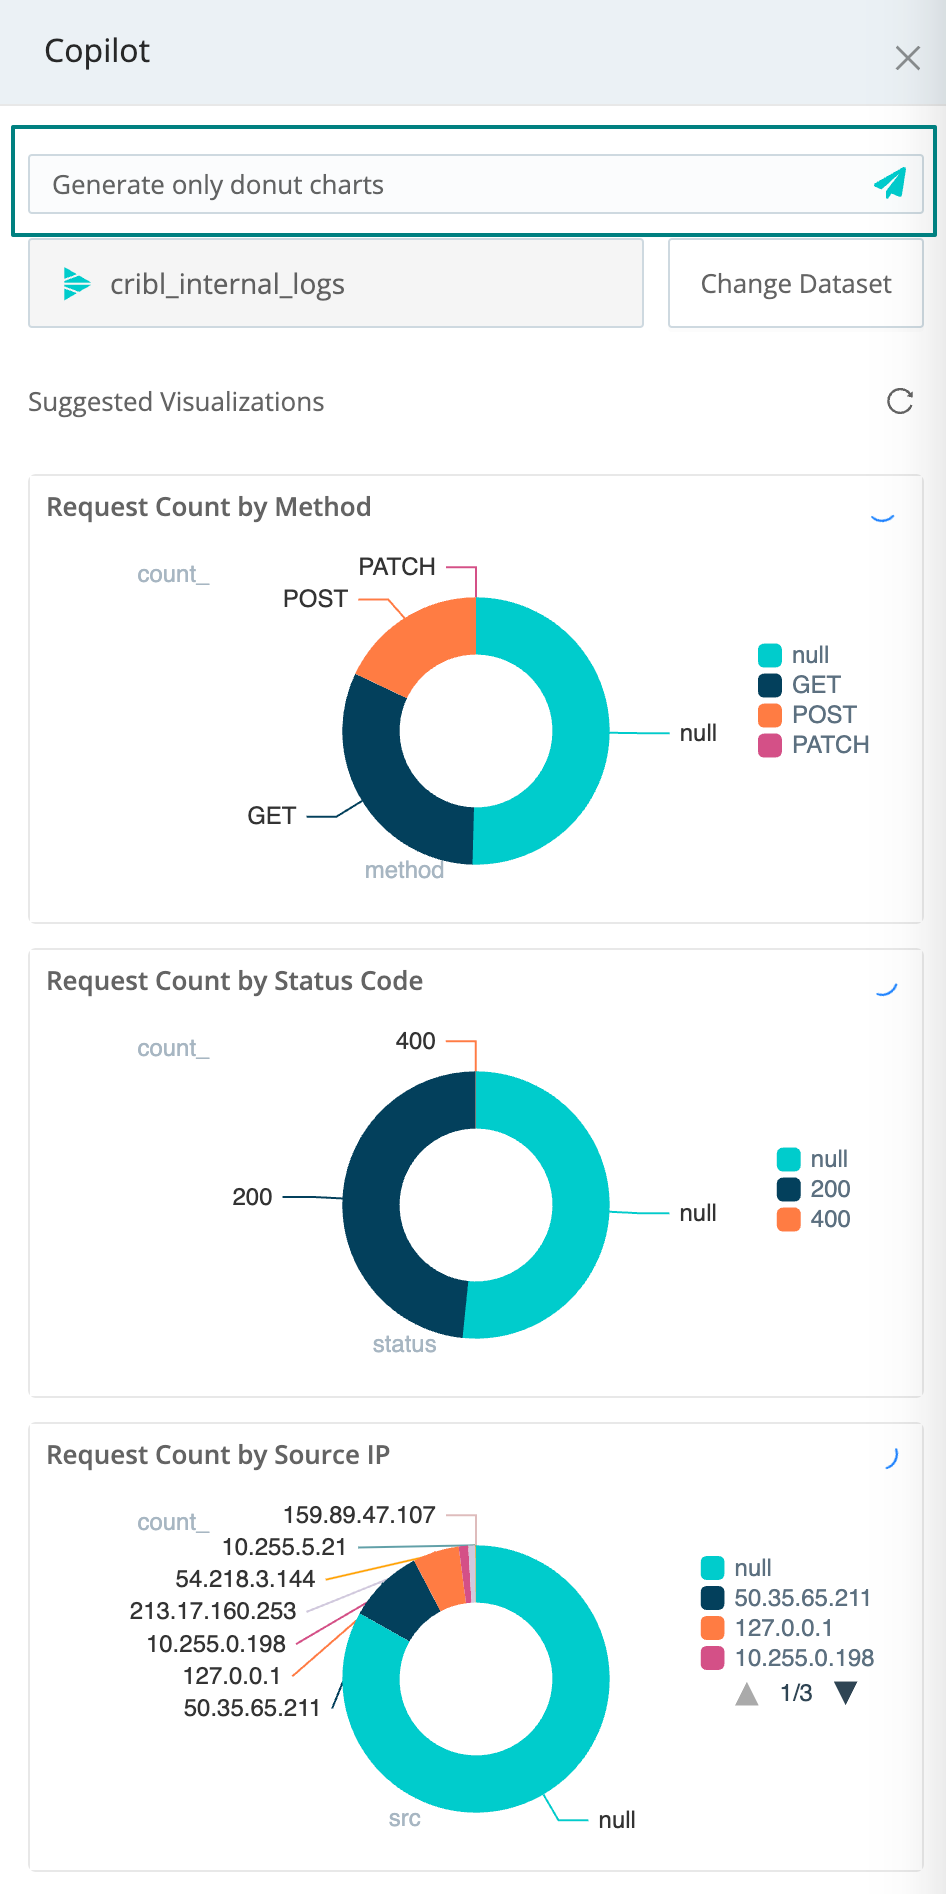
To refine your results, describe your preferences in everyday language in the text box at the top of the Copilot drawer.
For more information about working with Dashboards in Cribl Search, see Create a Dashboard and Edit a Dashboard.