


Add Inputs to Your Cribl Search Dashboard
Enable Dashboard viewers to control visualizations through interactive widgets.
Why Use Dashboard Inputs
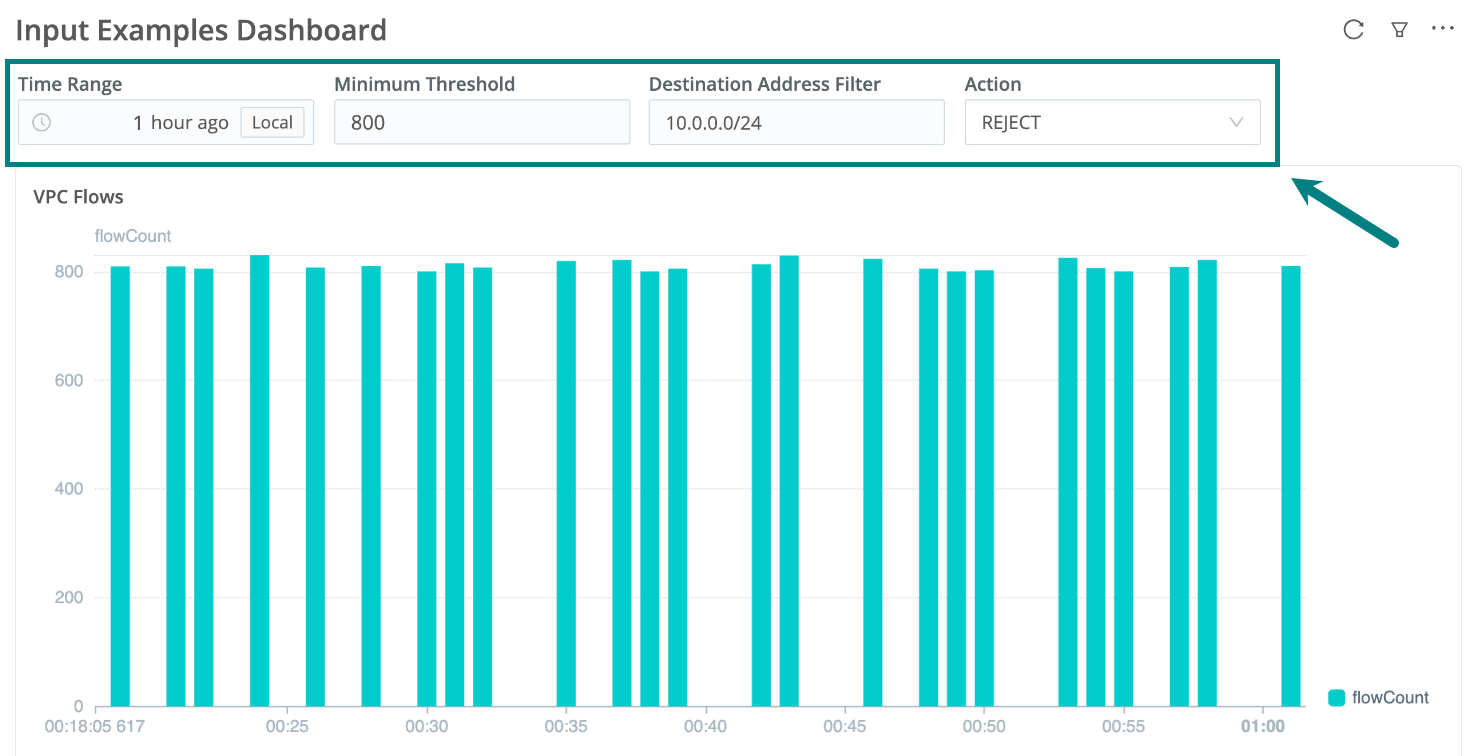
An Input is a small interactive area at the top of your Dashboard. When a user selects or enters values, the linked visualizations update to reflect the new criteria. This allows Dashboard viewers to quickly filter data, without needing to directly edit the underlying search queries.
Dashboard Input Types
Using different types of Inputs, you can enable Dashboard viewers to:
- Change the time range of visualizations, with a Time Range Input. New Dashboards include a default Time Range Input.
- Filter visualizations by freeform text, with a Text Input.
- Filter visualizations by numbers, with a Number Input.
- Filter visualizations by a preconfigured set of dynamic values, with a Dropdown Input.
Add a Dashboard Input
To add an Input to a new or existing Dashboard:
- Go to the Dashboards page in Cribl Search: On the top bar, select Products > Search > Dashboards.
- In an open Dashboard, select Edit
 at the top right, or press E on your
keyboard.
at the top right, or press E on your
keyboard. - At the top right, select Add > Input. Give the Input a title.
- Set the Input ID. You’ll reference this ID in the searches that you want the Input to control. Use alphanumeric characters, underscores, and hyphens only.
- In the Type drop-down, select the Input type you want. See the details about each type:
- When done, select Save at the top of the Dashboard. (To skip this step, see Auto-Apply Input Changes.)
Now, link the Input to one or more visualizations in the Dashboard.
Link a Dashboard Input to a Visualization
After adding an Input to a Dashboard, you need to link it to one or more visualization panels. This way, when a user interacts with the Input, the linked visualizations update accordingly.
- Add an Input to your Dashboard.
- Add or edit a visualization panel that you want to control.
- Depending on the Input type, follow the specific linking instructions:
Enable Viewers to Change the Time Range of a Visualization
With a Time Range Input, you can enable viewers to control the time range of the visualization panels using a timepicker at the top of your Dashboard.
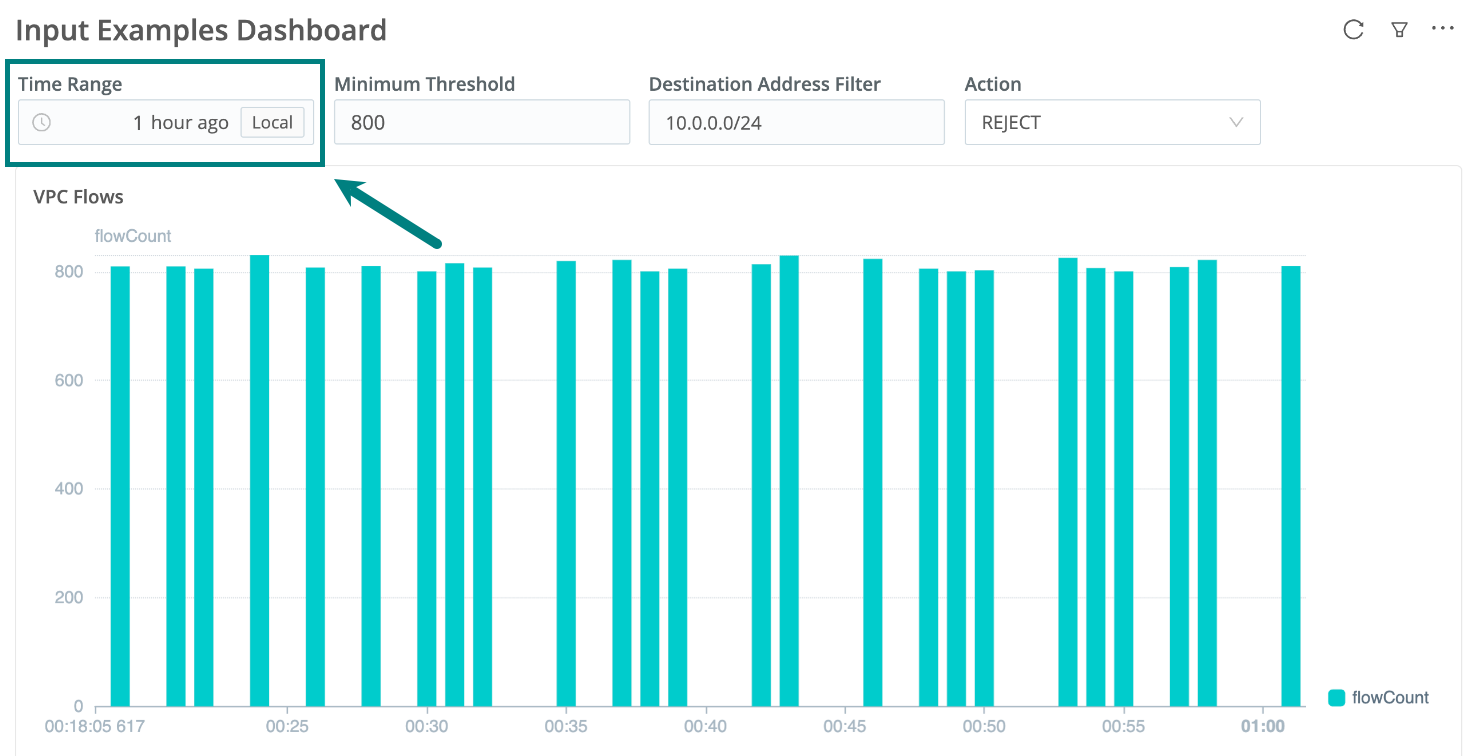
The Default Time Range Input
New Dashboards come with a Time Range Input already in place, so you don’t have to add one and link each panel by hand.
It’s titled Time Range, its Input ID is time, and its default value is the last hour.
Every visualization panel you add afterward links to this Input automatically. As a result, all panels on the Dashboard share one time range, and viewers can change the time range for the whole Dashboard in one place.
Cribl Search adds the default Time Range Input when you:
- Create a Dashboard from the Dashboards page, including within a Pack.
- Add a search to a new Dashboard from search results, the History or Saved Searches tab, or a Notebook. In this case, the Input takes its default value from the time range of the search you added.
Auto-linking depends only on the Input ID. As long as a Dashboard has a Time Range Input whose ID is time, new panels
link to it. So you can retitle, move, or recreate the default Input without losing auto-linking. You can also enable
auto-linking on an older Dashboard, by adding a Time Range Input with the ID time.
Deleting the default Input is also allowed, but it affects your panels:
- Panels you add afterward are no longer linked. Each one gets its own time range, set to the last hour.
- Panels that were already linked keep pointing at the Input you deleted, and their date and time field reads
Invalid input link. Give each one its own time range, or add a Time Range Input with the ID
timeagain to restore the link.
Cribl Search does not add the default Time Range Input when you create a Dashboard from the Products sidebar or through the API. Cloning a Dashboard, or importing a Dashboard configuration into an existing Dashboard, keeps the Inputs that are already defined. In all these cases, add a Time Range Input yourself if you want panels to share a time range.
Add a Time Range Input
To add a Time Range Input to a Dashboard that doesn’t have one:
- In an open Dashboard, select Edit
at the top right, or press E on your
keyboard.
- At the top right, select Add > Input. Give the Input a title.
- Set the Input ID. Use alphanumeric characters, underscores, and hyphens only.
Use the IDtimeif you want new panels to link to this Input automatically. - In the Type drop-down, select Time Range.
- Set the Default value in the timepicker. This is the time range applied when the Dashboard first loads. You can select a calendar period such as Yesterday or Previous month, or set a custom range. For the calendar presets, see Quick Actions.
- When done, select Save at the top of the Dashboard. (To skip this step, see
Auto-Apply Input Changes.)
The new Input appears at the top of your Dashboard, where you can edit, clone, or delete it.
Link a Visualization to a Time Range Input
Panels that Cribl Search didn’t link for you, and panels that you’ve unlinked, need to be linked manually:
- Add or edit a visualization panel that you want to control.
- Select the clock button in the date and time selector.
- Select the Link tab.
- In Time range input, select the Time Range Input to link to, and then select Apply.
The visualization’s date and time field now reads Linked to the Input ID.
Time range with linked Input
Now, when viewers select a time range in the Input, the linked visualizations update.
If the field reads Invalid input link, the panel points at an Input ID that no longer exists on the Dashboard. Either link the panel to an existing Input, or give the panel its own time range.
Unlink a Visualization from a Time Range Input
To give a panel a time range of its own, independent of the Time Range Input on the Dashboard:
- Edit the visualization panel.
- Select the clock button in the date and time selector.
- On the Relative, Date Range, or Around tab, set the time range you want, and then apply it.
Setting a time range directly replaces the link, and the panel keeps this time range no matter what viewers select in the Input.
Set the Time Range by Dragging Across a Chart
Viewers can narrow the shared time range straight from a chart, without opening the timepicker. On a chart panel whose horizontal axis is time, drag across the area you want to inspect. When you release, the Time Range Input updates to the range you selected, and every panel linked to that Input reruns.
This works only on panels that are linked to a Time Range Input. Panels with their own time range, and charts that don’t plot time on the horizontal axis, ignore the drag.
Enable Viewers to Filter a Visualization by Text
Using a Text Input, you can enable Dashboard viewers to enter freeform text so that linked visualization panels display only data with that text value. Think of this as a free-text search box.
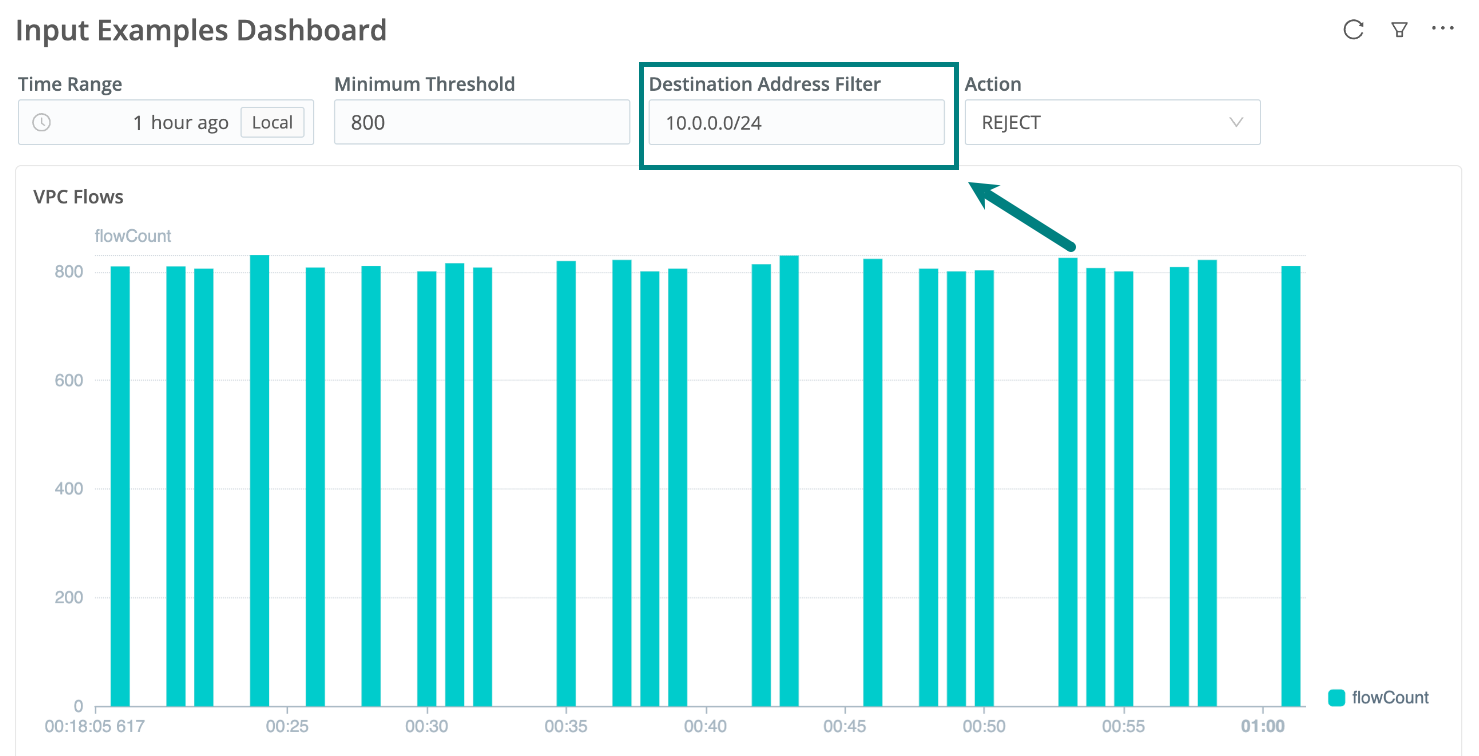
First, add a Text Input:
- In an open Dashboard, select Edit
at the top right, or press E on your
keyboard.
- At the top right, select Add > Input. Give the Input a title that gives the Dashboard viewer an idea of what they can type.
- Set the Input ID. Use alphanumeric characters, underscores, and hyphens only.
- In the Type drop-down, select Text.
- Set the text field’s Default value. This is the filter applied when the Dashboard first loads.
- When done, select Save at the top of the Dashboard. (To skip this step, see Auto-Apply Input Changes.) The new Input appears at the top of your Dashboard, where you can edit, clone, or delete it.
Then, link your Text Input to one or more visualizations:
- Add or edit a visualization panel that you want to filter.
- In the visualization’s search query, reference the Input ID of the Text Input you just created. Surround the ID
by
$. For example, if the Input ID isfirstname, use$firstname$.
Now, when viewers type into the Input text field, the linked visualizations update.
Enable Viewers to Filter a Visualization by Numbers
Using a Number Input, you can enable Dashboard viewers to filter visualizations by a number they enter into a simple text area at the top of your Dashboard.
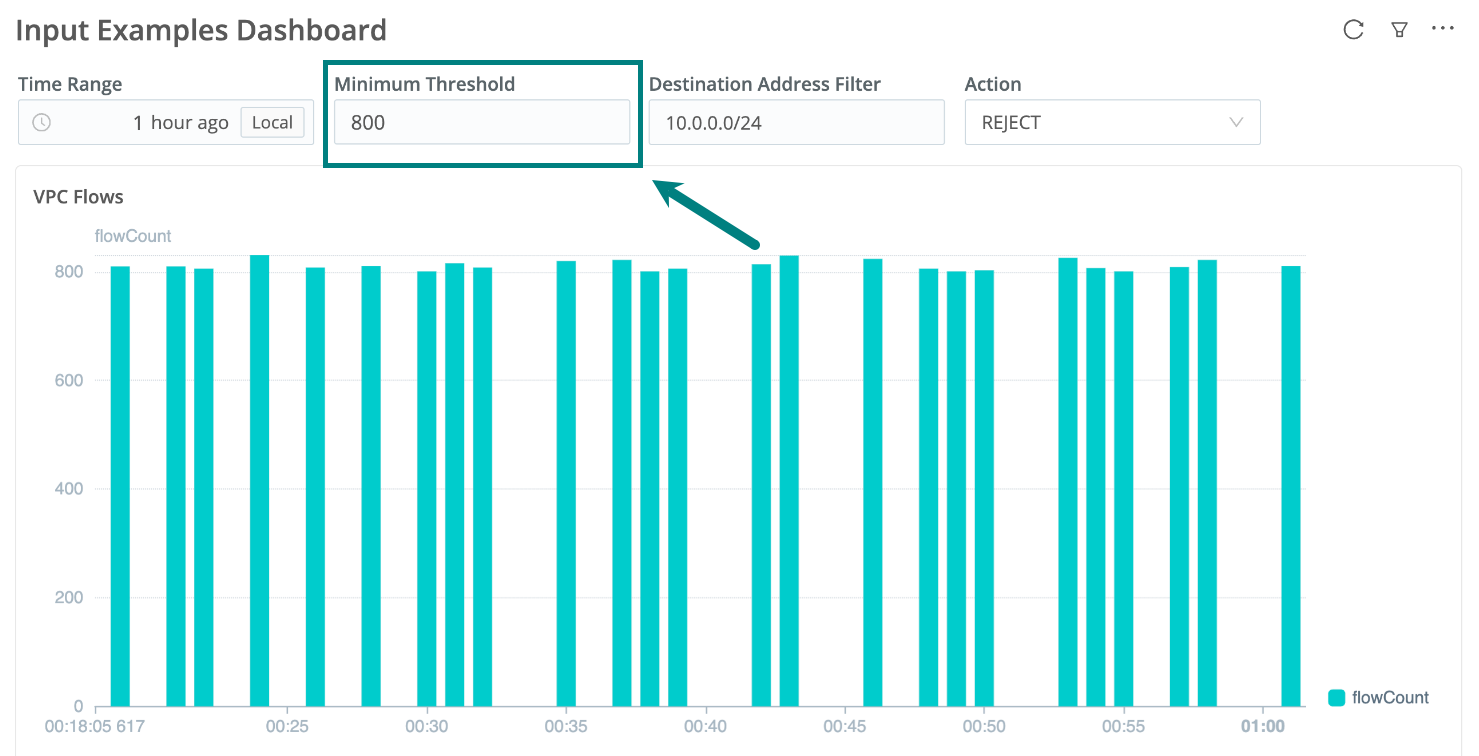
First, add a Number Input:
- In an open Dashboard, select Edit
at the top right, or press E on your
keyboard.
- At the top right, select Add > Input. Give the Input a title that gives the Dashboard viewer an idea of what they can type.
- Set the Input ID. Use alphanumeric characters, underscores, and hyphens only.
- In the Type drop-down, select Number.
- Set the number field’s Default value. This is the filter applied when the Dashboard first loads.
- You can set the Minimum value and Maximum value, to restrict what viewers can enter.
- When done, select Save at the top of the Dashboard. (To skip this step, see Auto-Apply Input Changes.) The new Input appears at the top of your Dashboard, where you can edit, clone, or delete it.
Then, link your Number Input to one or more visualizations:
- Add or edit a visualization panel that you want to filter.
- In the visualization’s search query, reference the Input ID of the Number Input you just created. Surround the ID
by
$. For example, if the Input ID isvalue, use$value$.
Now, when viewers type into the Input number field, the linked visualizations update.
Enable Viewers to Filter a Visualization by Drop-Down Options
Using a Dropdown Input, you can enable Dashboard viewers to filter visualizations by selecting one or more values from a drop-down list at the top of your Dashboard.
The list of values can be static or dynamic. With a static list, you configure all the options available to the user. With a dynamic list, the results of a search provide the values for the drop-down.
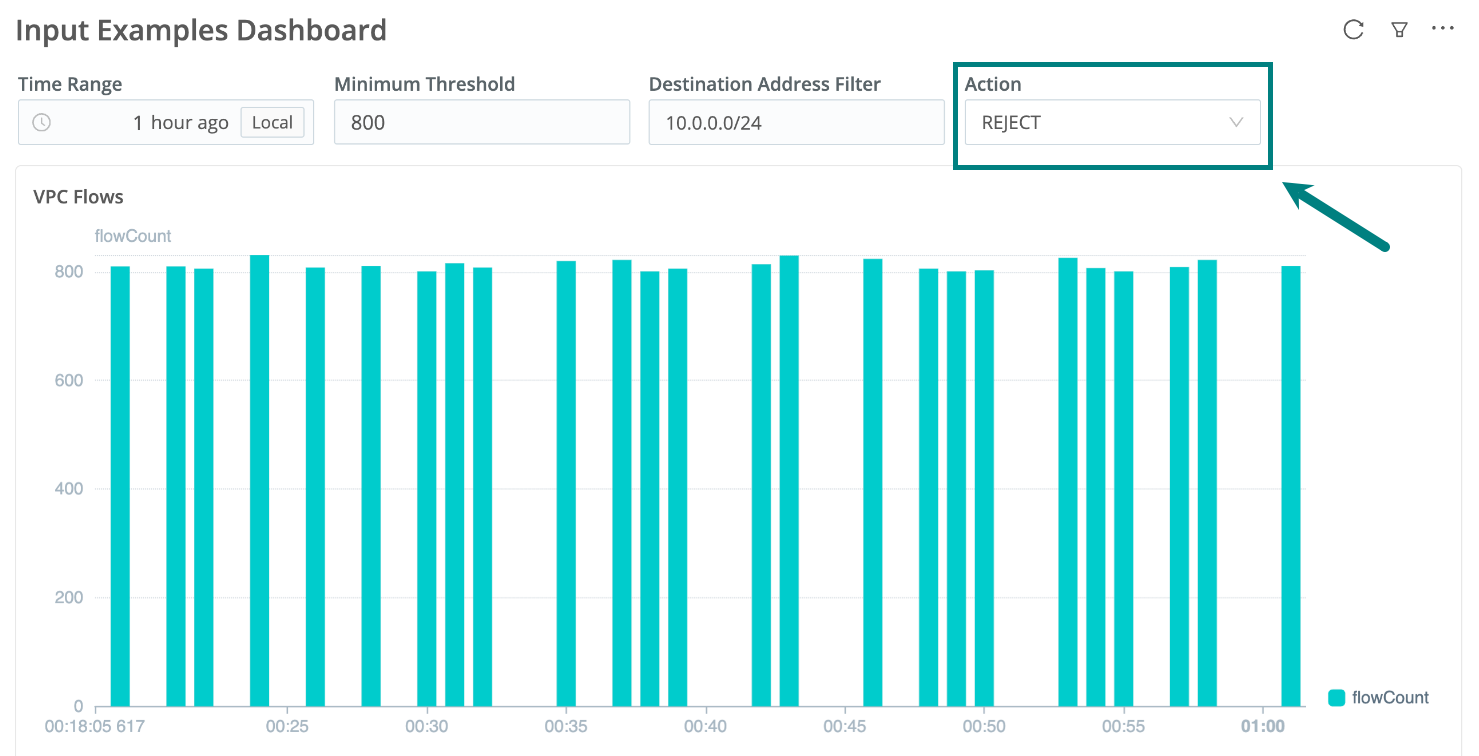
First, add a Dropdown Input:
- In an open Dashboard, select Edit
at the top right, or press E on your
keyboard.
- At the top right, select Add > Input.
- Set the Input ID. Use alphanumeric characters, underscores, and hyphens only.
- In the Type drop-down, select Dropdown.
- Select how to populate the drop-down list: New search, Saved search, or Manually add dropdown items.
- In the Field name (with the search options) or in the Values (with the manual option), enter a caption to help the viewer understand the item’s purpose.
- When done, select Save at the top of the Dashboard. (To skip this step, see
Auto-Apply Input Changes.)
The new Input appears at the top of your Dashboard, where you can edit, clone, or delete it.
Then, link your Dropdown Input to one or more visualizations:
- Add or edit a visualization panel that you want to control.
- In the visualization’s search query, reference the Input ID of the Dropdown Input you just created. Surround the
ID by
$. For example, if the Input ID isfirstname, use$firstname$.
Auto-Apply Input Changes
You can auto-apply your Dashboard Inputs changes, without having to confirm them. To set this up for a Dashboard:
- Go to the Dashboards page in Cribl Search: On the top bar, select Products > Search > Dashboards.
- Open a Dashboard.
- At the top right of the Dashboard, select the Actions button.
- Select Apply Input Changes Automatically.