


Edit a Dashboard
Learn how to edit a Dashboard in Cribl Search.
Within a Dashboard, you can add and edit visualization panels. You can also add Dashboard-level Inputs that apply to all visualizations on the Dashboard.
To edit the built-in Sample Dashboard, you need to clone it first. Go to Dashboards > Sample Dashboard > > Clone.
Add a Visualization
- In an open Dashboard, select Edit
 at the top right, or press e on your keyboard.
 - From the Add drop-down, select Visualization.
Next, choose how to define your visualization: by reviewing Cribl Copilot AI suggestions; or by configuring it yourself, based on a new or existing search.
Cribl Copilot AI Suggestions
To have Cribl Copilot suggest visualizations that display your data effectively:
- At the top of the page, select the Cribl Copilot button .
- The right drawer, now labeled Copilot, will prompt you to select or change the base Dataset for this visualization.
- From the tiles that Cribl Copilot suggests, select Add to add the visualization you choose.
For details, see Add a Visualization when Editing a Dashboard.
New Search
If you want to base your visualization on a New Search (the default setting in the right drawer):
- Either enter your query directly, or select a Parent search ID to pre-populate your query from a parent search (see Apply a Parent Search below).
- Optionally, if you’ve started with a parent search, you can append terms to the query before proceeding.
- Select Search.
To start over, select Reset. This clears the query and all chart settings.
Existing Search
If you prefer to base your visualization on an existing saved search (which can be a scheduled search):
- In the right drawer, select Saved.
- Select a Saved search ID to populate your query.
- Optionally, append terms to the query before proceeding.
- Set the Run mode:
- Run as new search - Always rerun the query, even if the Dashboard has data caching enabled.
- Fetch results from last run - Get results from the most recent run. (If the Dashboard has data caching enabled, Cribl Search will ignore this setting.) Cribl recommends selecting this option if you’re basing this visualization on a scheduled search.
- Select Search.
To start over, select Reset. This clears the query and all chart settings.
Edit a Visualization
To edit an existing visualization:
- Open an existing Dashboard.
- At the top right of the visualization panel you want to modify, select Edit
. Depending
on the layout, you might need to select the Actions
button first.
- Edit the visualization just like you edit a Chart display. The options available depend on the Chart type used.
If you add a visualization by creating a new search, you’ll see additional options to configure the type, format, and data display of the visualization.
If you create a visualization from a saved search, you can select Edit
at the
visualization panel’s top right to revise the visualization.
Hide a Visualization
You can hide any visualization panel by editing it and selecting the Hide this panel check box.
- In Dashboard edit mode, hidden panels are collapsed into a Hidden Panels section.
- To unhide a panel, edit the panel and clear the Hide this visualization check box.
Interact with Visualizations in a Dashboard
Within any visualization panel, you can hover over graphics or expand list events to see more details. Also, the Actions buttons on the Dashboard, and on individual panels, offer further options.
Organize Dashboard Layout
Rearrange Visualization Panels
To arrange the visualizations in a Dashboard, select Edit
at the top right, or press
e on your keyboard. Use the drag handle at the top of any panel to drag it to a new position, and use the resize
 handle at the bottom right or left to resize it.
Create a Dashboard Group
You can organize related panels into Groups. Groups create labeled sections within a Dashboard and can be collapsed or expanded to simplify large dashboards.
To create a group:
- Open a Dashboard and select Edit
.
- Create the group:
- If the Dashboard is empty, select Add Group.
- If the Dashboard already has content, select Add > Group.
- Enter a Group title, then select Save.
Add Panels to a Group
While in Edit mode, from the group header select Add, then choose one of the following:
- Visualization
- Markdown
Configure the panel and save it.
Move Panels Into or Between Groups
While in Edit mode, drag panels into the group container. You can also drag panels between groups or move them out of a group.
Manage Groups
From the group header, you can:
- Rename the group using the More Actions menu and selecting Edit.
- Reorder groups using the More actions menu and selecting Move Up or Move Down.
- Collapse or expand the group to show or hide its panels.
Delete a Group
- In the group header, open the More actions menu.
- Select Delete.
Deleting a group also deletes the panels inside it. Move panels out of the group first if you want to keep them.
Refresh Visualizations
Refresh the data in a visualization by clicking the Refresh
 button at the top right of the
panel.
button at the top right of the
panel.
To refresh all of the Dashboard’s visualizations automatically, see Refresh Your Dashboards Automatically.
Manage Visualizations
Select a visualization panel’s own Actions button to expose the menu options shown below.
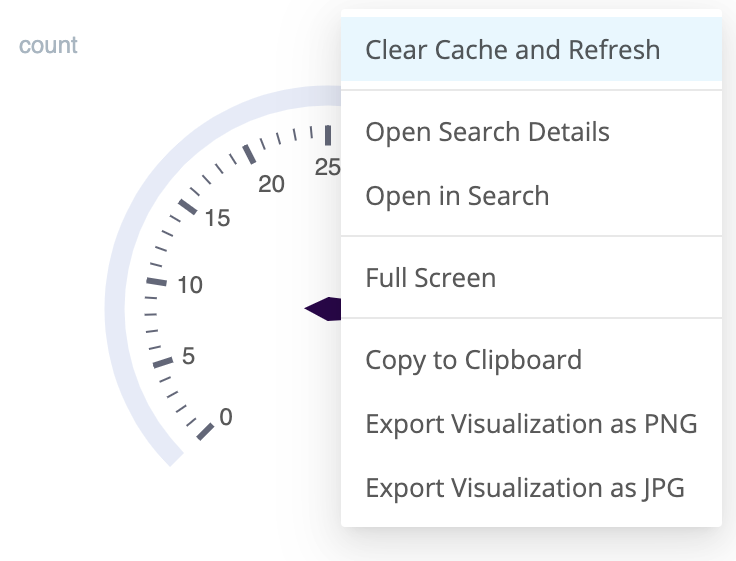
The options here include:
- Edit: Opens the visualization panel for editing.
- Clear Cache and Refresh: A hard refresh of the visualization, to match current underlying data.
To refresh all of the Dashboard’s visualizations automatically, see Refresh Your Dashboards Automatically. - Open Search Details: Opens a read-only version of the Details modal, listing the search’s query expression, execution times, and duration.
- Open in Search: Opens an editable version of the query expression.
- Full Screen: Zooms up an expanded display of the visualization, in a modal within your browser window.
- Copy to Clipboard: Copies the current visualization, as a static image, to the system clipboard.
- Export Visualization as PNG/JPG: Saves the current visualization as a static image in
.pngor.jpgformat.
Apply a Parent Search
To reduce effort and significantly improve Dashboard loading time, you can reuse search results by saving them as parent searches. You can instantly add an existing search query to a visualization panel by designating another visualization in the same Dashboard as the parent search. This enables you to aggregate results from both searches into the same visualization.
- Edit an existing Dashboard, and then select Edit
at the top right of the visualization
panel you want to modify.
- Under Parent search, select the name of the visualization you want to use as the parent.
- The parent search query becomes the new first line of your query in the Search box. Select Search to test your new aggregate query, and then select Save to save your Dashboard.
Hide a Parent Search
You can hide any visualization by editing it and selecting the Hide this panel check box. This can be especially useful for visualizations you create for the sole purpose of acting as parent searches.
Parent Search Limitations
You can apply only one parent search per visualization panel.
When you apply a parent search, child searches wait until the parent search has completed. So you will not see “preview” results.
When you’ve applied a parent search to a visualization, and you open that visualization (using Actions > Open in Search), you won’t be able to edit the child search’s time parameters. This is because the child search is using the parent search’s time span.
Like any other search, parent searches are bound by system limits and system Usage Group limits. Any aggregations in the child search will be based on the parent search’s results, so if the parent search’s results are capped, the child search’s aggregations may be incomplete.
Add Inputs
To enable viewers to filter and control visualizations in your Dashboard, you can add Dashboard-level Inputs. For more information, see Add Inputs to Your Cribl Search Dashboard.
Add Interactions
To enable viewers to drill down into details when they select Dashboard data points, you can add Interactions to visualization panels. For more information, see Add Interactions to Your Cribl Search Dashboard.
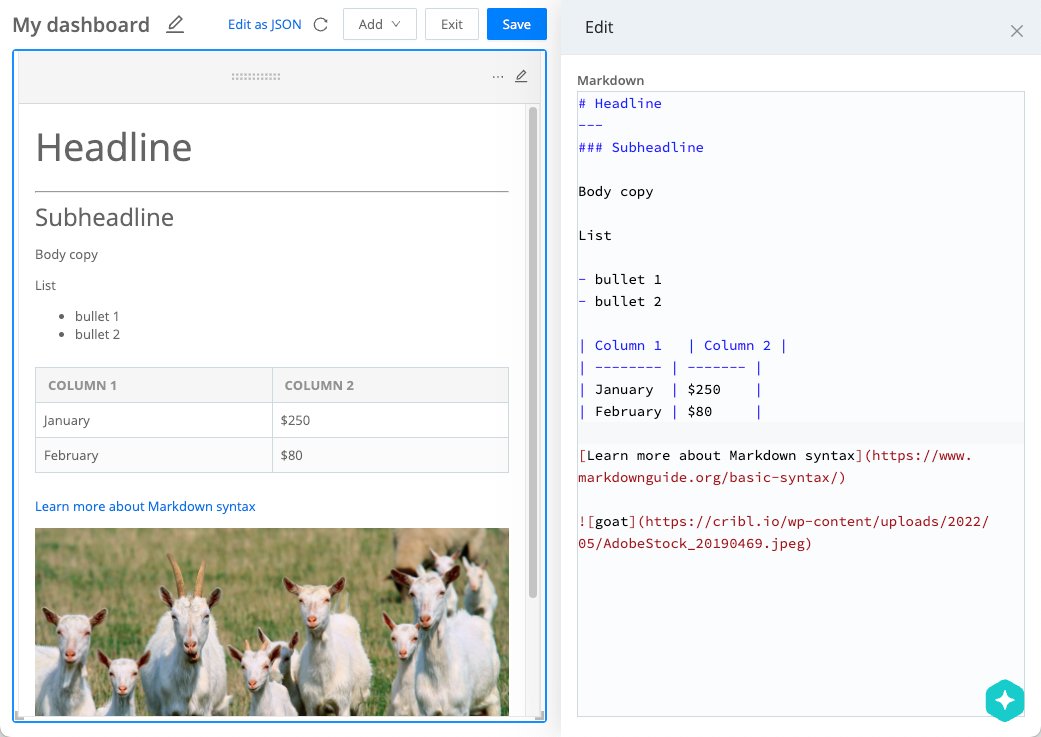
Add Markdown
You can add a Markdown panel to your Dashboard to enrich it with any custom text. Use markdown to add explanations, captions, and additional information to your Dashboard. To add a Markdown panel:
- In an open Dashboard, select Edit
at the top right, or press e on your keyboard.
- From the Add drop-down menu, select Markdown.
- In the Edit pane, replace the sample text with any markdown content you want.
The panel lets you use the features of Github-flavored markdown, including links, tables, codeblocks, and images (linking to external sources).
You can also use tokens, defined in Inputs, surrounded by$. For example, if the Input ID isfirstname, reference$firstname$in the markdown.
As you edit, you will see a live preview of the rendered text. - Select Save.
The Markdown panel doesn’t support raw HTML.
Rename a Dashboard
To change the name of an existing Dashboard:
- From the Cribl Search sidebar, select Dashboards.
- Select the row of the Dashboard that you want to rename.
- At the top, next to the current Dashboard name, select Settings, and then select the Edit
button.
- Enter the new Dashboard name, and select Save.
Edit Dashboards as JSON
You can edit your Dashboards in a JSON editor built into Cribl Search, or import and export JSON files with complete configurations. This can significantly speed up setting up more complex Dashboards.
To edit an existing Dashboard as JSON:
- From the Cribl Search sidebar, select Dashboards, and open a Dashboard.
- At the top right, select the Actions button.
- Select one of the following:
- Edit as JSON to open the Dashboard configuration in the Cribl Search JSON editor.
- Copy Dashboard JSON to copy the Dashboard JSON to clipboard.
- Export Dashboard JSON to download a JSON file with the Dashboard configuration.
- Import Dashboard JSON to upload a JSON file with a new configuration.
Refresh Your Dashboards Automatically
You can refresh a Dashboard automatically, either by running it on schedule, or by configuring its caching.
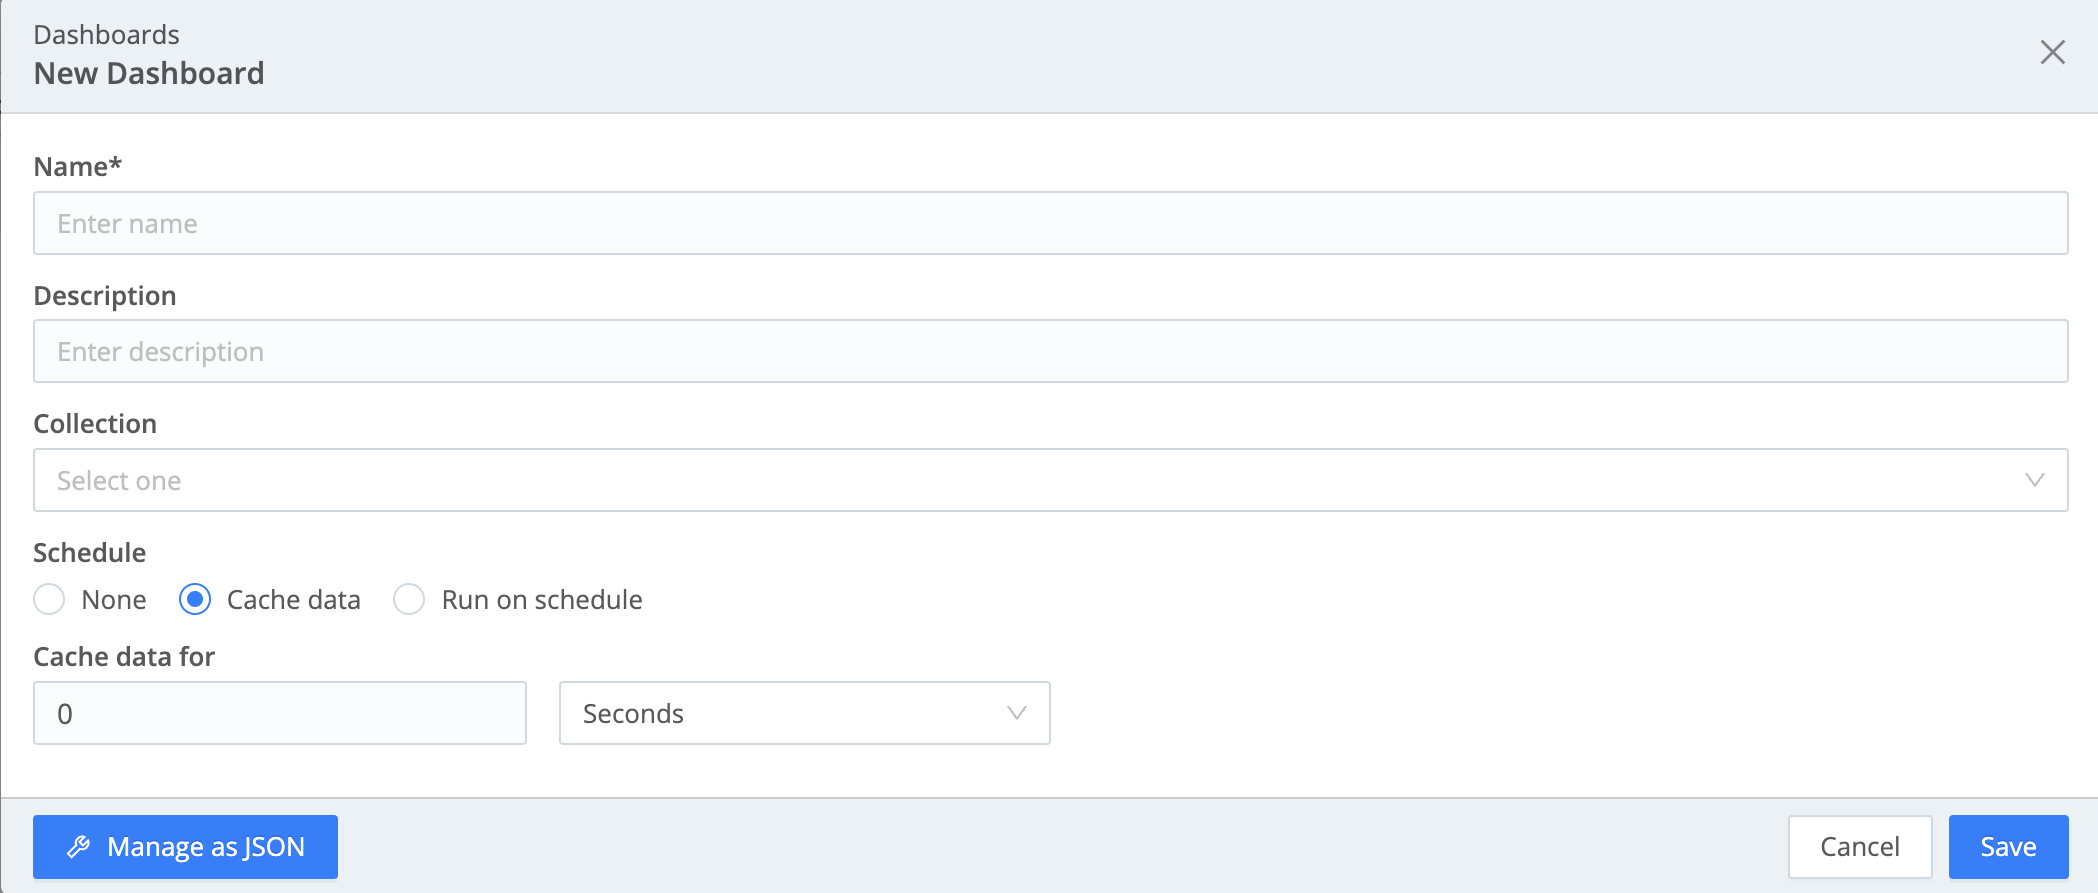
Configure a Dashboard’s Caching
You can modify the time for which a Dashboard is cached (in other words, how often it is refreshed). This setting is configured within the Schedule section of the Dashboard Settings modal.
- If you are creating a new Dashboard:
- Start creating a Dashboard. The New Dashboard modal opens automatically.
- If you are modifying an existing Dashboard:
- Open an existing Dashboard.
- Select the gear (⚙️) icon near the Dashboard name.
- In the dialog, select Edit
to open the Edit Dashboard modal.
- Under Schedule, select Cache data.
- In Cache data for, set the time-to-live (TTL) for the Dashboard cache. This setting defines how often data in the Dashboard is refreshed.
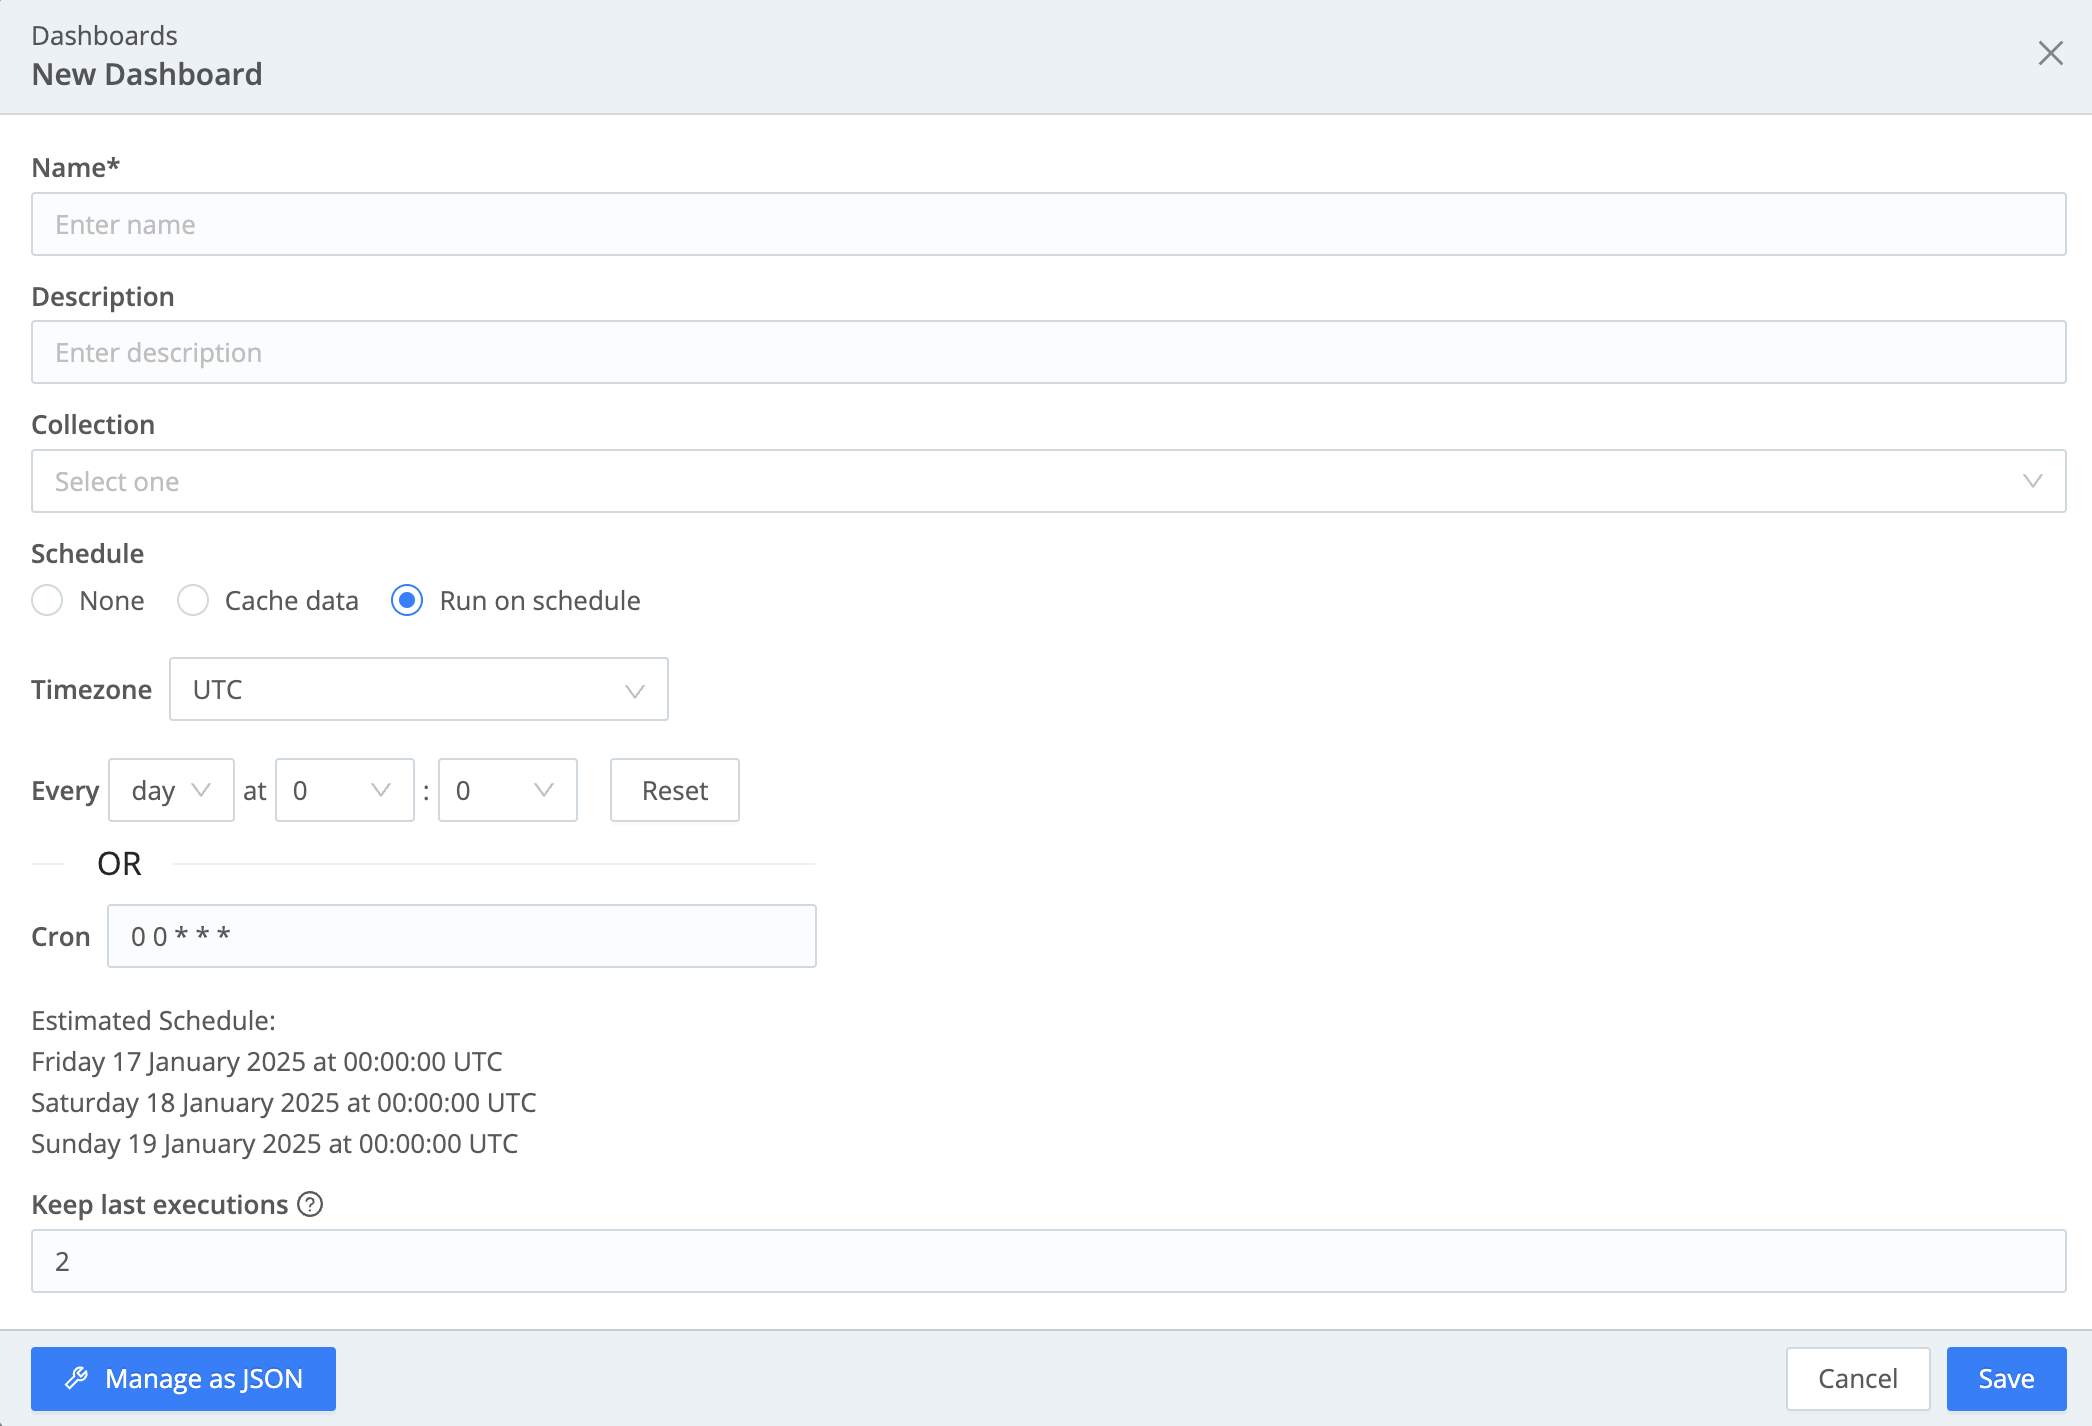
Run a Dashboard on Schedule
You can schedule the searches on all of a Dashboard’s visualizations to refresh on the default interval you define.
This can be advantageous on a Dashboard where you don’t need to display up-to-the-minute data, but you prefer not to wait for the display to refresh. Schedule the underlying searches to refresh daily, hourly, or every few minutes. When the visualizations render, they’ll fetch the results from the last scheduled run.
After scheduling the Dashboard as a whole, you retain the option to customize the schedules of the searches that underlie individual visualization panels and Inputs.
To run a Dashboard on a schedule:
- If you are creating a new Dashboard:
- Start creating a Dashboard. The New Dashboard modal opens automatically.
- If you are modifying an existing Dashboard:
- Open an existing Dashboard.
- Select the gear (⚙️) icon near the Dashboard name.
- In the dialog, select Edit
to open the Edit Dashboard modal.
- Under Schedule, select Run on schedule.
- Configure one of the two:
- Define the timezone, the base interval (anything from
yeardown tominute), and refresh time. - Or, define a Cron schedule string.
- Define the timezone, the base interval (anything from
- In Keep last executions, define how many past versions of the Dashboard data to keep.
This is a rolling buffer- on each refresh of the Dashboard, Cribl Search will purge the oldest version beyond this count. Defaults to
2.
- on each refresh of the Dashboard, Cribl Search will purge the oldest version beyond this count. Defaults to
Changing Scheduled Dashboard Ownership
If the creator of a scheduled Dashboard is no longer an active Cribl Search Member, active Members with access to the Dashboard will be unable to re-run the Dashboard. They will need to export the Dashboard’s configuration, then re-create the Dashboard by importing the config, and finally schedule the new Dashboard to run under their ownership. {.box .warning}
Cloning a Scheduled Dashboard
When you clone a Dashboard that has Run on schedule enabled, the schedule is automatically disabled in the cloned copy.
The schedule configuration (timezone, interval, or Cron string) is preserved, but it must be manually re-enabled. This prevents unintended duplicate scheduled searches.
Re-enable a Schedule on a Cloned Dashboard
- Open the cloned Dashboard.
- Select the gear (⚙️) next to the Dashboard title.
- In the dialog, select Edit
to open the Edit Dashboard modal.
- In the Edit Dashboard modal, select Run on schedule.
- Adjust settings as needed, and select Save.