



Get Data Into Cribl Search
Ingest logs and metrics into Cribl Search lakehouse engines for schema-aware searches and precisely scoped AI investigations.
Highlights
- Send directly into Cribl Search, auto-parsing events as they arrive.
- First, add a lakehouse engine and Search Datasets within it. Then, connect your Sources.
- Parse with Auto-Datatyping or your own Datatype rules, then route events with Log Dataset rules.
About Getting Data In
Next to running federated queries on external storage, Cribl Search can also ingest your data into lakehouse engines.
Lakehouse engines keep your data hot for up to 10 years, with no storage tiering to manage. This allows for:
- High-speed search for day-to-day investigations and incident response.
- Deeper AI-powered analysis, with structured data that makes exploration faster and more precise.
- Tight cost control through fixed-size engines and per-Dataset retention.
You don’t have to use Cribl Stream, Edge, or Lake. You can ingest directly into Cribl Search.
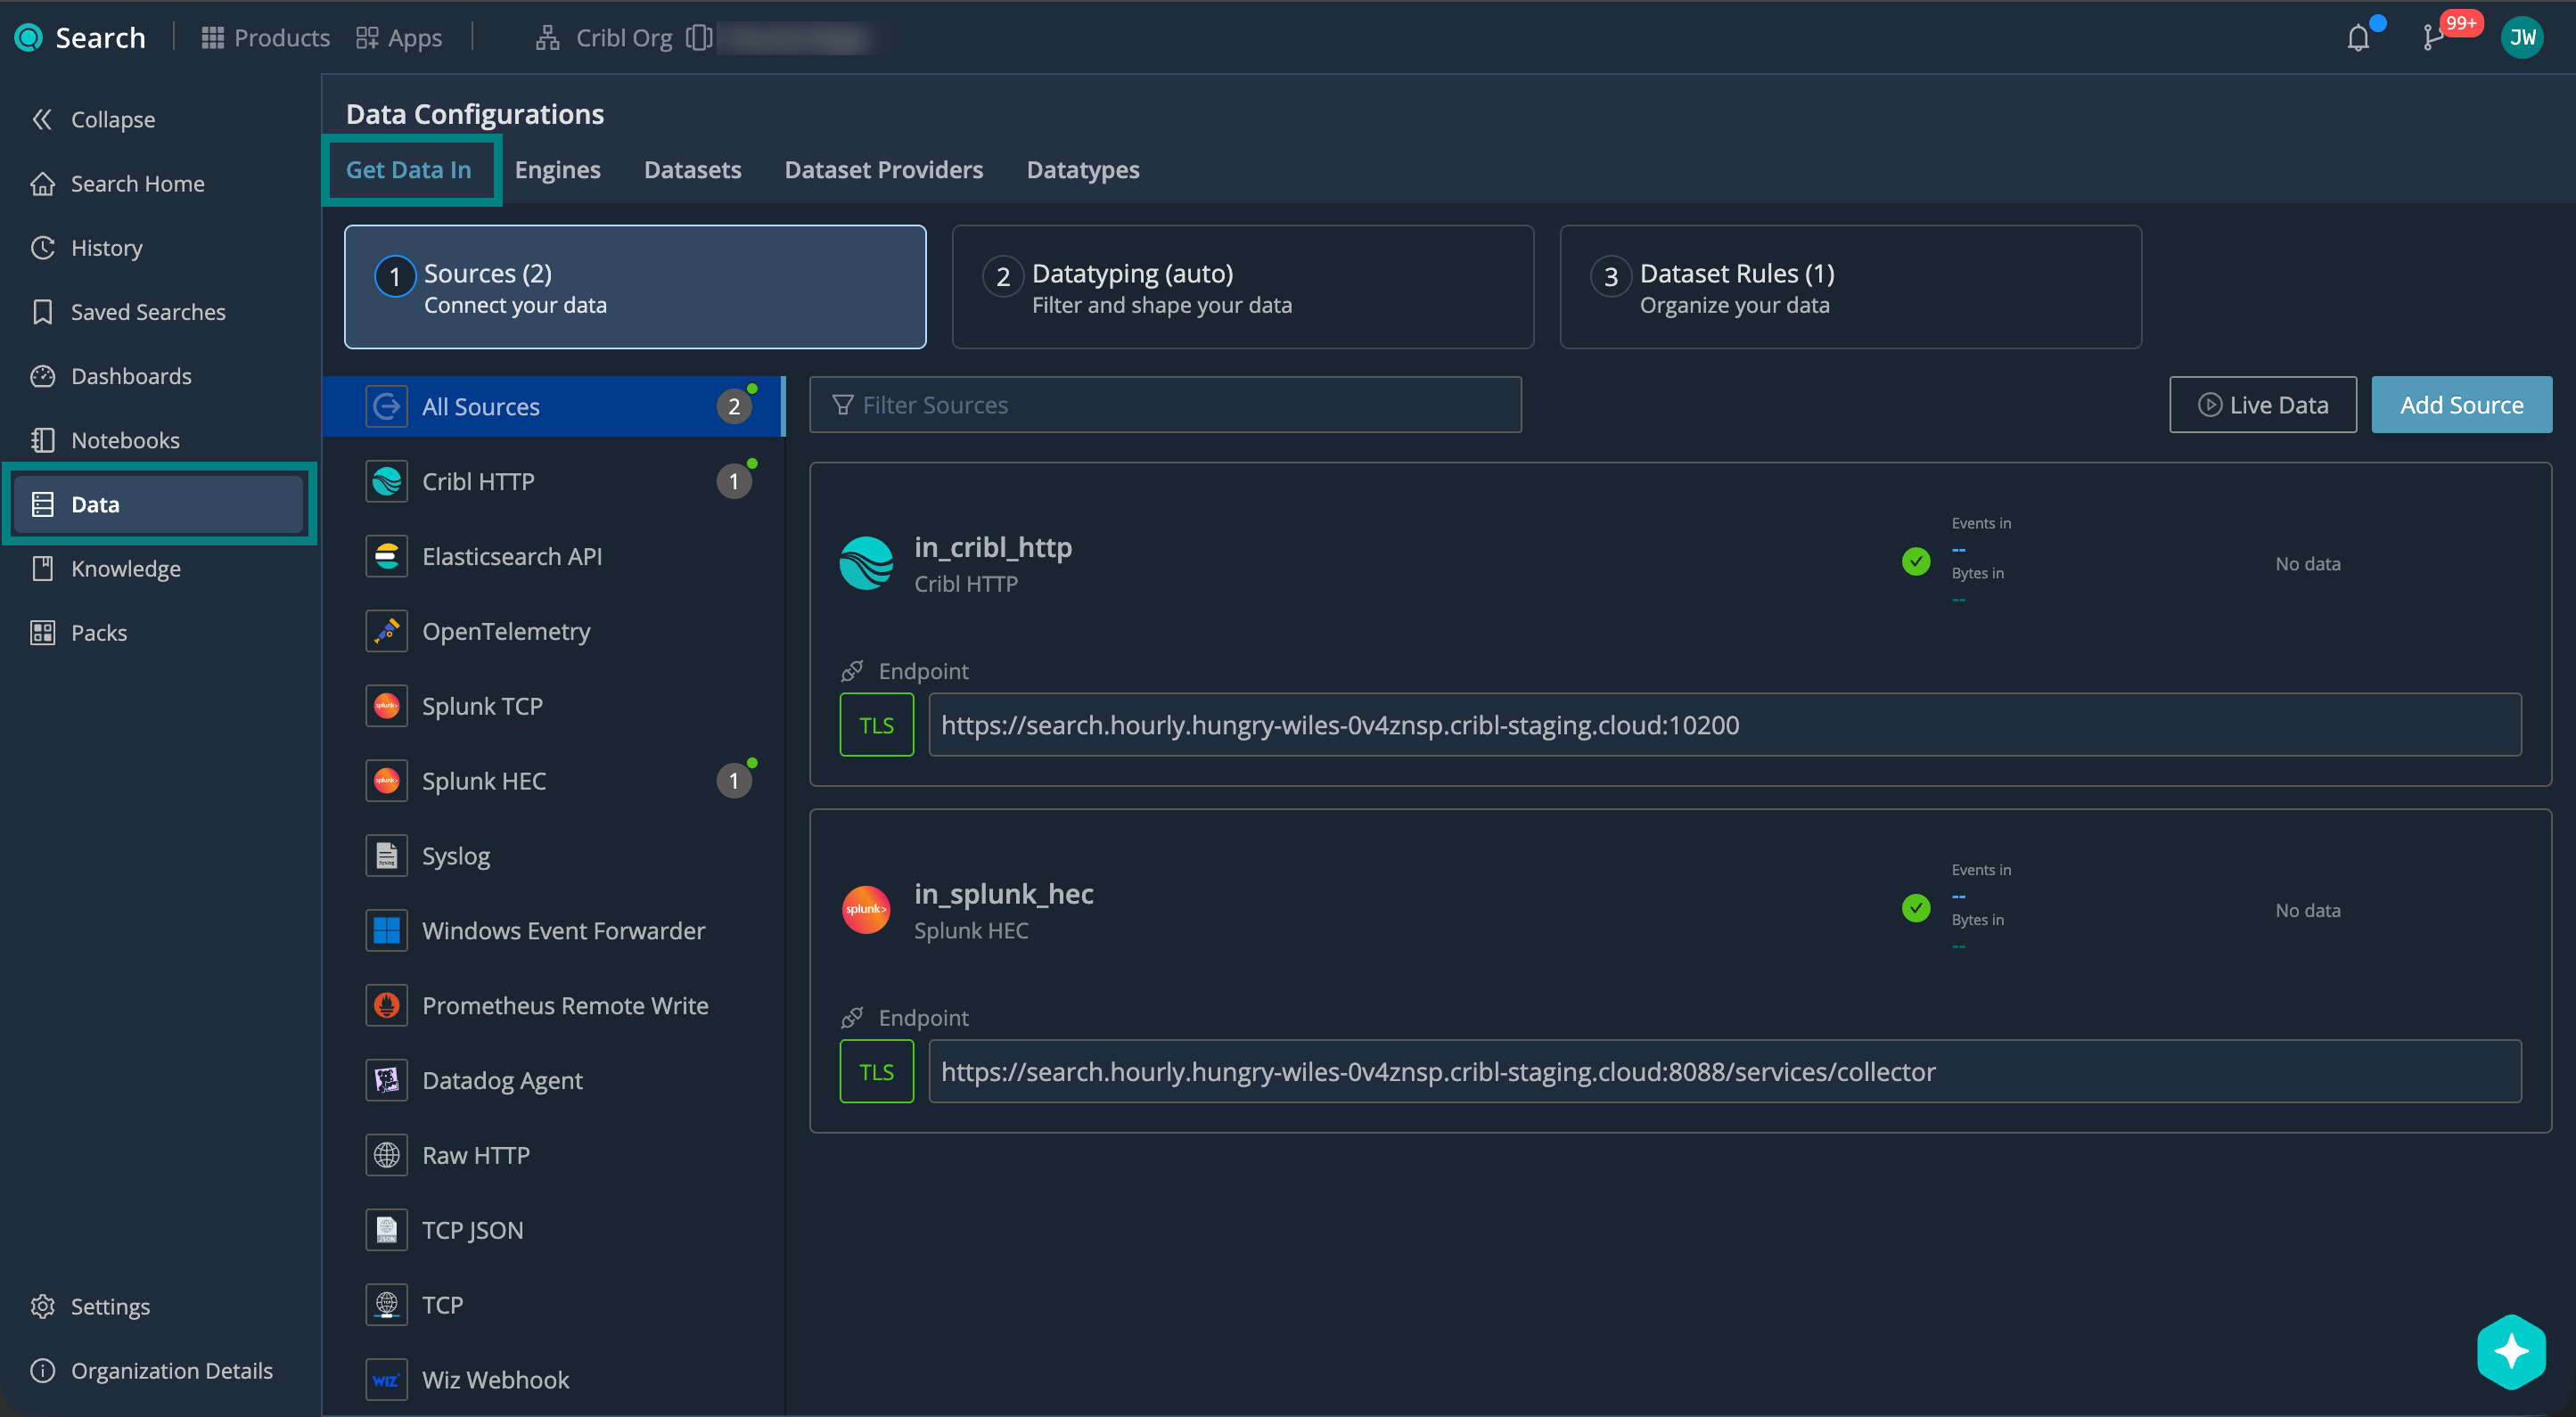
To get started, add your first lakehouse engine. This enables the Get Data In tab in the Cribl Search Data section:
Get Data In Permissions
You need the Editor or Admin Permission on Cribl Search to set up Sources, Datatyping, and Datasets, and the Admin Permission to add a lakehouse engine. See Cribl Search Permissions.
Data Onboarding Overview
The data onboarding workflow differs slightly between logs and metrics.
To ingest logs into Cribl Search:
- Add a Lakehouse Engine.
- Create Your Search Datasets.
- Connect Sources.
- Shape and Filter with Datatype Rules.
- Organize and Control Retention with Log Dataset Rules.
- Start Sending Logs and Verify.

1. Add a Lakehouse Engine
Create a lakehouse engine first. It provides the storage and compute layer for your ingested logs.
Choose an engine size based on your expected daily ingest. Adjust over time as needed.
See Lakehouse Engines in Cribl Search to add an engine, choose a size, and estimate costs.
2. Create Your Search Datasets
Prepare Search Datasets that you’ll later target with Log Dataset rules. This is where you set retention, from 1 day to 10 years, per Search Dataset.
See Create Search Datasets for planning guidance and step-by-step setup.
3. Connect Sources
With your lakehouse engine and Search Datasets ready, set up Sources in Cribl Search.
See Source Tutorials for end-to-end walkthroughs for each Source type.
4. Shape and Filter with Datatype Rules
Datatype rules control how incoming logs are parsed and labeled.
Start with Auto-Datatyping. If needed, add new rules for uncategorized events, or create your own custom Datatypes.
See Shape Data with Datatype Rules.
5. Organize and Control Retention with Log Dataset Rules
Log Dataset rules route parsed events into your Search Datasets, so each event lands where its retention, investigation window, and access make sense.
See Organize Data with Dataset Rules.
6. Start Sending Logs and Verify
Start sending logs from your upstream sender. Confirm that they arrive, parse, and route as expected using Live Data.
To ingest metrics into Cribl Search:
- Add a Lakehouse Engine.
- Connect a Metrics Source.
- Route with Metric Dataset Rules.
- Start Sending Metrics and Verify.

1. Add a Lakehouse Engine
Metrics are stored on a lakehouse engine, the same compute and storage that accelerates your logs.
Each engine comes with its own metrics Dataset, so you don’t create Search
Datasets for metrics, and you don’t set up Datatyping.
See Lakehouse Engines in Cribl Search to add an engine, choose a size, and estimate costs.
2. Connect a Metrics Source
Add a Source that accepts metrics, then point your upstream sender at it:
- Prometheus Remote Write receives metrics from a Prometheus client.
- OpenTelemetry receives OTLP metrics.
- Cribl HTTP receives native metric events from Cribl Stream or Cribl Edge.
- Datadog Agent receives Datadog metrics.
See Ingest Metrics into Cribl Search (Preview) for the settings each Source needs.
3. Route with Metric Dataset Rules
Metric Dataset rules route incoming metrics into a metrics Dataset. By default, a catch-all rule sends all metrics
to the primary metrics Dataset.
4. Start Sending Metrics and Verify
Start sending metrics from your upstream sender. Confirm that they arrive as expected using Live Data.
Source Tutorials
Set up your Source with step-by-step instructions:
- Cribl HTTP
- Datadog Agent
- Elasticsearch API
- OpenTelemetry
- Prometheus Remote Write
- Raw HTTP
- Splunk HEC
- Splunk TCP
- Syslog
- TCP
- TCP JSON
- Windows Event Forwarder
- Wiz Webhook
Next Steps
Once your data is in Cribl Search, you can: