


Convert Logs to Metrics
Preview Feature
Cribl is still developing this Preview feature. We don’t recommend using it in a production environment, because the feature might not be fully tested or optimized for performance, and related documentation could be incomplete.
Please continue to submit feedback through normal Cribl support channels, but assistance might be limited while the feature remains in Preview.
Convert your logs to metrics so you can chart them, add them to Dashboards, and monitor them as metric signals.
About Converting Logs to Metrics
Use the Metrics tab in Cribl Search to turn a log search into a stored metric. You choose an aggregation, such as a count of matching events per host. Cribl Search runs that aggregation on a schedule and writes the result to a metrics Dataset.
In the Metrics tab, Cribl Search configures the metric and writes the export query for you. It previews the result as a chart, saves the work as a scheduled search, and can run a backfill that writes historical points. The stored metric is the same as the one the manual logs to metrics pattern produces.
Once the metric exists, you can chart, visualize, and monitor the metric like any other metric.
Before You Begin
You need:
- A lakehouse engine. Cribl Search auto-provisions a
metricsDataset for each engine. - Read access to the
metricsDataset that you want to write to. See Metrics Permissions. - Permission to create saved searches.
- Update access to that Dataset, if you plan to use Backfill.
Start a Metric from a Log Search
- On the Cribl.Cloud top bar, select Products > Search.
- From the menu, select Logs.
- Set a time range, and enter a query that selects the logs you want to convert.
- Select Search to run the query.
- When the results appear, select the Metrics tab, next to Events, Fields, and Chart.
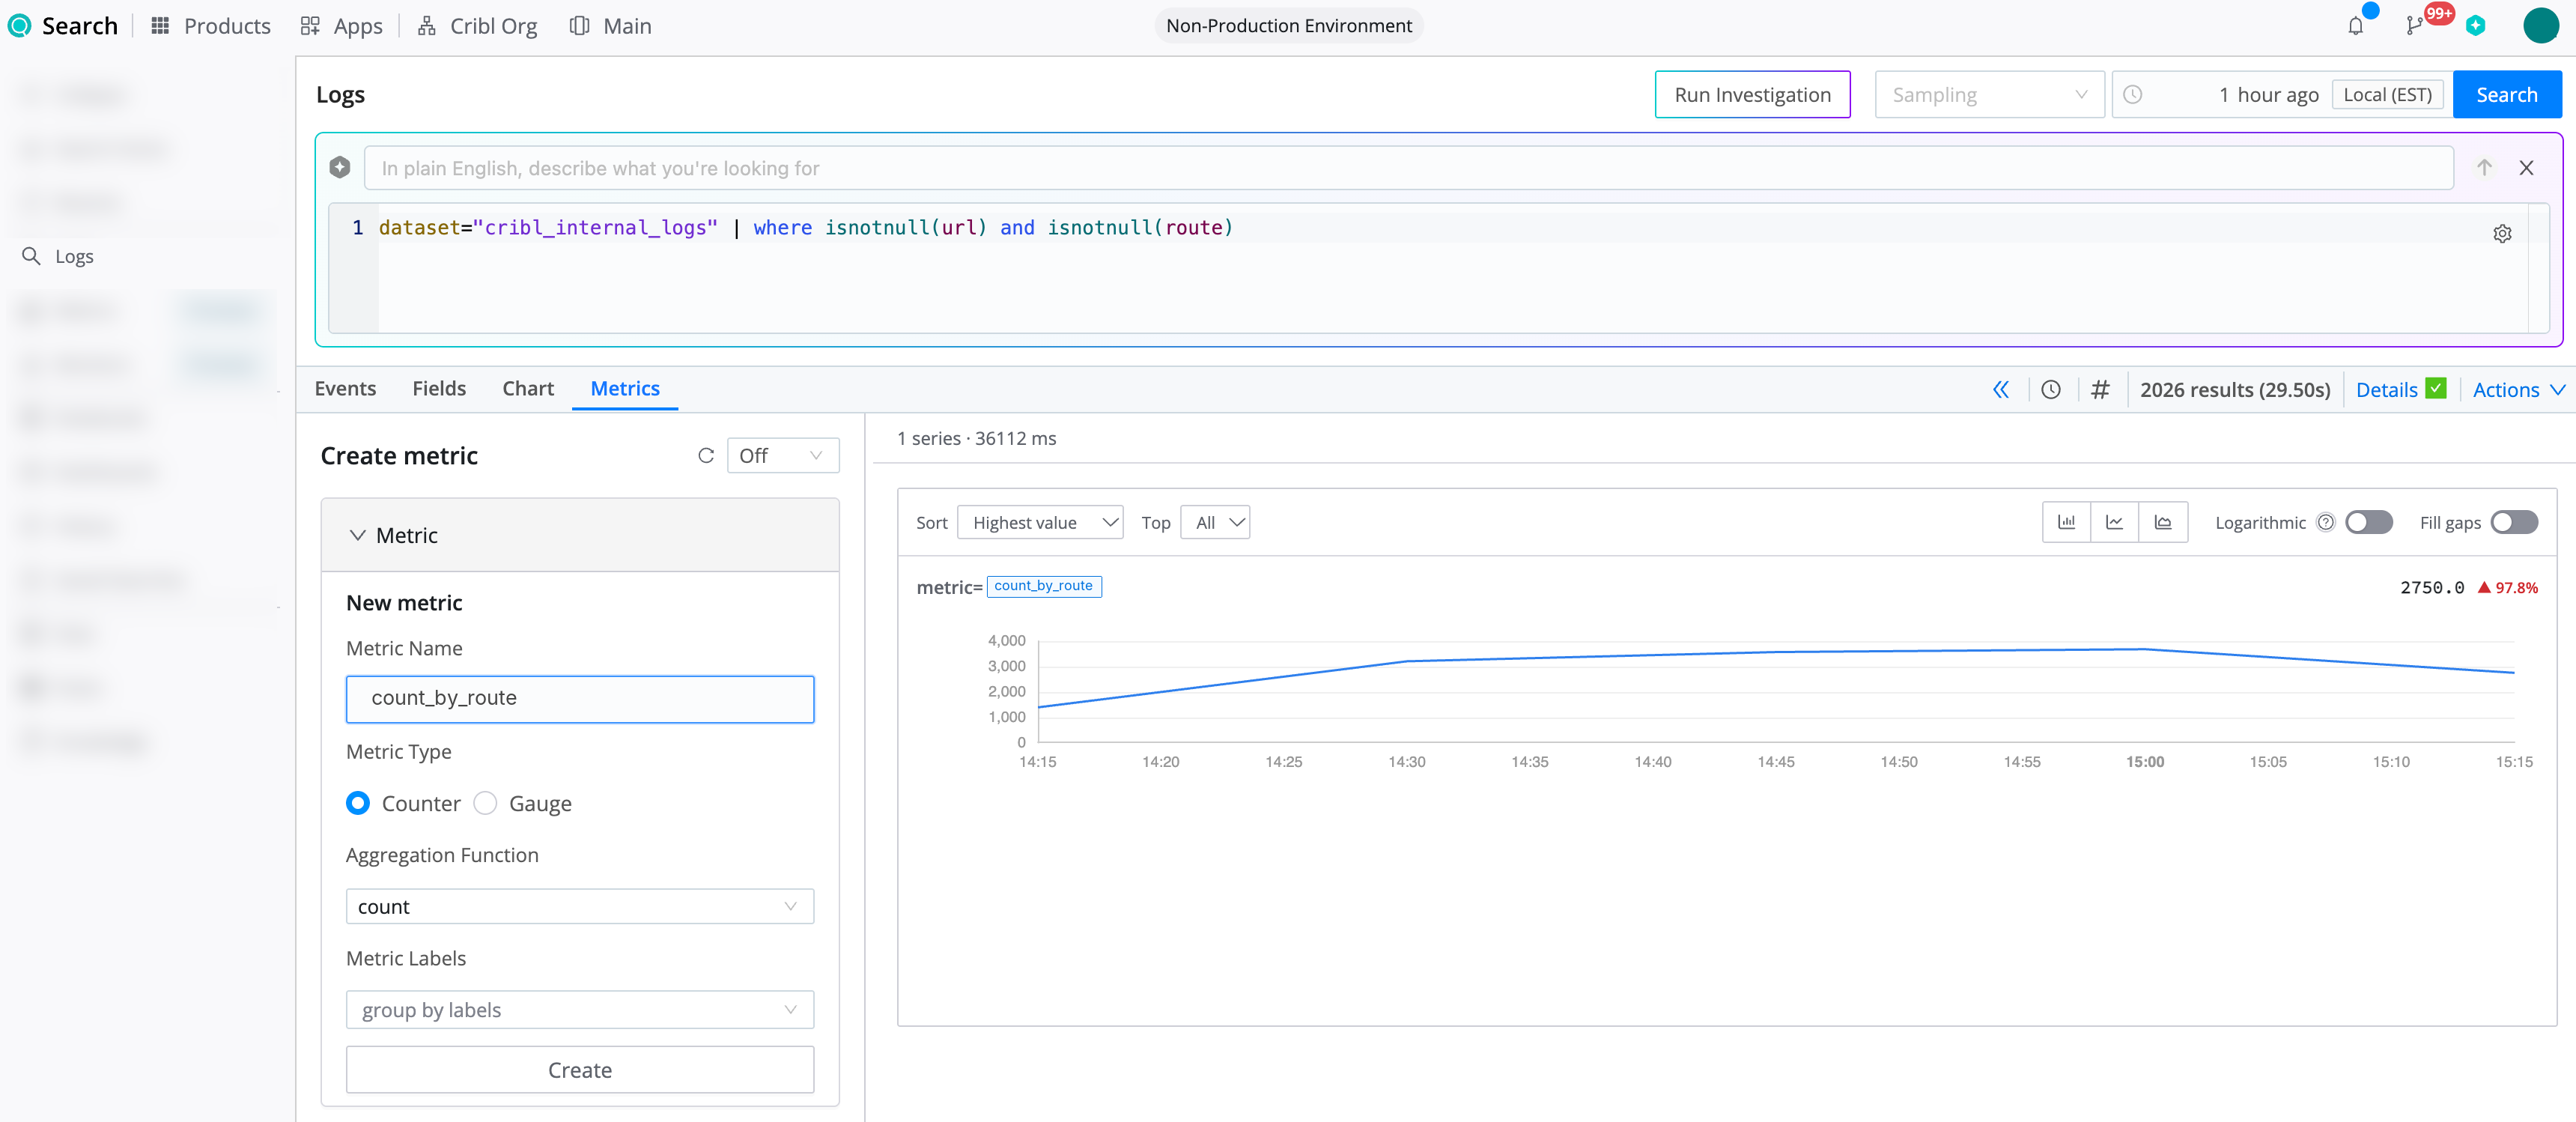
The Metrics tab appears only after you run a search. It also appears only if the feature is enabled for your deployment.
Your query becomes the base search for every metric you define, so write it to select the events to convert. In the Metrics tab, Cribl Search adds the aggregation and the export operator for you. Because of that, the query can’t contain an export operator, and it can’t end with a summarize or timestats operator. An aggregation earlier in the query is allowed.
Define a Metric
Under Metric, configure the following fields. Required fields turn red if you select Search before you complete them.
- Metric Name: The name can include letters, digits, underscores, and colons. It must start with a letter, an underscore, or a colon.
- Metric Type: Counter or Gauge. The default is Counter. Each point that Cribl Search writes holds the result for one run of the saved search over one Evaluation window. The point isn’t a running total, even when the type is Counter.
Counter is the default for
count, but it doesn’t change how the value is calculated. Arateor other function over time can return misleading results. The saved search runs at most once a minute, and a run with no matching logs leaves a gap. Choose Gauge if you don’t plan to applyrateor similar functions to the metric. - Aggregation Function: The function to apply to the matching events. The options are
count,dcount,avg,min,max,sum,stdev, andvariance. The default iscount. - Aggregation Field: The event field to aggregate. Every function except
countrequires this field. The field name can include letters, digits, and underscores. It must start with a letter or an underscore. Field names that contain dots aren’t supported. - Treat field as: How to turn the field into the number to aggregate. This field appears for
sum,avg,min,max,stdev, andvariance. The default is Value (numeric).- Value (numeric): Use the field value as it is.
- Parse number: Convert a string value to a number.
- Presence (1/0): Use
1when the field has a value, and0when it doesn’t.
- Metric Labels (optional): The fields to group by. Each unique combination of label values produces a separate series. You can’t use a field named
_time,name,value, ortypeas a label. You also can’t use a field whose name starts with two underscores (__).Cribl Search doesn’t limit the number of labels or series. Choose labels that have few distinct values. To review how many series a metric produces, see Explore the Metrics Catalog.
Null or empty label values still produce their own series. To leave those events out of the metric, filter them in the base search with
isnotempty. For example, this query keeps events that have both astatusand aroute:dataset="cribl_internal_logs" | where isnotempty(status) and isnotempty(route)
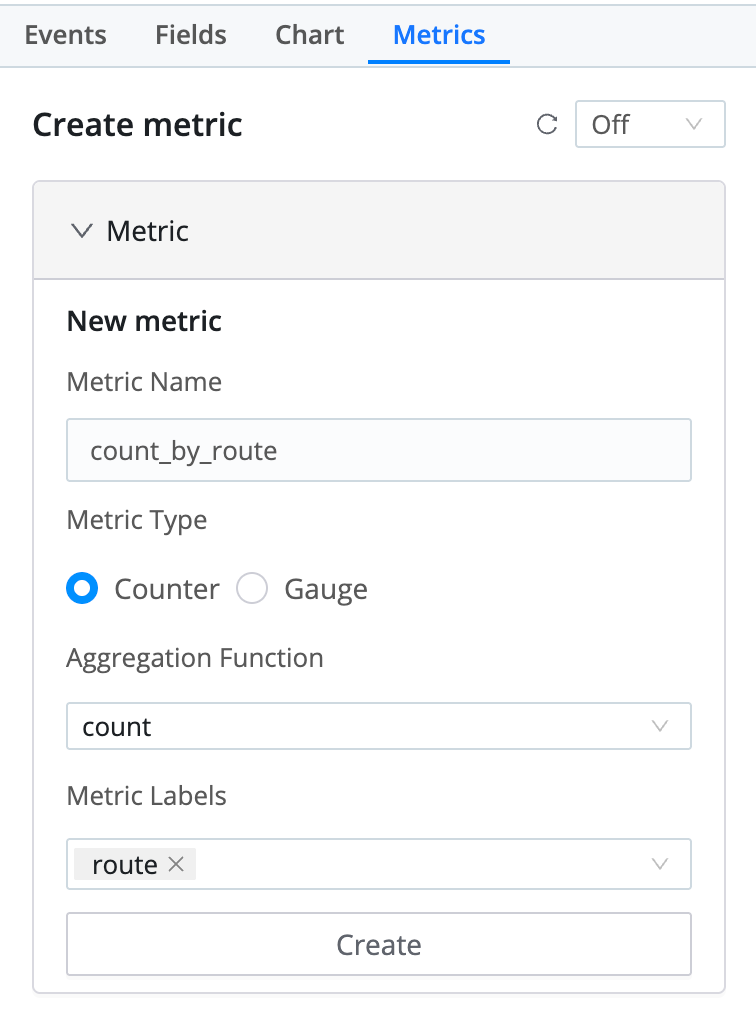
When the fields are complete, select Create. The metric appears in the panel with the name you entered. To change the metric, select Edit metric
 , edit the fields, and select Update metric.
You can define more metrics from the same base search. Select + Add metric, and configure the new metric’s fields. Each metric has its own labels.
If you select Search before you name the metric, Cribl Search uses
unnamedso the preview can run. Rename the metric before you create it.
Set the Schedule
Under Schedule, configure how often Cribl Search runs the metric and how much data each run covers:
- Evaluation window: The length of the time range that each run aggregates. The preview and backfill use that same length as the size of each time bucket. The default is 15 minutes. Choose minutes, hours, days, or weeks.
- Frequency: How often the saved search runs. The default is 15 minutes. Choose minutes, hours, or days. The maximum is 59 minutes, 23 hours, or 28 days.
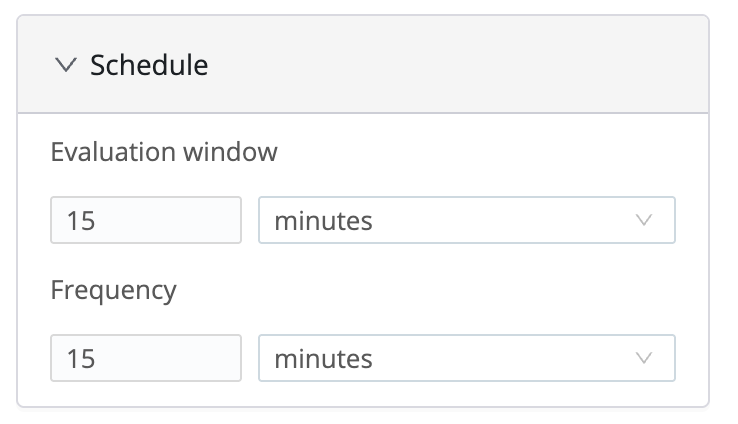
Set Frequency to a value that is at least as long as Evaluation window. A shorter Frequency makes consecutive runs overlap, and the overlap double counts events. Frequency doesn’t change when you change Evaluation window, so check both after you edit either one.
If Frequency is shorter than Evaluation window, Cribl Search disables Create Metric and shows a tooltip.
A Frequency that doesn’t divide evenly into an hour, a day, or a month produces uneven run times. For example, a Frequency of 45 minutes runs at minutes 0 and 45 of each hour, so the gap between runs alternates between 45 and 15 minutes. Cribl Search keeps Create Metric enabled and shows a warning. The values that divide evenly are:
| Unit | Even divisors |
|---|---|
| Minutes | 1, 2, 3, 4, 5, 6, 10, 12, 15, 20, 30 |
| Hours | 1, 2, 3, 4, 6, 8, 12 |
| Days | 1 |
Hourly and daily runs start at minute 0. Like any scheduled search, a run can start later than its scheduled time because of jitter.
Choose a Dataset and Backfill
Under Export, configure where the metric is written:
- Dataset: The
metricsDataset to write to. The list shows only the Datasets you can read, and Cribl Search selects the first one. If the list is empty, you don’t have access to anymetricsDataset. See Metrics Permissions. - Backfill (optional): Turn on Backfill to write historical points after you save the metric. Backfill is off by default. When you turn it on, the duration defaults to 7 days. Choose minutes, hours, days, weeks, or months.
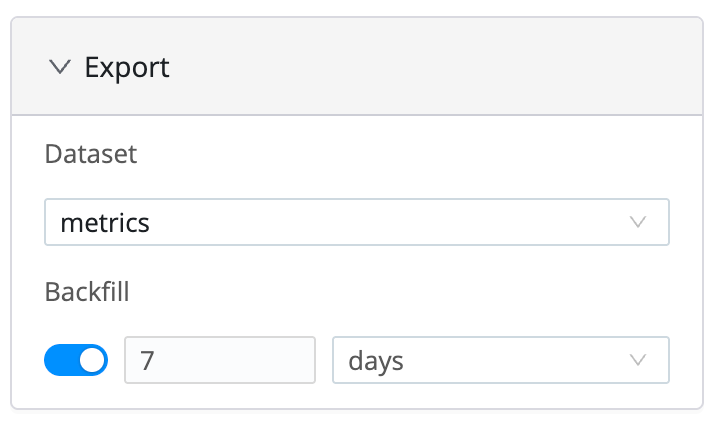
A backfill runs once, from the duration you set to the end of the last complete Evaluation window. It writes one point for each Evaluation window. Cribl Search starts the backfill only after you save the scheduled search. If you cancel the save, no backfill runs.
To confirm that a backfill worked, open the Metrics Explorer and look for the historical points in the Dataset you chose.
Preview the Metric
Select Search, or press Enter in the query box, to preview the metric. The Metrics tab shows one chart for each metric, split by label. The preview uses the time range of the page, with the Evaluation window as the bucket size. Cribl Search doesn’t write the preview to a Dataset.
Keep these behaviors in mind:
- Changing the time range doesn’t update the preview. Select Search again.
- A status line shows the number of series and the time the preview took. It also reports when the preview is truncated and lists any warnings.
- When the query matches more rows than the preview can replay from its cache, a Previewing from the raw search message appears. The preview runs the raw search again so the result stays exact.
- If the preview fails, a Preview failed message shows the error.
- When you run the search from the Metrics tab, the Events and Fields tabs update to match. Running it from the Events or Fields tabs doesn’t change the metric. Review the fields you want as labels, and then return to the Metrics tab to adjust the metric.
To refresh the preview automatically, set Rerun Search to an interval from 5 seconds to 10 minutes. The default is Off.
Create the Metric
When you select Create Metric, Cribl Search builds a scheduled search from your settings and opens it in the Save Search modal. The search isn’t saved, and no metric is written, until you select Save in the modal.
You can also select Actions > Create Metric in the toolbar. If a metric is ready to create, this opens the Save Search modal, so you can skip selecting Create Metric. Otherwise, it opens the Metrics tab. This menu item needs permission to create saved searches.
- Select Create Metric. This button stays disabled until the query, at least one metric, and a Dataset are complete.
- In the Save Search modal, review the prefilled name. The name combines your metric names with a short suffix. You can rename the search.
- Optionally, enter a Description that explains what the metric tracks.
- Optionally, change Results Access, which defaults to Private, so only you can view the result sets of the search. Select All Members to share the results.
- On the Query tab, review the composed query and the time range, which equals your Evaluation window.
- On the Schedule tab, review the schedule. Scheduling is on, and the cron schedule comes from your Frequency. You can also set the time zone and jitter.
- Select Save.
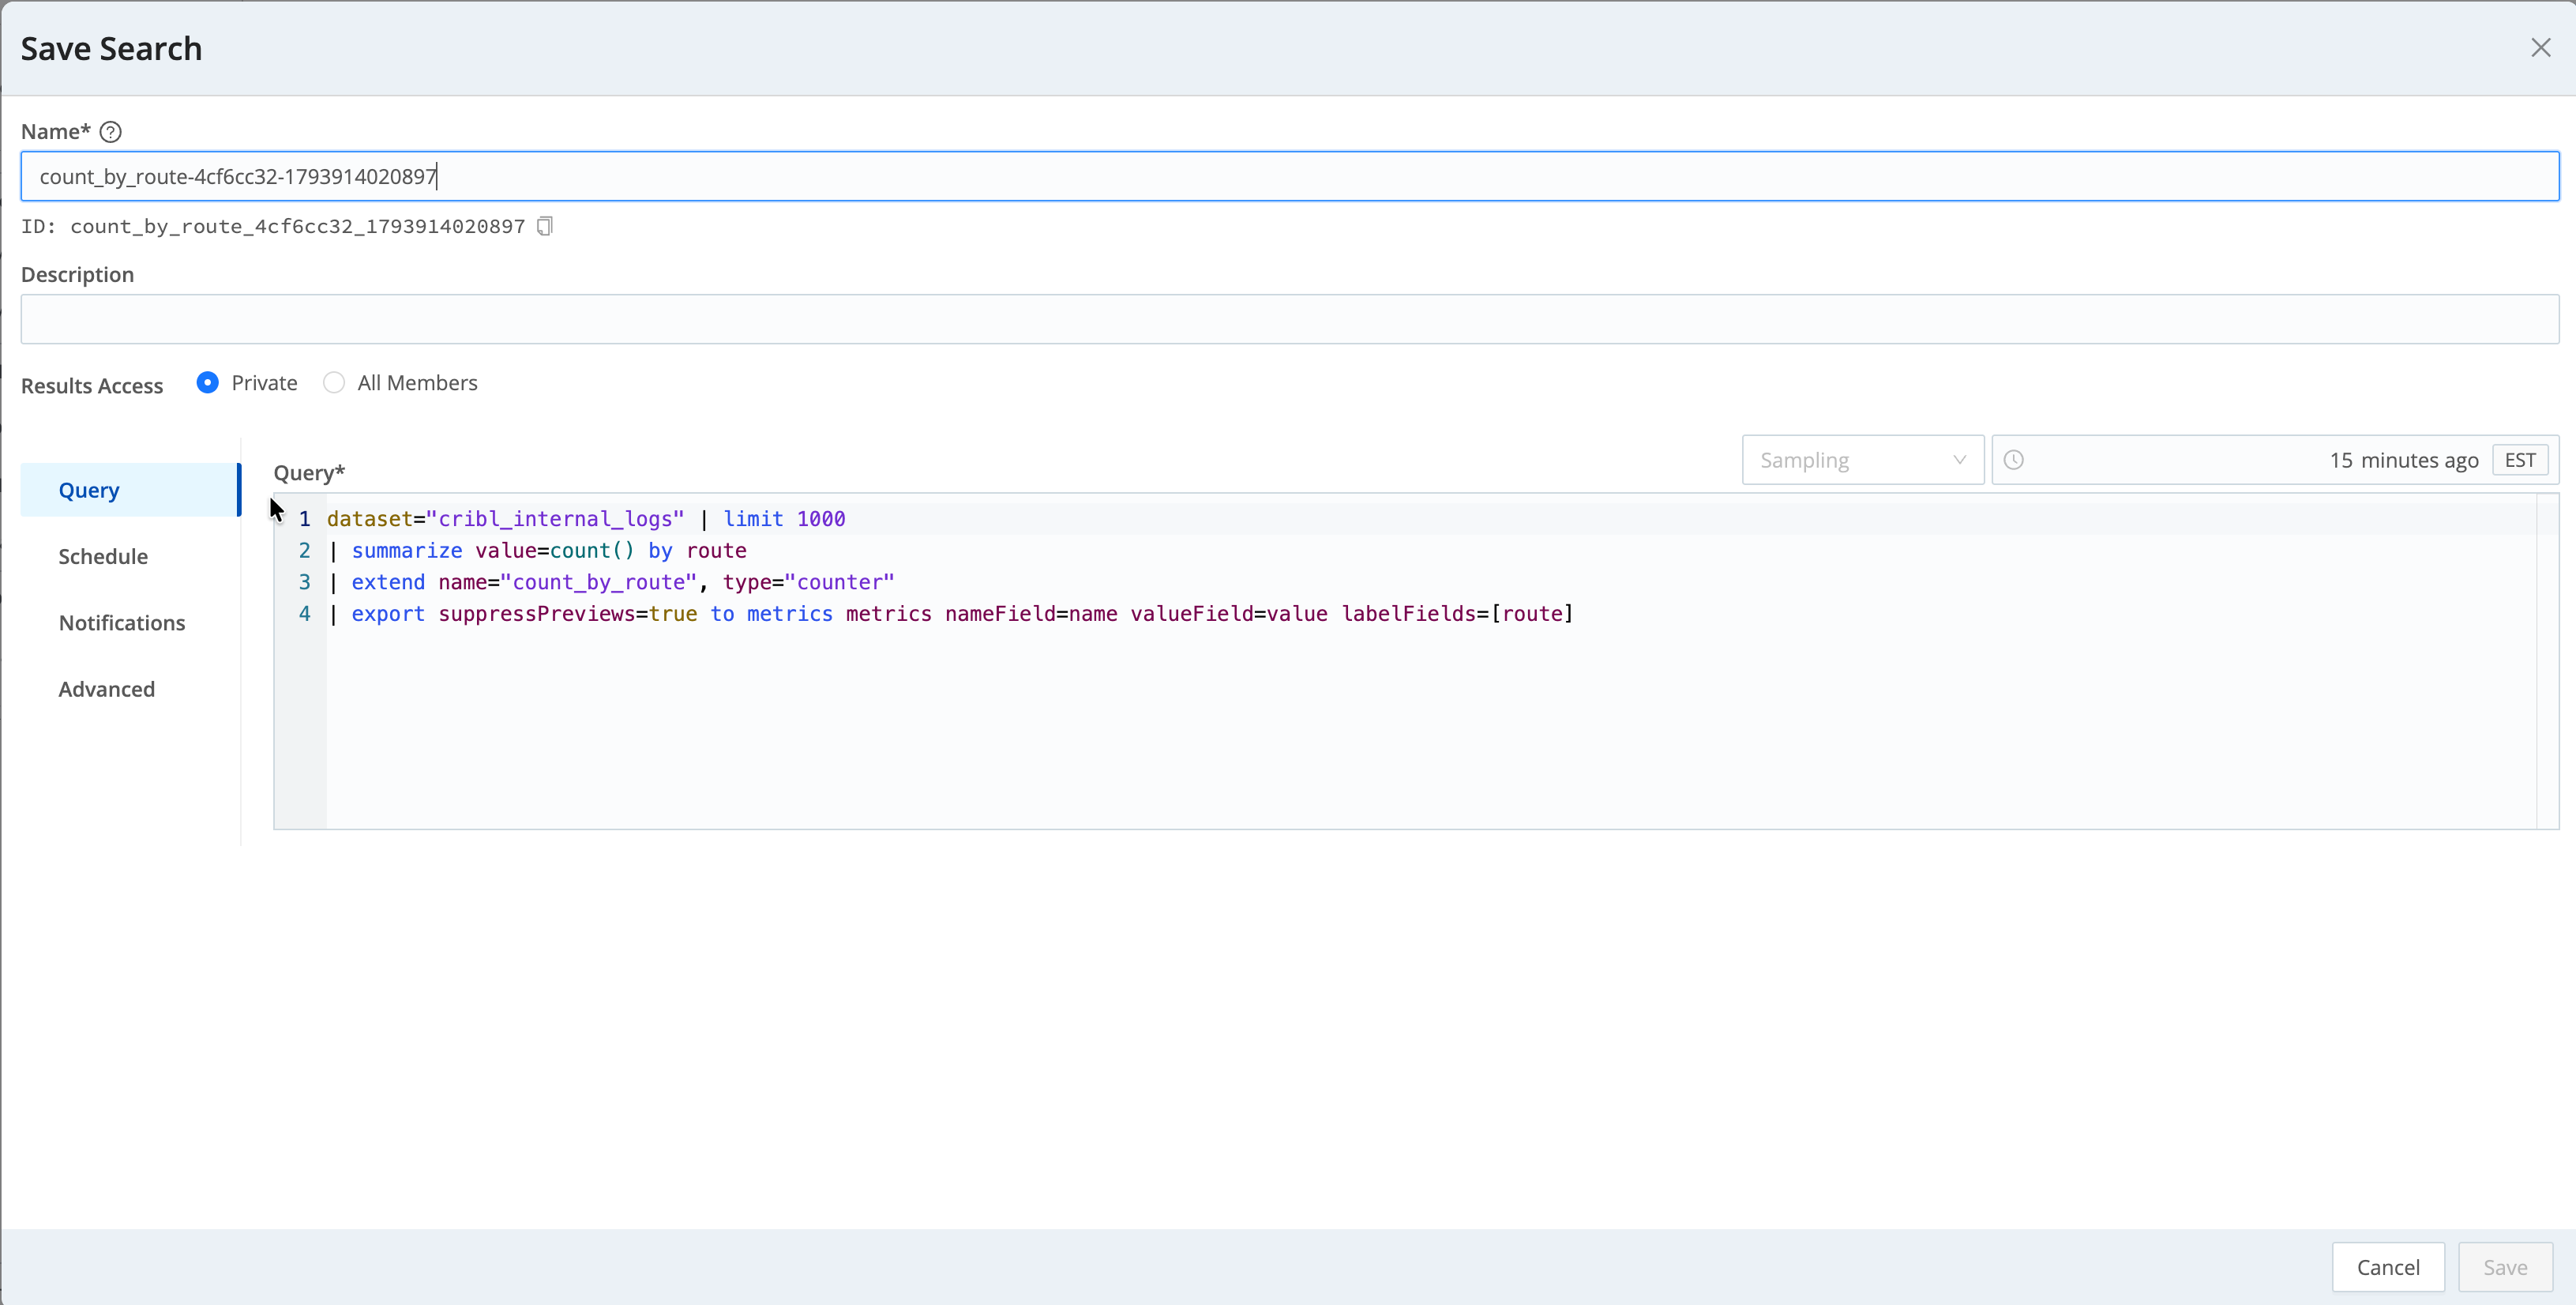
After you save, the search runs on your schedule. Each run ends in an export that writes the metric to your Dataset. If you set Backfill, Cribl Search starts it after the save succeeds.
Because the metric is a saved search, you can find it with your other saved searches. You can also find its runs in History.
After a successful save, the Metrics tab resets to its starting state. If metric names conflict, or if Cribl Search can’t create the metric, an error appears on the panel and you can try again.
You can edit the query in the Save Search modal. A backfill still uses the query Cribl Search composed in the Metrics tab, so the backfilled points can differ from the points the saved search writes. Avoid editing the query if you use Backfill.
Chart, Visualize, and Monitor the Metric
After the first scheduled run records a value, the metric appears in the Metrics Explorer for the Dataset you chose.
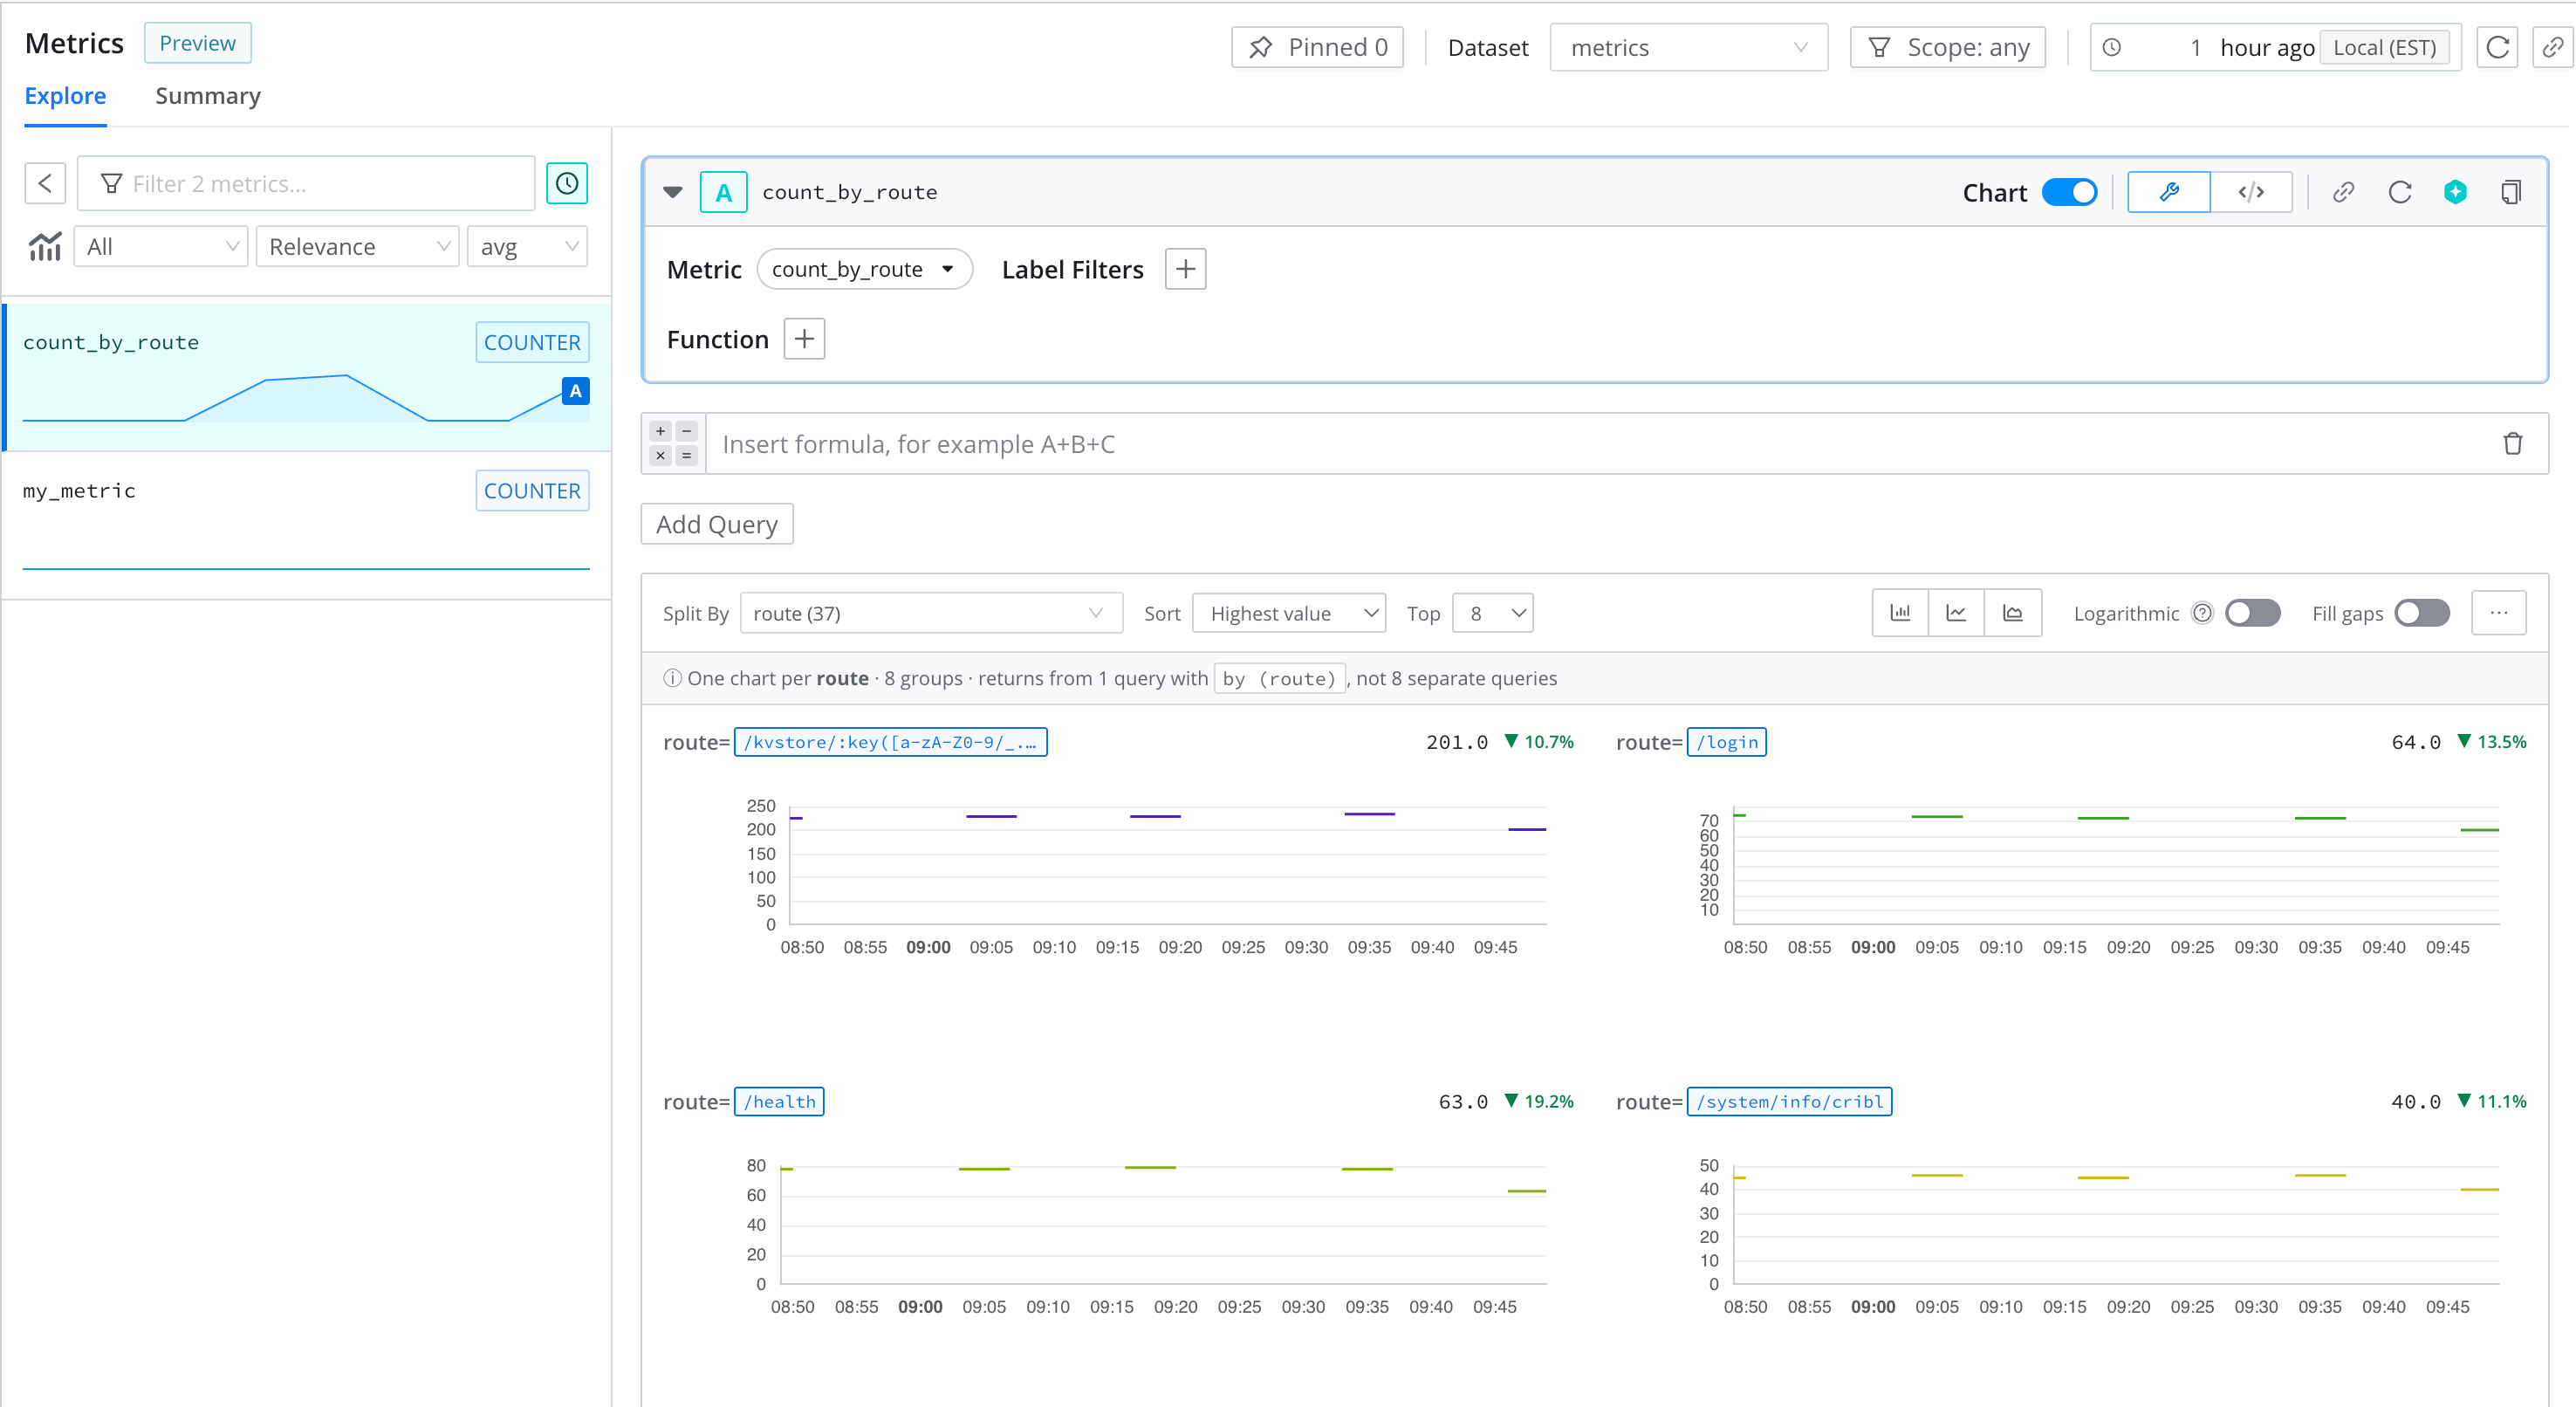
You can use the metric in the same places as any other metric:
- Chart and explore it in the Metrics Explorer.
- Visualize it in a Dashboard. See Add a Metrics Query to a Dashboard.
- Add it to a Notebook as a metrics cell. See Add a Metrics Cell.
- Start an Investigation from it.
- Alert on it with a Monitor. In most cases, choose the Threshold type. A Threshold Monitor fires when the metric crosses a value that you set, such as when the count of matching log events passes a limit.
If a run finds no matching logs, it records nothing for that run, not even a value of
0. The metric shows a gap, so a Monitor can’t evaluate a count of zero. A metric that has never matched any logs might not exist yet.
Next Steps
- Explore Metrics in Cribl Search to chart your new metric.
- Add a Metrics Query to a Dashboard to visualize it.
- Create Monitors in Cribl Search to alert on it.
- Logs to Metrics Pattern to build the same query by hand with the
exportoperator. - Scheduled Searches to learn how the schedule behaves.