




Explore Metrics in Cribl Search
Preview Feature
Cribl is still developing this Preview feature. We don’t recommend using it in a production environment, because the feature might not be fully tested or optimized for performance, and related documentation could be incomplete.
Please continue to submit feedback through normal Cribl support channels, but assistance might be limited while the feature remains in Preview.
Explore, filter, and visualize your metrics in Cribl Search, alongside your logs.
About Metrics
Cribl Search ingests metrics into a lakehouse engine - the same storage that accelerates your logs - and their simple, consistent shape lets Cribl Search query and visualize them quickly, even across very large volumes.
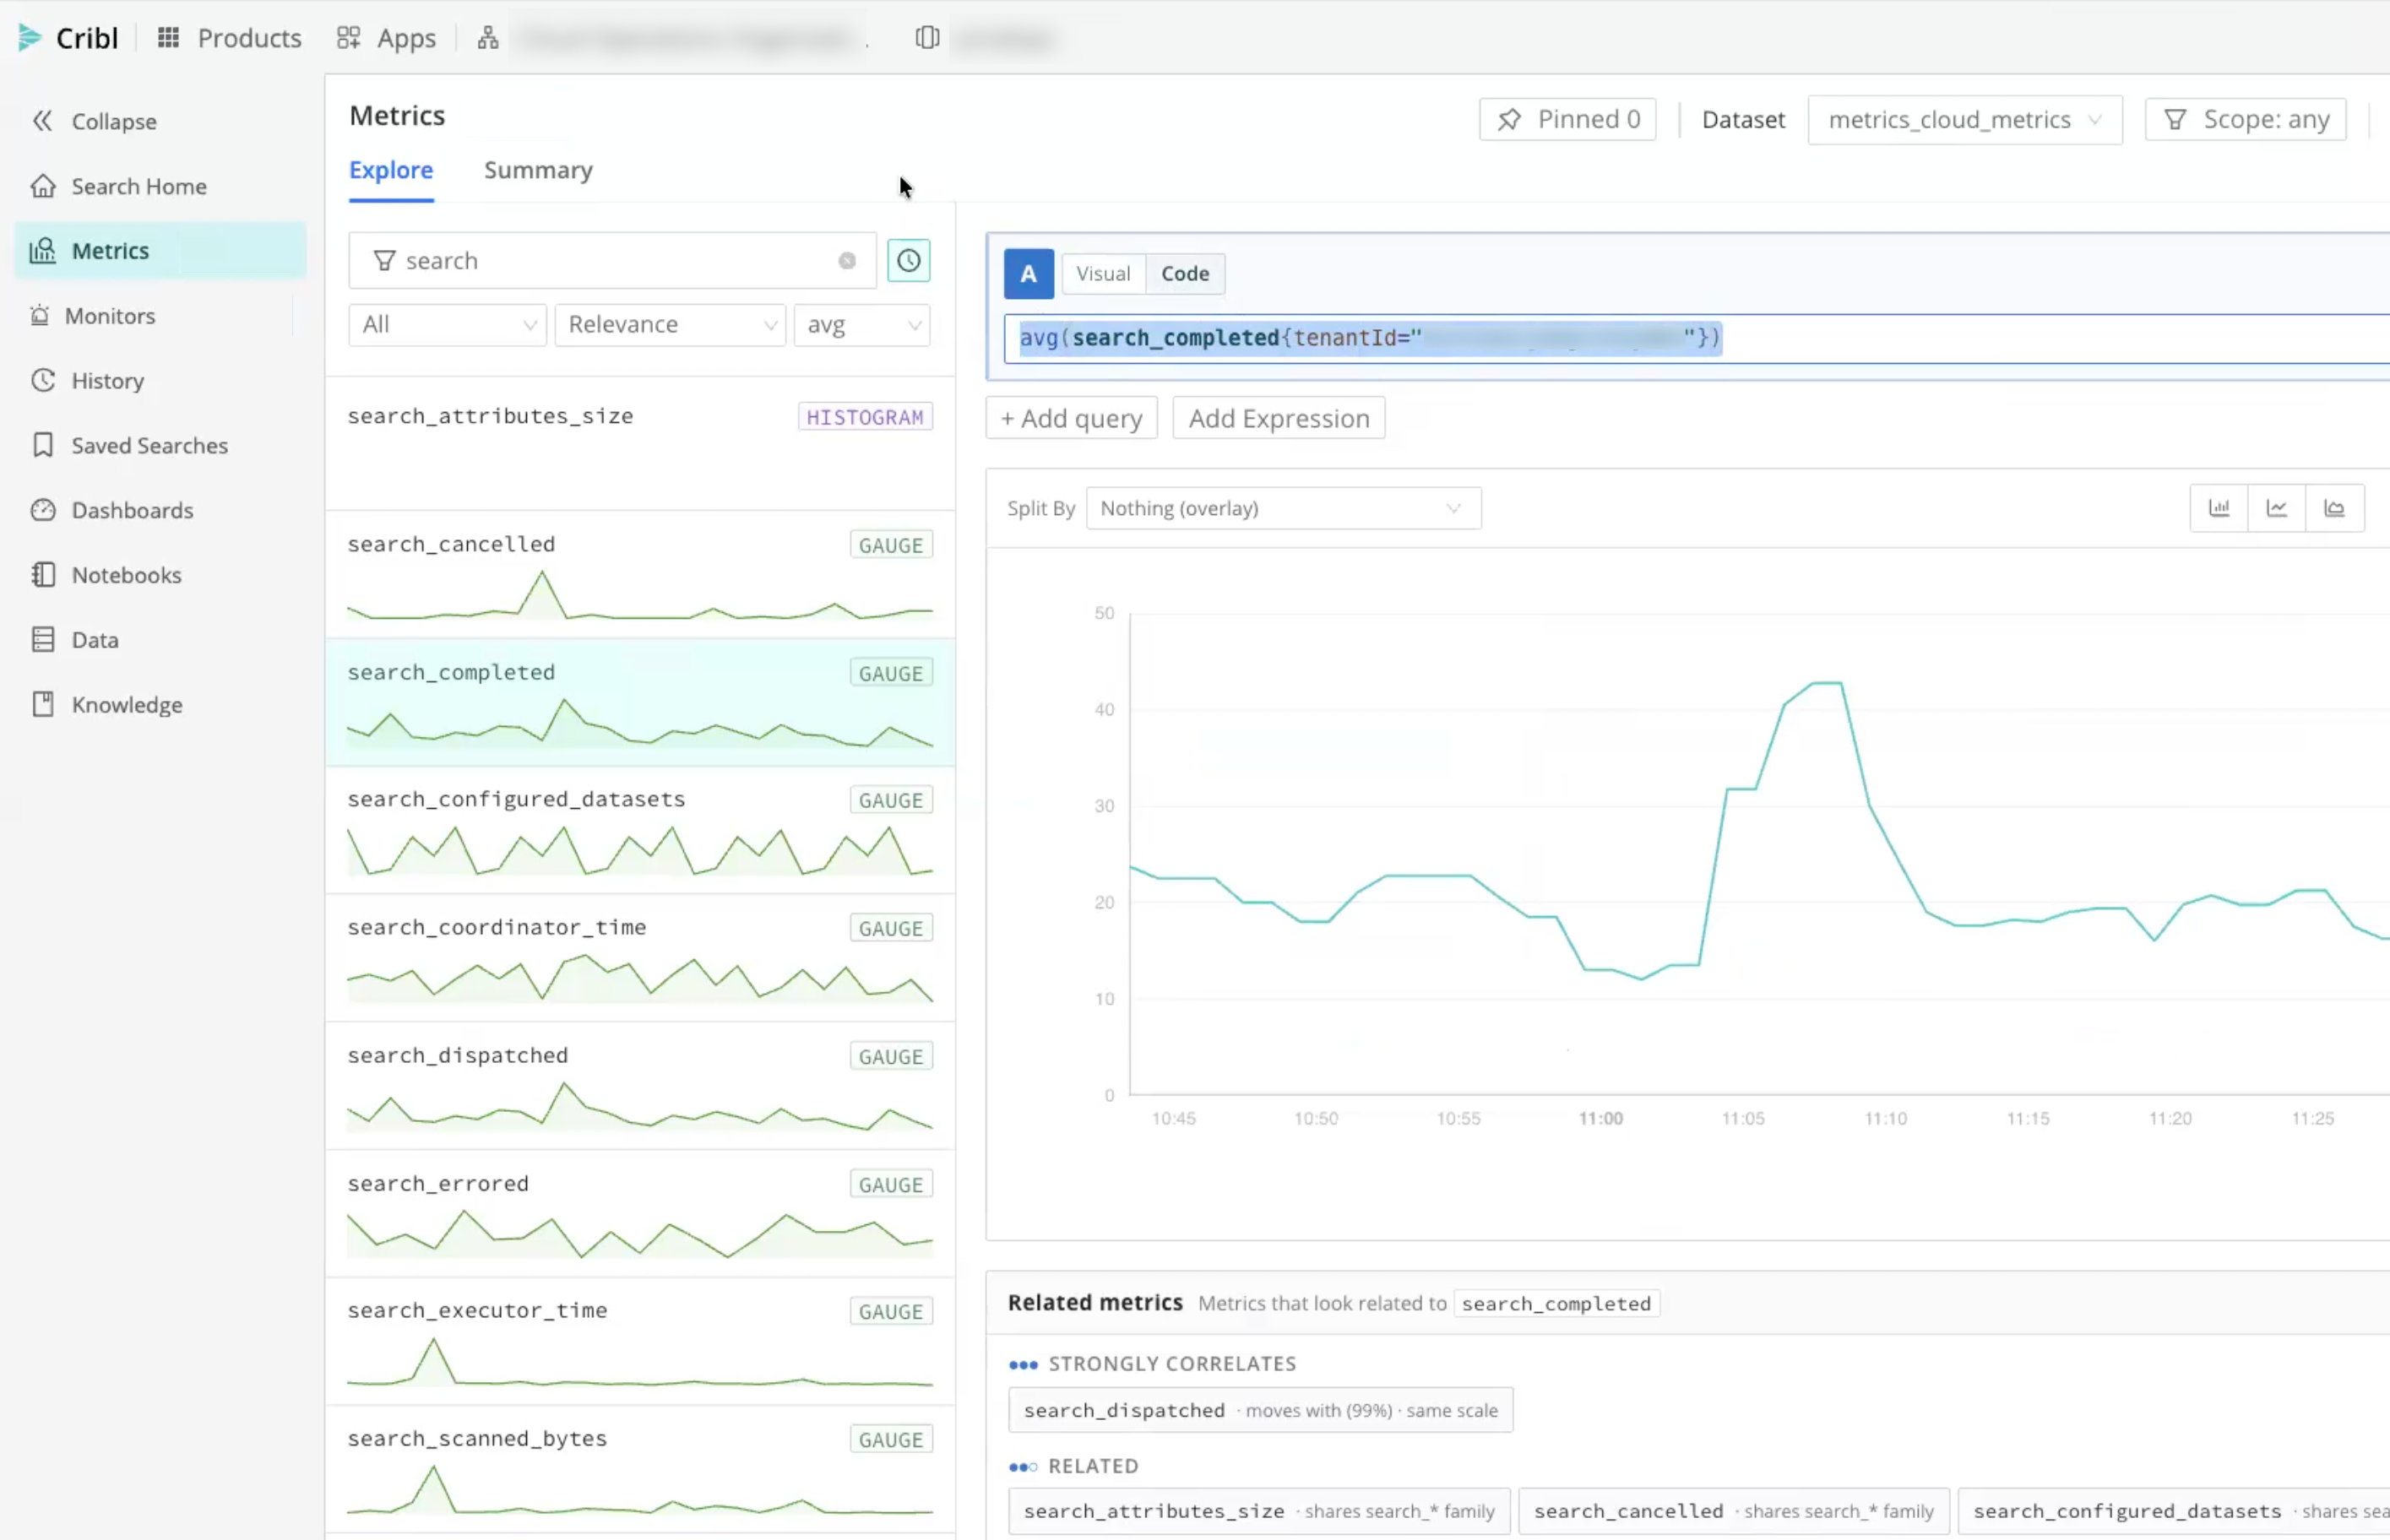
Because metrics live alongside your logs, they make a fast starting point for investigation: chart a metric to spot an anomaly, such as a latency spike or a drop in throughput, then pivot into your logs, an Investigation, or a Notebook to find the cause.
The Metrics experience is made up of four parts:
- Metrics ingest: Sending metrics into Cribl Search, through the Prometheus Remote Write, OpenTelemetry, or Cribl HTTP Source. See Ingest Metrics into Cribl Search.
- Metrics storage: Where your metrics land. Cribl Search auto-provisions a
metricsDataset for each lakehouse engine, and Metric Dataset rules decide which one receives the metrics from a given Source. - Metrics Explorer: The visual explorer described on this page, where you query and visualize individual metrics.
- Monitors: Alerting on metric conditions such as thresholds, changes, and anomalies.
You can also add metrics to Dashboards and Notebooks.
Metric Types
Cribl Search recognizes the standard Prometheus metric types, and shows each metric’s type in the Metrics Explorer:
- Counter: A cumulative value that only increases and resets to zero on restart, such as total requests served.
Query counters with the
ratetransformation to see the per-second rate of change. - Gauge: A value that can go up or down, such as memory usage or queue depth. Read a gauge directly, without
rate. - Histogram: Samples observations into buckets, along with a running sum and count. Use histograms to analyze
distributions, such as request latency, with the PromQL functions
histogram_quantile,histogram_fraction,histogram_count, andhistogram_sumin Code mode.
If you send metrics through the OpenTelemetry Source, Cribl Search maps each OTLP metric type to one of these types, and translates OTLP metric and label names into Prometheus-compatible names. A metric can therefore appear in the Metrics Explorer under a different name than the one your collector sends. For details, see Supported OTLP Metrics.
Metrics Permissions
Access to metrics has two parts:
- Your Cribl Search Permission decides whether Metrics and Monitors appear at all. Members with the User, Editor, or Admin Permission can open both. Members with the No Access Permission on Cribl Search don’t see either one.
- Your Dataset Permission on an individual
metricsDataset decides whether you can query it. Read Only is enough to query the Dataset and browse its metric catalog.
Reading metrics and changing them need different levels of Cribl Search Permission. Any Member who has a metrics Dataset
shared with them can query it, browse its metric catalog, and view its alert activity. Editing metric metadata and
creating, editing, and deleting Monitors also need the Editor or Admin Permission on Cribl
Search, on top of access to every metrics Dataset involved.
Cribl Search auto-provisions a metrics Dataset for each lakehouse engine, so
no Member owns one. Members with the Admin Permission on Cribl Search can access all of them. Members with the
User or Editor Permission on Cribl Search only have access to the metrics Datasets that a Member with the
Maintainer Permission shares with them.
If no
metricsDataset has been shared with you, Cribl Search can prompt you to create one, even though the lakehouse engine already created the Dataset that you can’t yet access. See Cribl Search Asks You to Create a Metrics Dataset.
Ingest Metrics into Cribl Search
Before you can explore metrics, you need to get metrics into Cribl Search. Metrics are stored on a lakehouse engine, the same compute and storage that accelerates your logs.
- Add a lakehouse engine to store and accelerate your metrics. See Lakehouse Engines in Cribl Search.
You can change the default 365-day Retention period on the
metricsDataset in the Dataset configuration. - Add one of the Sources that support metrics, then point your upstream sender at it.
- Prometheus Remote Write: Receives Prometheus metrics from a Prometheus client, or from the Prometheus Destination in Cribl Stream or Cribl Edge. See Ingest Prometheus Metrics into Cribl Search.
- OpenTelemetry: Receives OTLP metrics, logs, and spans. Set Store this source data as to Metrics or Both Logs and Metrics to store the metrics it receives. See Ingest OpenTelemetry Data into Cribl Search.
- Cribl HTTP: Receives native metric events from the Cribl Search Destination in Cribl Stream or Cribl Edge. Set Store this source data as to Metrics or Both Logs and Metrics on the Source, and Send as to Metrics or Logs and Metrics on the Destination. Produce the metric events upstream with a Pipeline - for example, with the Publish Metrics Function. See Ingest Cribl Stream/Edge Data into Cribl Search.
- Route the metrics to the
metricsDataset you want them stored in. By default, a catch-all rule sends all metrics to the primarymetricsDataset. To target a different engine’s Dataset, add a rule that matches the Source. See Add Metric Dataset Rules.
Metrics is a Preview feature. Adding metrics to a production lakehouse engine can affect its performance. Until the impact is better understood, use one of these approaches:
- On a production engine, keep the metrics volume small.
- Give metrics a dedicated engine, so their load doesn’t compete with production search. You can route a metrics Source to a dedicated engine with Metric Dataset rules.
After your metrics are flowing, open the Metrics Explorer to explore them.
Open the Metrics Explorer
On the Cribl.Cloud top bar, select Products > Search > Metrics.
The Metrics view has two tabs:
- Explore: Build and visualize metric queries. This is the tab described on this page.
- Summary: A catalog and health view of every metric. See Explore the Metrics Catalog.
Build a Metrics Query
The Metrics Explorer lets you build a query visually, without writing a query language. After you choose a metric and a time range, Cribl Search returns a visualization of that data.
Select a
metricsDataset to query. Each lakehouse engine has its ownmetricsDataset, so choose the one that holds the metrics you want. Your Metric Dataset rules determine which Dataset that is. The list shows only the metrics Datasets you can access. See Metrics Permissions.Select a metric from the catalog of metric names that Cribl Search maintains for all ingested data. You can pick any metric name with no perceptible latency. To find a metric in the catalog:
- Use the Filter metrics box to narrow the list by name.
- Use the type filter to show only All, Counter, Gauge, or Histogram metrics.
- Sort the list by Relevance, Value, Change, A → Z, or Z → A.
By default, the browser shows only metrics that currently have data.
Filter the metric’s time series by one or more dimensions that apply to that metric. Dimensions are the key-value attributes attached to a metric, and are often called labels in other tools.
Choose a transformation to apply to the metric value before it is returned. Common transformations include:
countsumavgminmaxstddevrate
This is a sample, not the full set - open the transformation dropdown to see every transformation available.
Adjust the time range with the timepicker, and optionally set the display timezone.
Split by Dimensions
To break a metric down into separate series, split it by one or more dimensions. Splitting by a dimension returns one series per value of that dimension, so you can compare those values.
Combine Metrics
Add more queries - labeled A, B, and so on - and combine them with an expression (a formula). For example, take the difference between two metrics, multiply one metric by another, or apply mathematical functions and constants.
Refine the Explorer View
The Explorer header has controls that apply to the whole page, not just a single query:
- Scope: Apply one or more dimension filters across every query on the page at once, instead of setting the same filter on each query. The button summarizes the active filters.
- Pinned views: Save the current Explorer setup and return to it later. The button shows how many views you have pinned.
- Refresh: Re-run all queries to pull the latest data.
View Results as a Chart or Table
Cribl Search returns your results either as a chart or as a table of numerical values. Switch between the two to suit your analysis.
When viewing a chart, choose the chart type - Column, Line, or Area - and adjust how the chart renders:
- Logarithmic: Plot the y-axis on a logarithmic scale, which helps when values span several orders of magnitude.
- Fill gaps: Connect the series across missing data points instead of showing breaks.
Edit the Query Expression
Select Code to switch from the visual builder to a query editor that shows the exact PromQL the builder generates. The visual builder and the Code editor stay in sync, so you can build a query visually and then read or refine the generated PromQL, or paste in raw PromQL from an external source.
Explore the Metrics Catalog
The Summary tab is a catalog and health view of every metric in the selected Dataset. Use it to see what metrics you have and to understand their cardinality - the number of unique time series a metric generates, which drives its storage footprint and query speed.
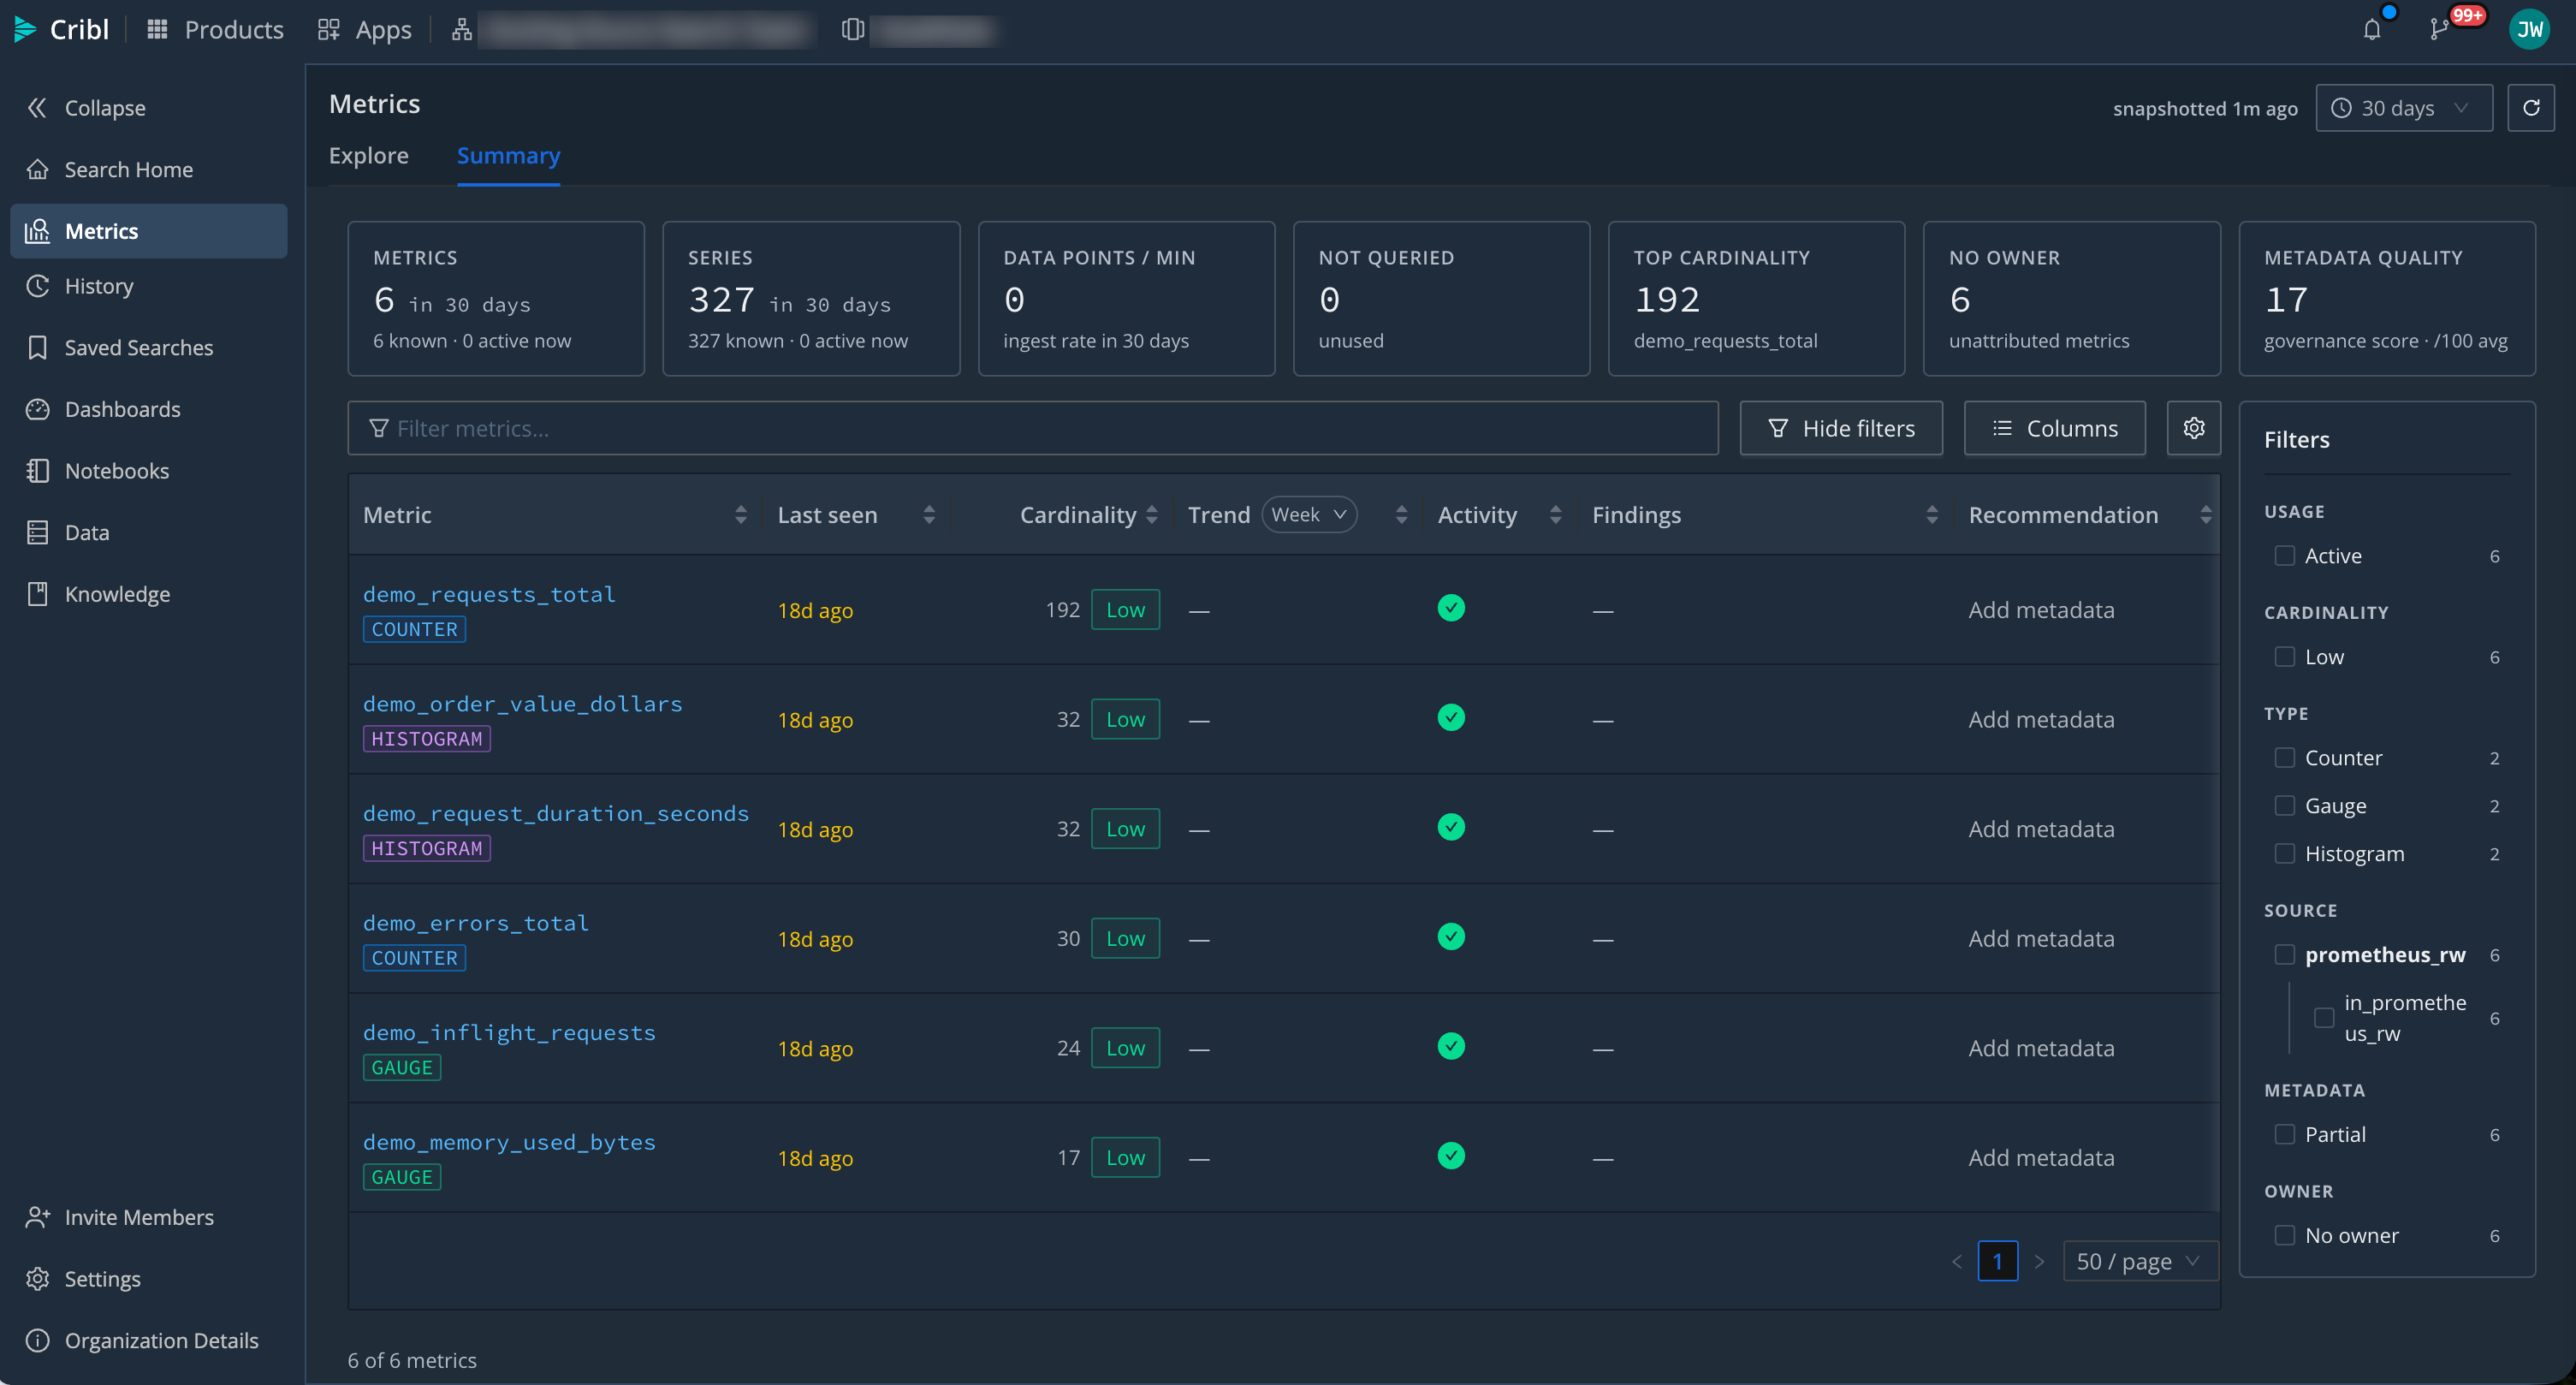
Select a metric, then its Cardinality anatomy tab, to see the series count broken down by label. Cribl Search classifies each label - for example, ID-like, High-cardinality, or Constant - and suggests whether to drop, aggregate, or keep it. Expand a label to see its top values.
A suggestion is a hint, not a rule. Keep a high-cardinality label when the per-value detail is worth it, or drop or aggregate it when you only chart the metric at a coarser grain.
The catalog supports two kinds of edit, and both need the Editor or Admin Permission on Cribl Search. Editing
a metric’s own metadata, such as its unit or description, also needs access to the metrics Dataset that the metric
belongs to. Changing the cardinality band thresholds that classify every metric applies across your Organization, so
it needs no Dataset Permission. See Metrics Permissions.
Share a Metrics Investigation
The Metrics Explorer URL captures your current query, selected metrics, filters, split-by dimensions, visualization settings, and time range. Copy the URL to bookmark, share, or reopen the same investigation without recreating the context by hand.
Take Action on a Query
On the Explore tab, the ⋯ (take action) menu turns your current query into another Cribl Search object or exports it:
- Add to Dashboard: Add the query to a new or existing Dashboard as a metrics panel. See Add Metrics to Dashboards.
- Add to Search notebook: Add the query to a Notebook as a metrics cell. See Add a Metrics Cell.
- Start an Investigation from the query. See Investigations.
- Create a Monitor to alert on the query. See Monitors.
- Copy a shareable URL, or export the results to CSV.
Add to Dashboard and Add to Search notebook also need the Maintainer Permission on the target Dashboard or Notebook. Your access to metrics doesn’t extend to the Dashboard or Notebook you add the query to. See Cribl Search Dashboards and Cribl Search Notebooks.
Query Metrics from Grafana
Each metrics Dataset exposes a Prometheus-compatible query endpoint. In Grafana, add this endpoint as a standard
Prometheus data source to query your metrics. This is separate from the Cribl Search plugin for Grafana,
which runs Cribl Search queries in Grafana - the metrics endpoint instead connects to Grafana as a native Prometheus
data source. To import Grafana Dashboards into Cribl Search, see
Migrate Grafana Dashboards.
To connect Grafana to a metrics Dataset:
- In the
metricsDataset configuration, copy the Prometheus compatible endpoint URL. On the Query API Access tab, set the Auth type to None or Basic. For Basic, note the Username and Password. - In Grafana, select Connections > Data sources > Add data source > Prometheus.
- In Prometheus server URL, paste the Prometheus compatible endpoint.
- Match the Dataset’s authentication: if the Dataset uses Basic, under Authentication select Basic authentication and enter the Username and Password from the Query API Access tab. If the Dataset’s Auth type is None, leave authentication off.
- Select Save & test.
- Query your metrics with standard PromQL against the Dataset’s metric names, for example
rate(http_requests_total[5m]).
Member Permissions don’t govern the Prometheus compatible endpoint. Access to it comes from the Dataset’s Query API Access configuration, so removing a Member’s Permission on the
metricsDataset doesn’t close the endpoint for them. To restrict the endpoint, change its Auth type or rotate the Basic credentials.
Next Steps
- Ingest Prometheus Metrics into Cribl Search.
- Ingest OpenTelemetry Data into Cribl Search.
- Ingest Cribl Stream/Edge Data into Cribl Search.
- Add Metrics to Dashboards for a unified view of logs and metrics.
- Migrate Grafana Dashboards into Cribl Search.
- Create Monitors to get alerted when a metric crosses a threshold or behaves anomalously.