


Results Tables
Learn how to format tables that display search results.
Below every Chart is a results table that displays the Chart’s data in numbers and/or text.
You can modify the table display, as well as some Chart visualization settings, in several ways. You’ll find most of the available settings in each column’s Settings drop-down:
On the Chart tab, scroll down to the table below the Chart.
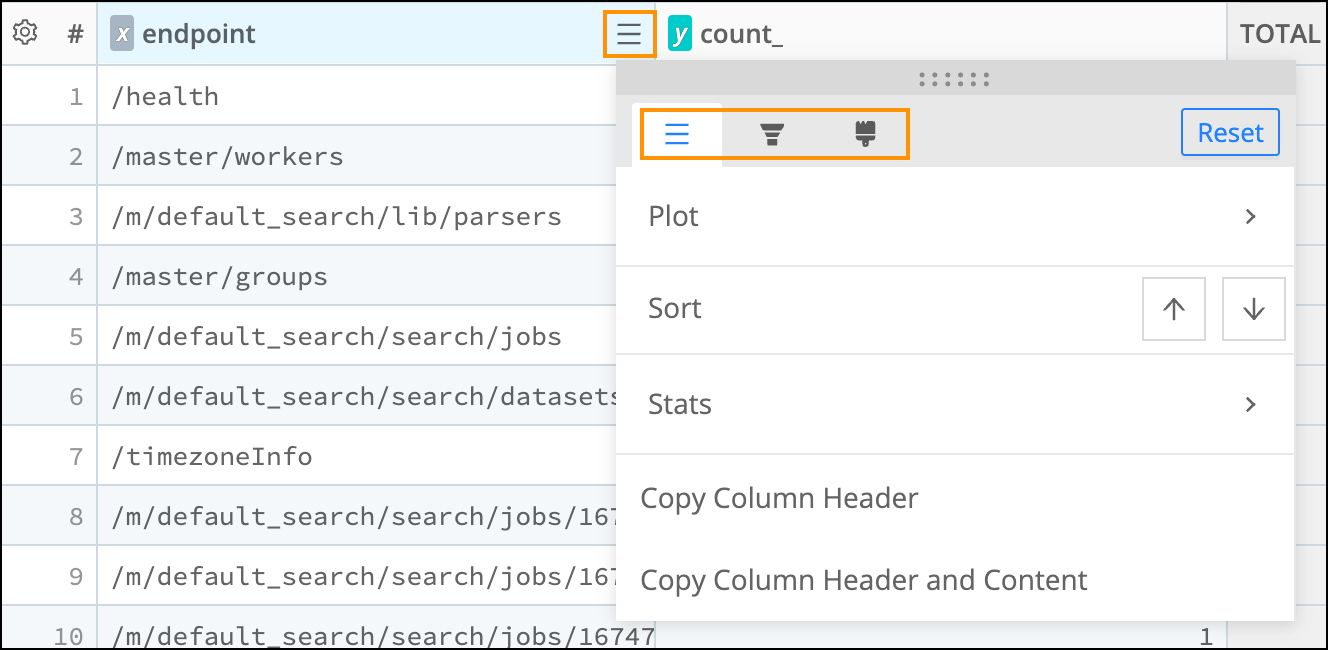
Hover over the column header that contains the data you want to work with.
Select the Settings button
 to open the drop-down.
Select one of the three tabs on the drop-down:
- General
- for plot settings, column sorting, stats info, and copying
- Filter
 - for filtering results based on search terms
 - Format
 - for applying prefixes, suffixes, decimal places, and column colors
You can use the grab handle at the top of the Settings drop-down to tear it off as a modal, and move it anywhere on the page. This way, it won’t block the column you’re modifying, and you can see your changes as you make them.
Changes made in the Settings drop-down apply only to the column selected when you opened the drop-down.
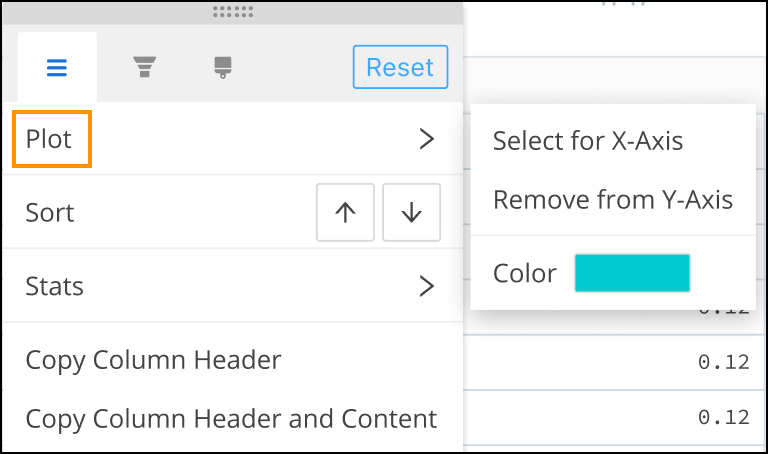
Adjust Plot Settings and Axis Colors
Adjust plot settings to change the display of column results in the associated Chart. You can choose which columns to display on the x-axis and y-axis, and you can change the color of column data in the Chart display.
You can open the plot menu in two ways:
- Select the plot icon
 in a column header.
 - On the General tab
, select Plot.
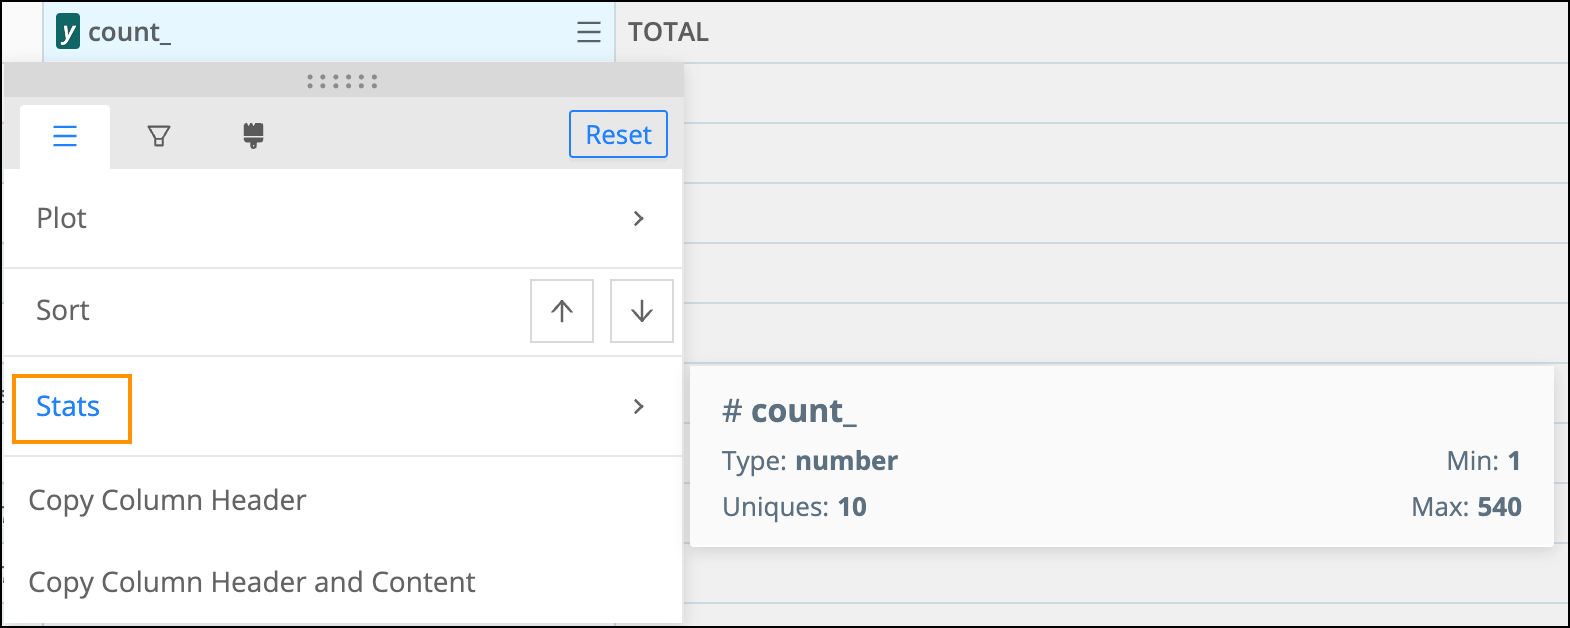
View Stats
On the General tab
![]() , select Stats to see information about the fields returned from your search, including the data type and the count of unique field values.
, select Stats to see information about the fields returned from your search, including the data type and the count of unique field values.
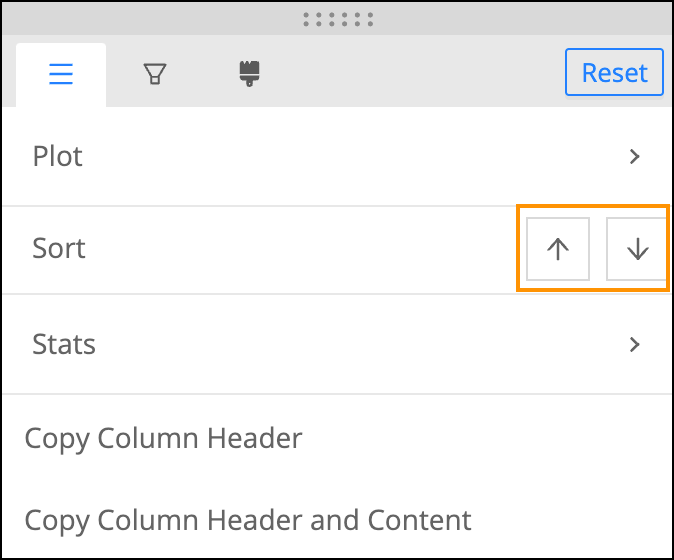
Sort Data
You can sort column results in ascending or descending order in two ways:
- Select the arrow buttons
 that appear when you hover over a column header.
 - On the General tab
, select the arrow buttons next to Sort.
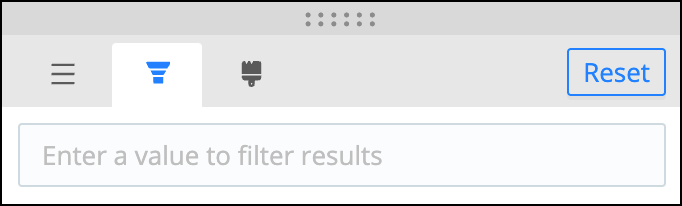
Filter Data
On the Filter tab
![]() , you can filter the results in a column by searching for a
particular value.
, you can filter the results in a column by searching for a
particular value.
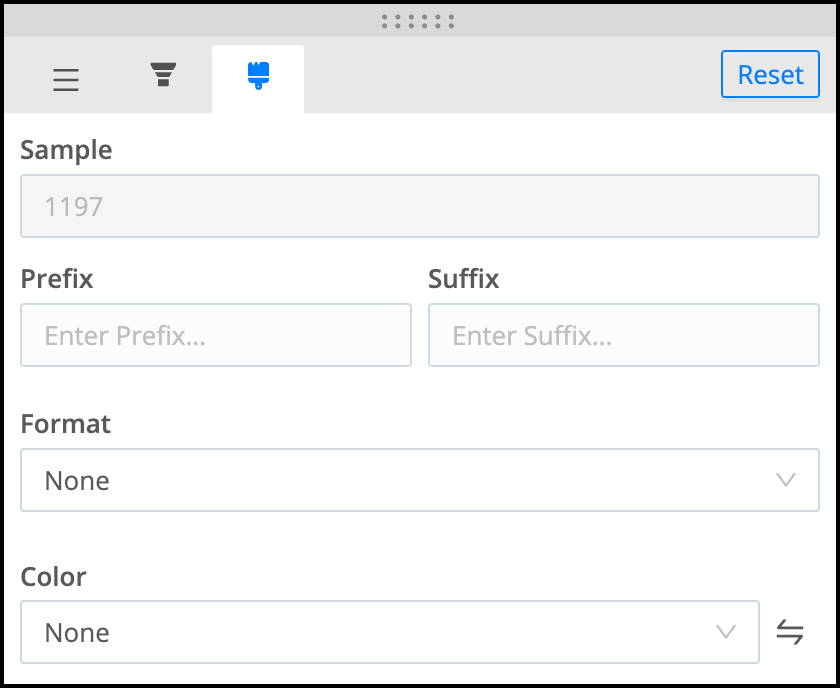
Apply Column Formatting
The Format tab
![]() provides the following options:
provides the following options:
- Enter a Prefix or Suffix to be applied to every result in a column.
- Format can be a Number, Currency, or Percentage. You can specify the number of decimal places to show
in a column. To display or hide the thousands separator, select or clear the Use 1000 Separator (,) check box.
- Currency provides a drop-down with supported currencies.
- Color allows you to apply a value-based color palette to a column.
When any field on this tab is modified, the Settings icon in the column header displays a blue dot
 to indicate that formatting is applied.
Show Line Numbers, Column Totals, and Row Totals
Select the gear button to the left of the results table to show or hide the display of line numbers, row totals, or column totals.
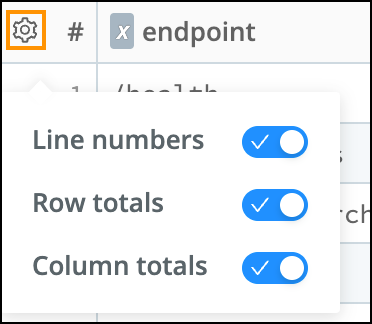
By default, row and column totals are pinned in place, for visibility. Select the pin button
![]() to unpin them.
to unpin them.