


Diagnose Search and Monitor Usage
Diagnose search issues and monitor usage in your Cribl Search organization.
Details Modal
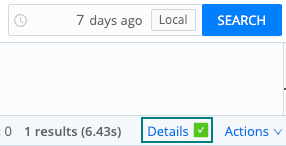
To troubleshoot issues, you can view the search’s details, pipeline plan, logs, metrics, and more. At the bottom right of the query box, select Details.
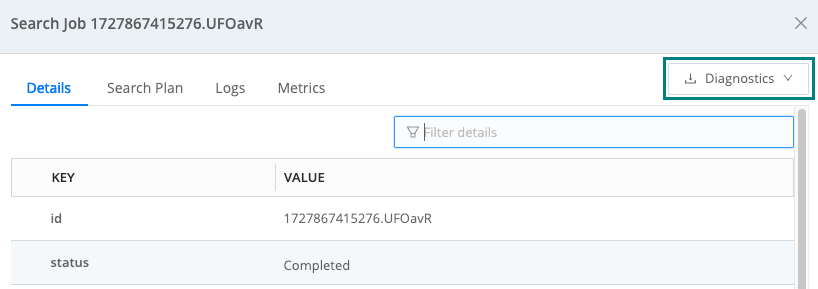
The resulting Details modal (shown below) displays the following:
- id: Unique identifier of the search. You can use it to, for example, reuse search results. To quickly copy the ID, hover over the Search Job panel at the top, and select the Copy to clipboard icon.
- status: Search status -
new,running,completed,failed, orcanceled. - user: User that ran the search.
- query: Search query string. If the query contains Macros, you can see what they resolved to, by selecting Expand Macros.
- earliest: Beginning of query time range, in a relative time format or milliseconds.
- latest: End of query time range, in a relative time format or milliseconds.
- timeCreated: Time when the search was created.
- timeStarted: Time when the search started running.
- timeCompleted: Time when the search was completed.
- timeElapsed: Total time the search ran.
- timeInQueue: How much time the search spent waiting in the queue.
- sampleRate: Ratio to reduce results, see sampling.
- set options: Any
set-statement options affecting the search, likemaxResultsPerSearchorallow_previous_results.
You can also select the following:
- Search the Results, to quickly query the result set of the search.
- Rerun, to run a new search that uses exactly the same query text and settings.
- View Results, to display the cached results of the search.
Diagnostics
The Diagnostics drop-down provides options to download a compressed folder with many backend logs, configuration files, and optionally, your search results.
Select Exclude Results to remove the search results from the downloaded diagnostics folder.
If you’re sending the diagnostics folder to someone, like Cribl Support, we recommend selecting this option to remove the results from the folder. This will keep the file size manageable.
For more about sending diagnostics to Cribl Support, see: Share Diagnostics.
Search Plan
The Search plan tab shows the backend processes your search ran. Your query was converted to a set of pipelines that work on the data. Pipelines are broken into the following categories:
- Federated: Pipelines executed by the remote end.
- Coordinated: Pipelines executed by the coordinator process.
- Combined: Combined Federated and Coordinated view.
Typically, the first function you’ll see in the Federated pipeline is Drop. This is a filtering function, which drops data that does not match its Filter expression.
If your search consists of multiple stages, you can view the pipelines for each stage separately. To see a specific stage, select its ID on the left (for example, root).
Export a Search Plan
You can export the plan of a search as a JSON file:
- Run a search.
- Once the search starts running, select Details, then Search Plan.
- If your search consists of multiple stages, select the ID of the stage whose plan you want to export (for example, root).
- At the bottom left, select View as JSON to see the search plan in JSON format.
- At the top right, select Export. The search plan is downloaded as a JSON file.
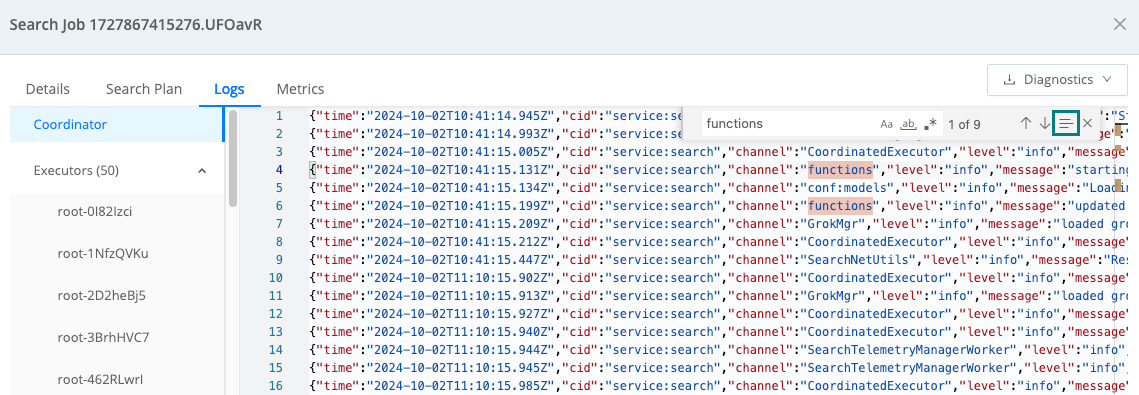
Logs
Cribl Search creates log events of your search. You’ll see informational and debugging level entries with details on every process run for your search.
Logs are separated into either Coordinated or Executors types:
- Coordinated: Organize query execution and do post-processing, for example, merging, sorting, aggregation, and persisting the search results.
- Executors: Scan data, for example, reading from S3, decompressing, filtering, and projection.
Enable Debug Logging for a Query
By default, Cribl Search logs informational-level events for your search. For a more detailed
output for a specific query, add a set statement with logger_level="debug" at the
beginning of the query:
set logger_level="debug";

dataset="cribl_search_sample" | limit 100After the search runs, open Details > Logs to review the debug-level output. This covers most debugging needs without requiring any system-level configuration changes.
Find Logs
Select inside of the pane with the logs and then press Control+F (Windows) or Command+F (Mac) to open the Find bar.
You can search by plain text and have three advanced search options:
- Match Case
- Match Whole Word
- Regular Expression
By default, searches run against all logs. To search against only specific text, highlight the desired text and click the three horizontal lines icon.
Metrics
Metrics from your search are provided to give you insight into the search’s performance and the amount of data it touched.
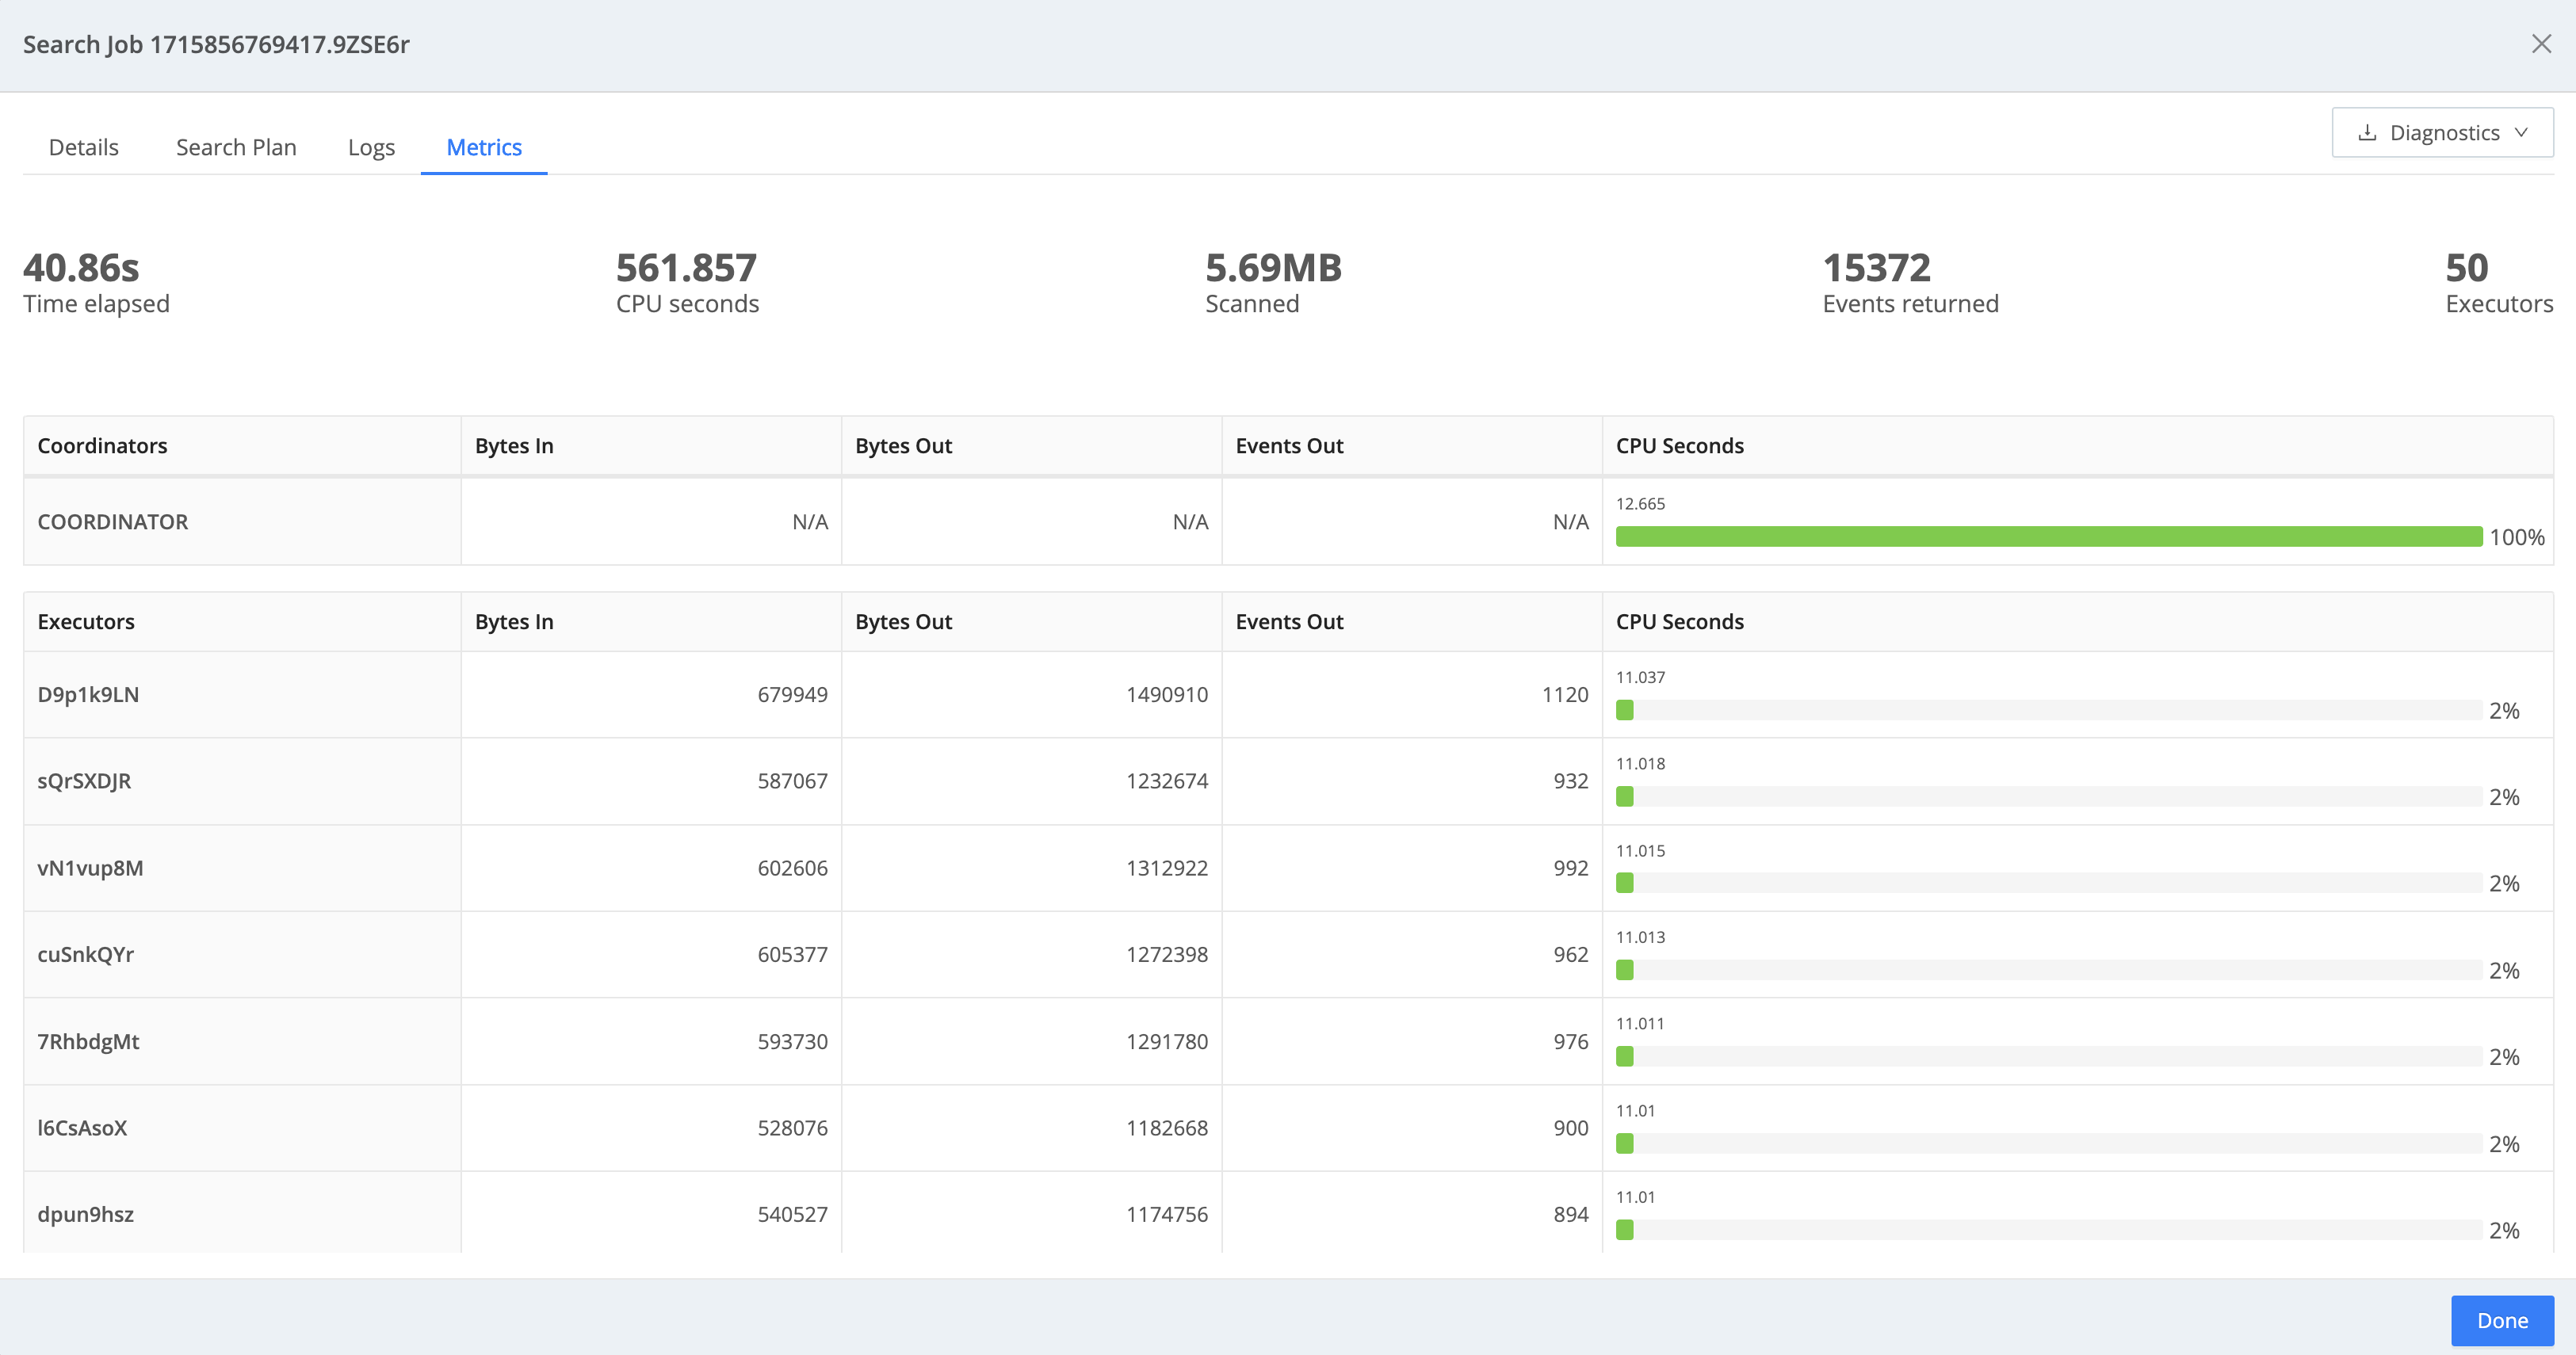
The top area provides a high-level summary of the stats for the search:
- Time elapsed: How much time the search took.
- CPU seconds: Sum total of CPU seconds spent on the search.
- Scanned: Total volume of data ingested by executors and coordinators, calculated after decompression.
- Events returned: Number of events the search returned.
- Executors: Number of workers the search was split across.
Coordinators
The Coordinators table displays a summary of the work done by the coordinator locally. If no Datasets were processed by the coordinator, Bytes In, Bytes Out, and Events Out stats will be N/A.
Executors
The Executors table displays metrics of the work done by the federated executors, reported on a per-executor basis.
View Usage Statistics
As a Search Admin, you can query the cribl_internal_logs Dataset to monitor how your Workspace is using Cribl Search. Cribl Search writes product metrics to this Dataset every hour.
Runnable Kusto code examples include a Run in Cribl Search link in the top-right corner of the code block. Select it to open the query in your Cribl Search environment with the query loaded and ready to execute. You can also use the Copy button to copy a query and paste it into your own search.
View Dashboard Statistics
To check Dashboard statistics, search the cribl_internal_logs Dataset for the following fields:
| Field | Description |
|---|---|
search.dashboards | Total number of Dashboards in the Workspace. |
search.dashboards.creators | Number of users who have created at least one Dashboard. |
For example, to see the total number of Dashboards in your Workspace:
dataset="cribl_internal_logs" name="search.dashboards" earliest=-2h
| summarize arg_max(_time, value)
| project Dashboards = valueView Dataset and Provider Statistics
To check Dataset and Provider statistics, search the cribl_internal_logs Dataset for the following fields:
| Field | Description |
|---|---|
search.datasets | Total number of Datasets configured in the Workspace. |
search.providers | Total number of Dataset Providers, with a breakdown by Provider type. |
For example, to see the total number of Datasets in your Workspace:
dataset="cribl_internal_logs" name="search.datasets" earliest=-2h
| summarize arg_max(_time, value)
| project Datasets = valueView User Statistics
To check User statistics, search the cribl_internal_logs Dataset for the following field:
| Field | Description |
|---|---|
search.users | Number of users in the Workspace, with a breakdown by Role. |
For example, to see the number of users in your Workspace:
dataset="cribl_internal_logs" name="search.users" earliest=-2h
| summarize arg_max(_time, value)
| project Users = valueView Saved Queries and Scheduled Searches
To check saved query and scheduled search statistics, search the cribl_internal_logs Dataset for the following fields:
| Field | Description |
|---|---|
search.saved_queries | Total number of saved queries in the Workspace. |
search.scheduled_searches | Total number of scheduled searches in the Workspace. |
For example, to see the total number of saved queries in your Workspace:
dataset="cribl_internal_logs" name="search.saved_queries" earliest=-2h
| summarize arg_max(_time, value)
| project SavedQueries = value