


Searching Cribl Edge
Learn how to search your Cribl Edge data.
Cribl Search comes with several Cribl Edge Datasets allowing you to quickly search Cribl Edge’s internal logs and metrics that provide comprehensive information about an instance’s status/health, inputs, outputs, Pipelines, Routes, Functions, and traffic. You can edit these built-in Datasets or create new ones to specify other logs anywhere in the filesystem that Edge can read.
Don’t have a Cribl Edge Node? See the setup guide for Cribl Edge.
This document provides examples of searching Edge logs and metrics. To start, navigate to Search Home, where searches are run.
Searches over Cribl Edge execute in real time, at rest, directly on Edge Nodes. Broad or expensive queries can impact CPU and I/O on your nodes, especially over large time ranges. To minimize impact, see Best Practices for Searching Cribl Edge.
Best Practices for Searching Cribl Edge
Scope by Fleet: Use the built-in
cribl_fleetfield to target a specific Fleet (for example,cribl_fleet=MyFleet). If you omit this filter, your query will run across all Edge Nodes in the system, which includes all configured Fleets.Keep timeframes tight: Start with the narrowest time range that can answer your question, then expand only as needed.
Avoid excessive wildcards: Prefer specific field filters and paths over broad wildcard matches, especially in early query stages.
Validate your scope first: Use Explore > Files in Fleet to confirm you are targeting the right locations before running large searches. For details, see Explore Cribl Edge.
Examples
Load Average
Imagine you are conducting an investigation and you need to determine which Edge Nodes have a higher-than-usual load average.
Let’s go to the Dataset called cribl_edge_metrics and tell the search to return all the events that have the
node_load term in them. And then let’s ask it to build a time series of the load average of one minute (the default
span) and split it by host:
dataset="cribl_edge_metrics" node_load*
| limit 1000
| timestats load1=max(node_load1) by host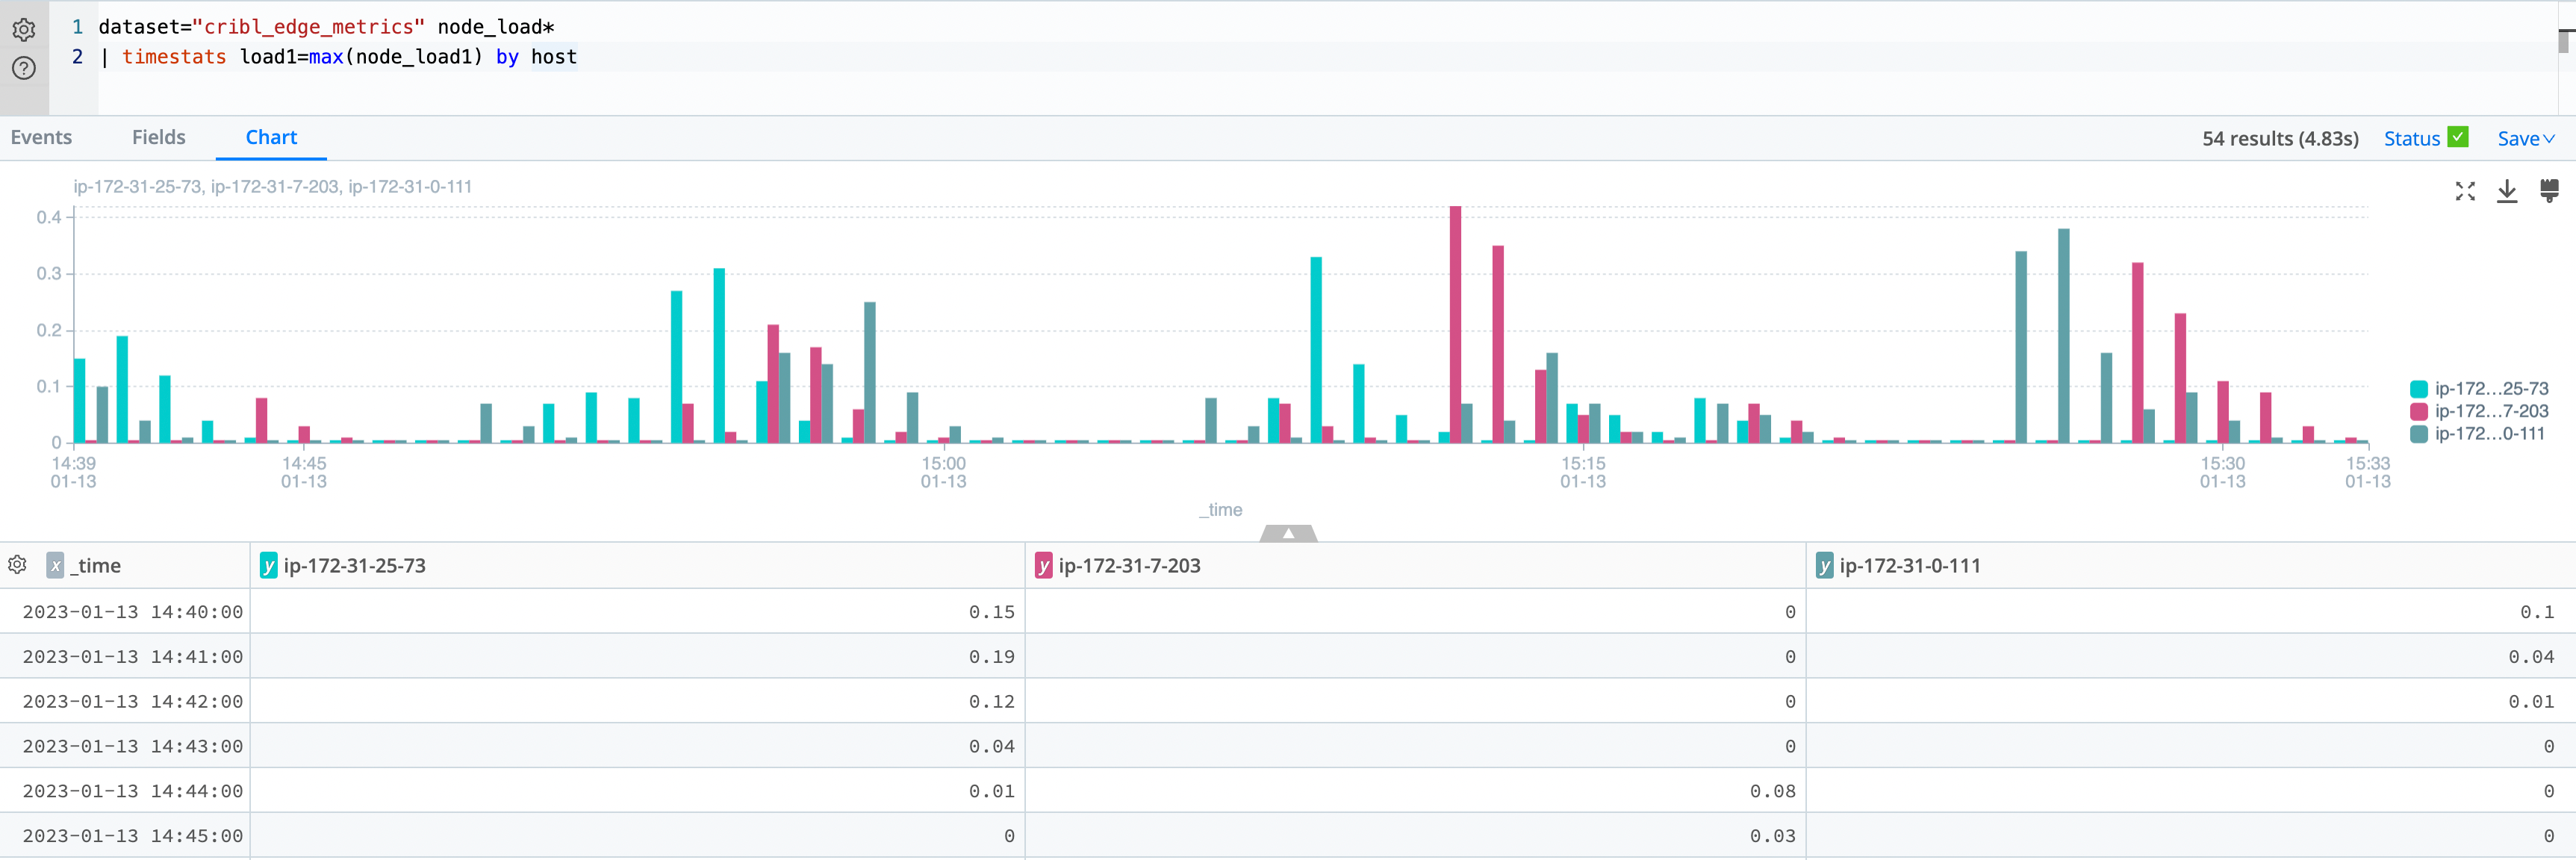
We haven’t collected this data in advance, we haven’t moved it or pre-processed or ETL it in any way. The search is executed in real-time, at rest, directly on the edge.
Let’s change the charting option to Area to improve visibility:
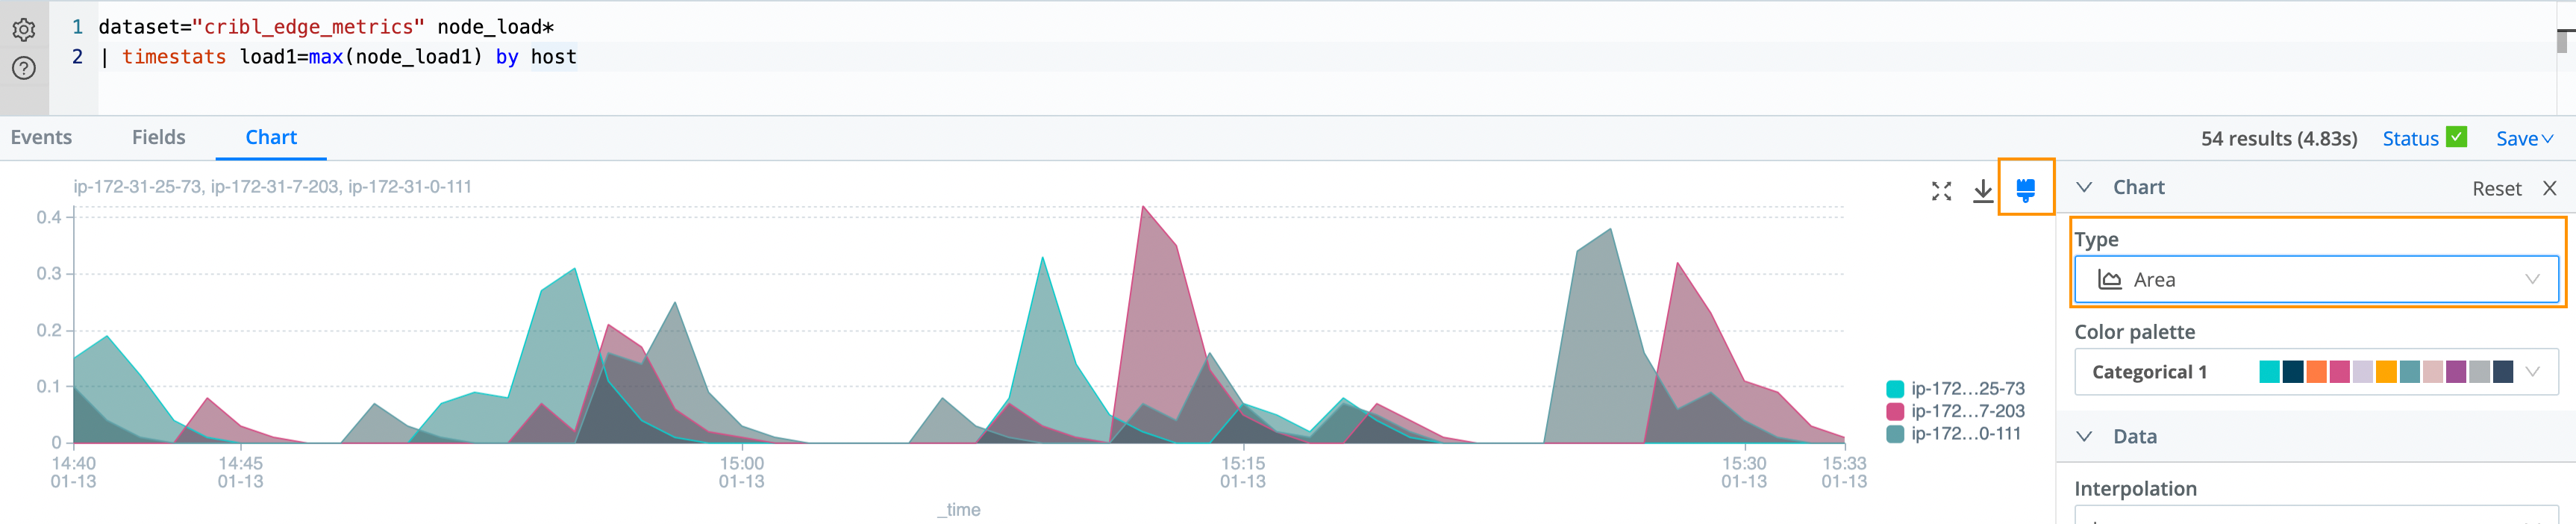
Cribl Search comes with rich charting options out of the box, allowing you to adjust Charts as needed.
System Logs
Now, let’s check the /var/log directories containing the system logs of all Edge Nodes in the Fleet. We will query the
built-in cribl_edge_system_logs Dataset and tell the search to get all the files that match *auth.log and have the
terms sshd and users. We also set a limit of 1,000 results to return:
dataset="cribl_edge_system_logs" source=*auth.log sshd user
| limit 1000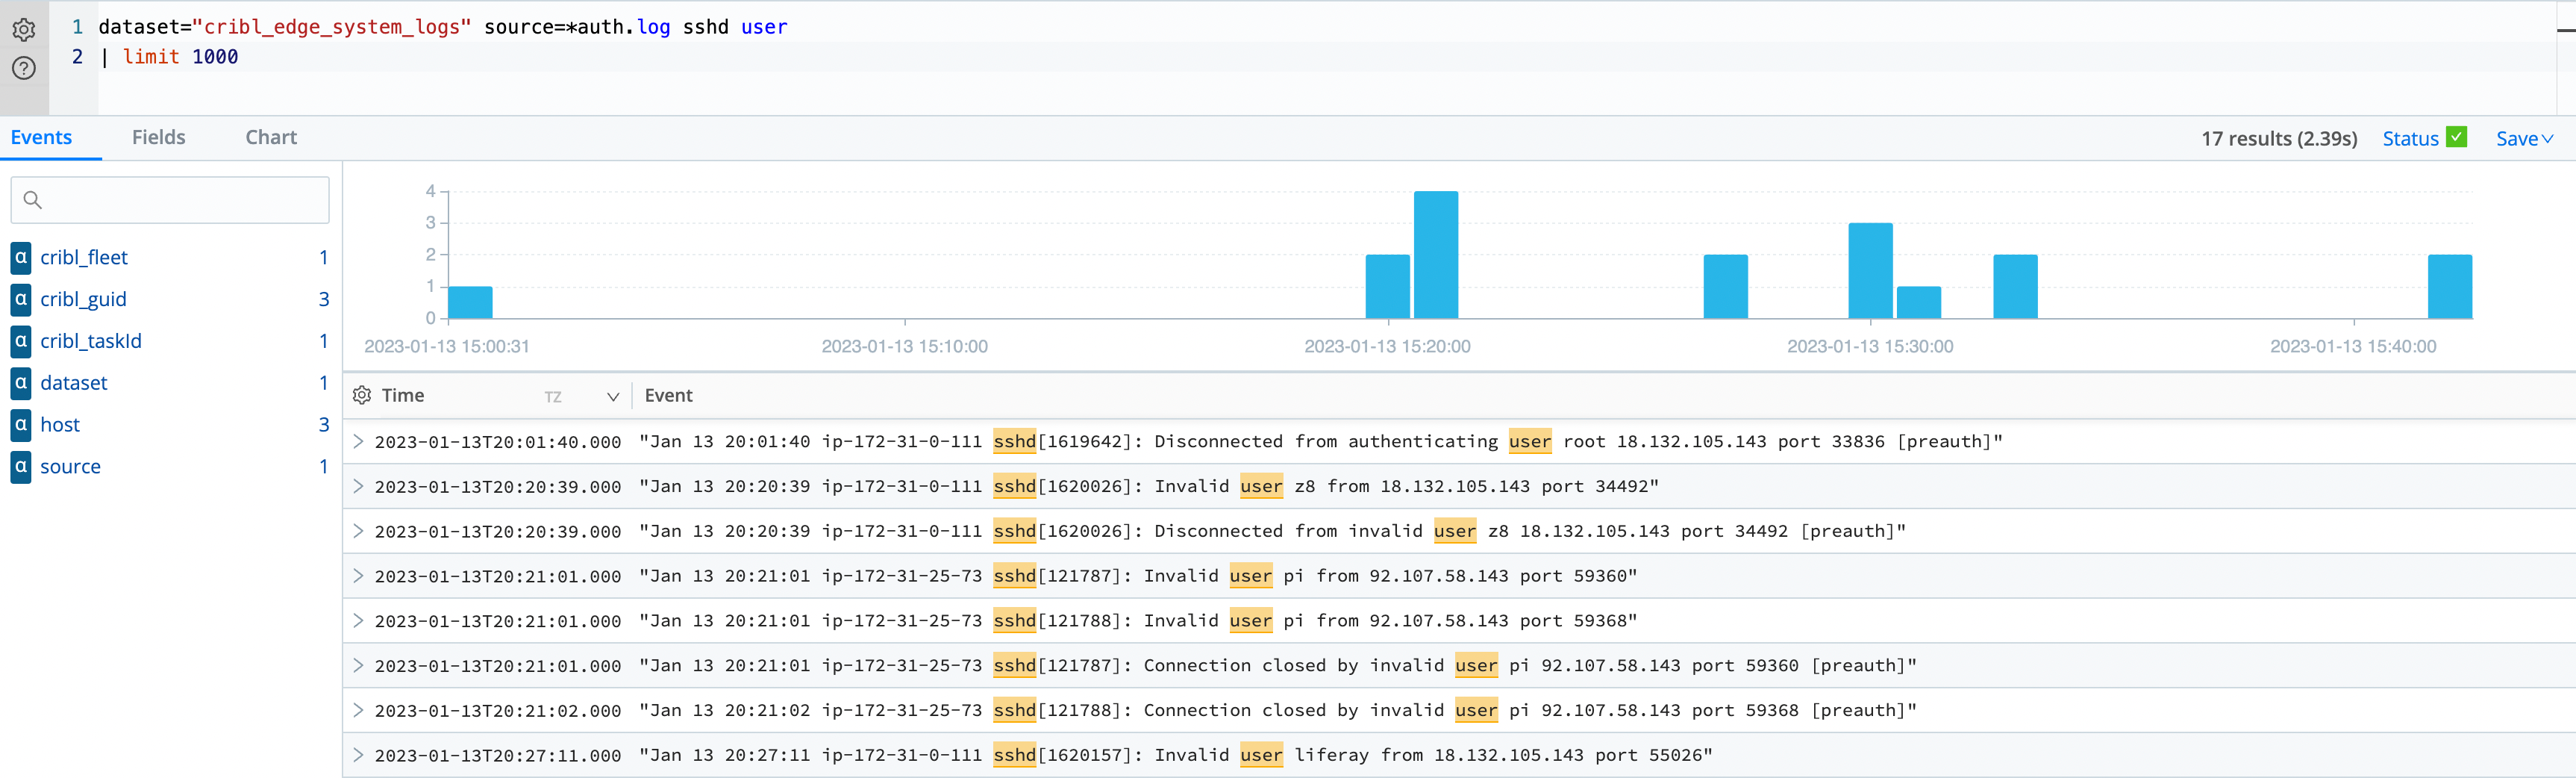
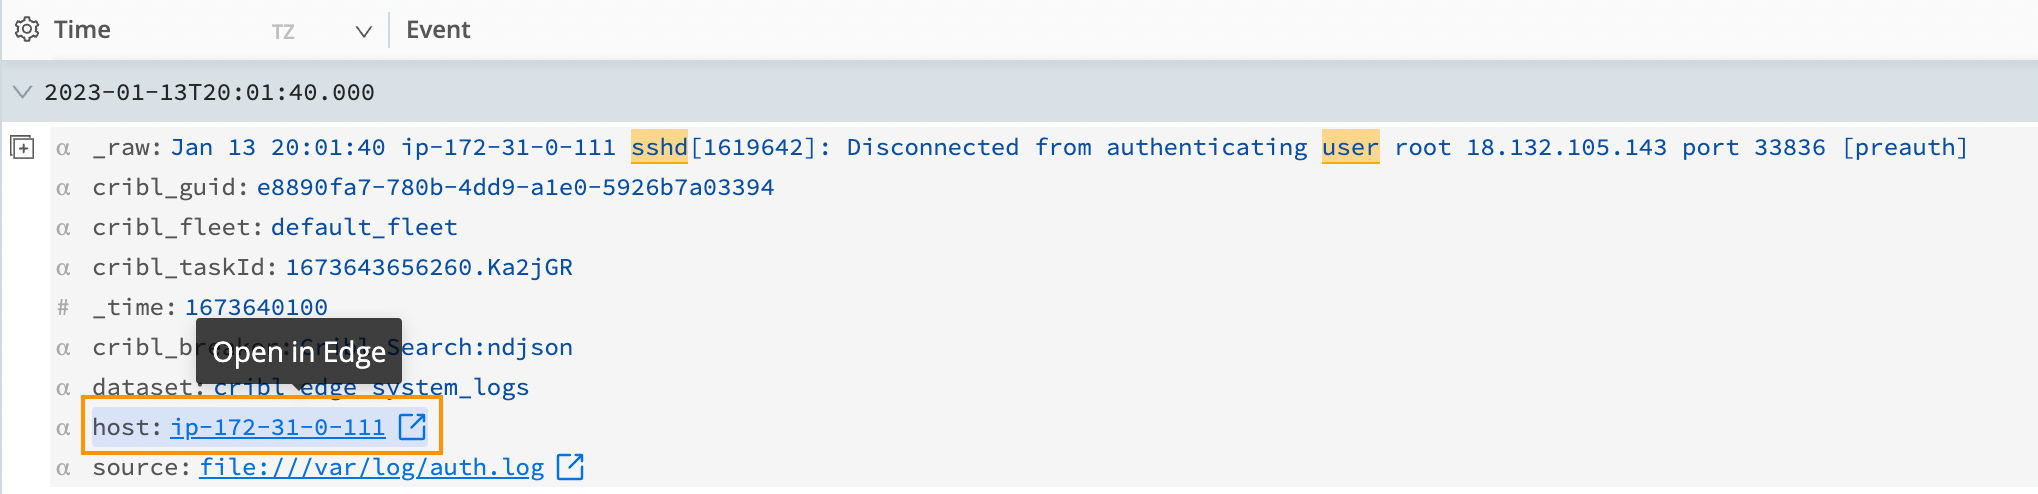
Cribl Search understands that these events are coming from Cribl Edge, and we can select the link and teleport directly to that Edge Node and see that file.
Search Just a Single Fleet
You can easily filter Cribl Edge search results to a specific Fleet, using the built-in field cribl_fleet.
For example, the following query searches the cribl_edge_system_logs Dataset for events that:
- Match
*auth.log. - Contain the terms
sshdandusers. - Come from a Fleet called
VermontGoatFarm.
dataset="cribl_edge_system_logs" source=*auth.log sshd user cribl_fleet=VermontGoatFarm
| limit 1000