


Cribl Search Tour
Find your way around the Cribl Search UI.
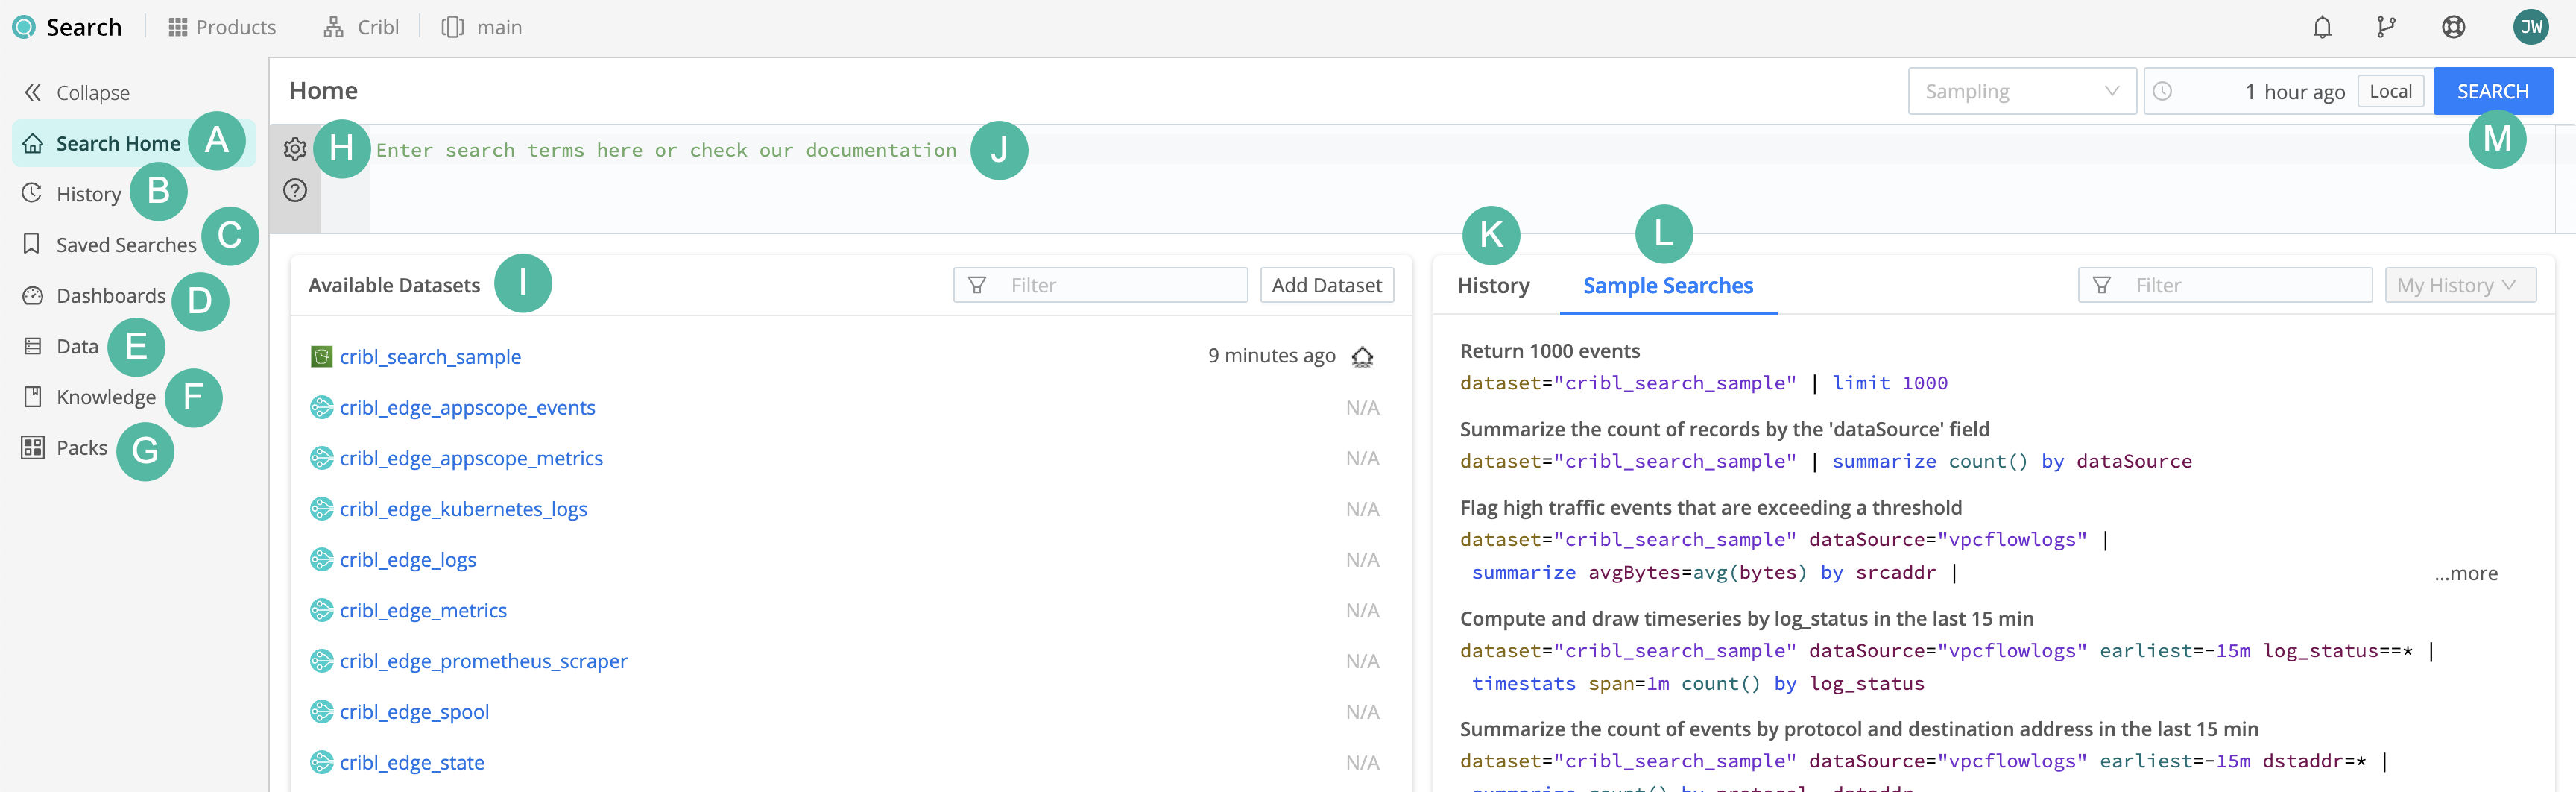
Search Home
Search Home is where you run your current search.
| Letter | Description |
|---|---|
| A | Search Home is where you run the current search. |
| B | History keeps a detailed account of previous searches. |
| C | Saved Searches contain any searches you save. |
| D | Dashboards enable you to visualize your search results in a variety of ways. |
| E | Data is where you can manage your Datasets, Dataset Providers, and Datatypes. |
| F | Knowledge contains your lookups, Parsers, regexes, Grok patterns, and Macros |
| G | Packs is where you manage your Cribl Search Packs. |
| H | This gear button lets you change the UI options of the query box. |
| I | Available Datasets. The
 icon indicates Cribl Lake Datasets attached to a Lakehouse.
 |
| J | The query box, where you write your query. |
| K | This History displays the most recent searches. |
| L | Sample Searches are predefined searches that enable you to explore Cribl Search. |
| M | The SEARCH button runs the query. |
Explore your data
Before running a search, you can explore the contents of a Dataset to understand what data it contains.
From Search Home, select a Dataset name in the Available Datasets list. This opens a dataset details view where you can review:
- Dataset statistics such as total event count, data size, and time coverage
- Field statistics, including field types, presence percentage, and distinct values
- Usage signals such as recent search activity
These insights help you confirm that the Dataset contains relevant data and identify useful fields before writing a query.
For more details, see Inspect Your Datasets.
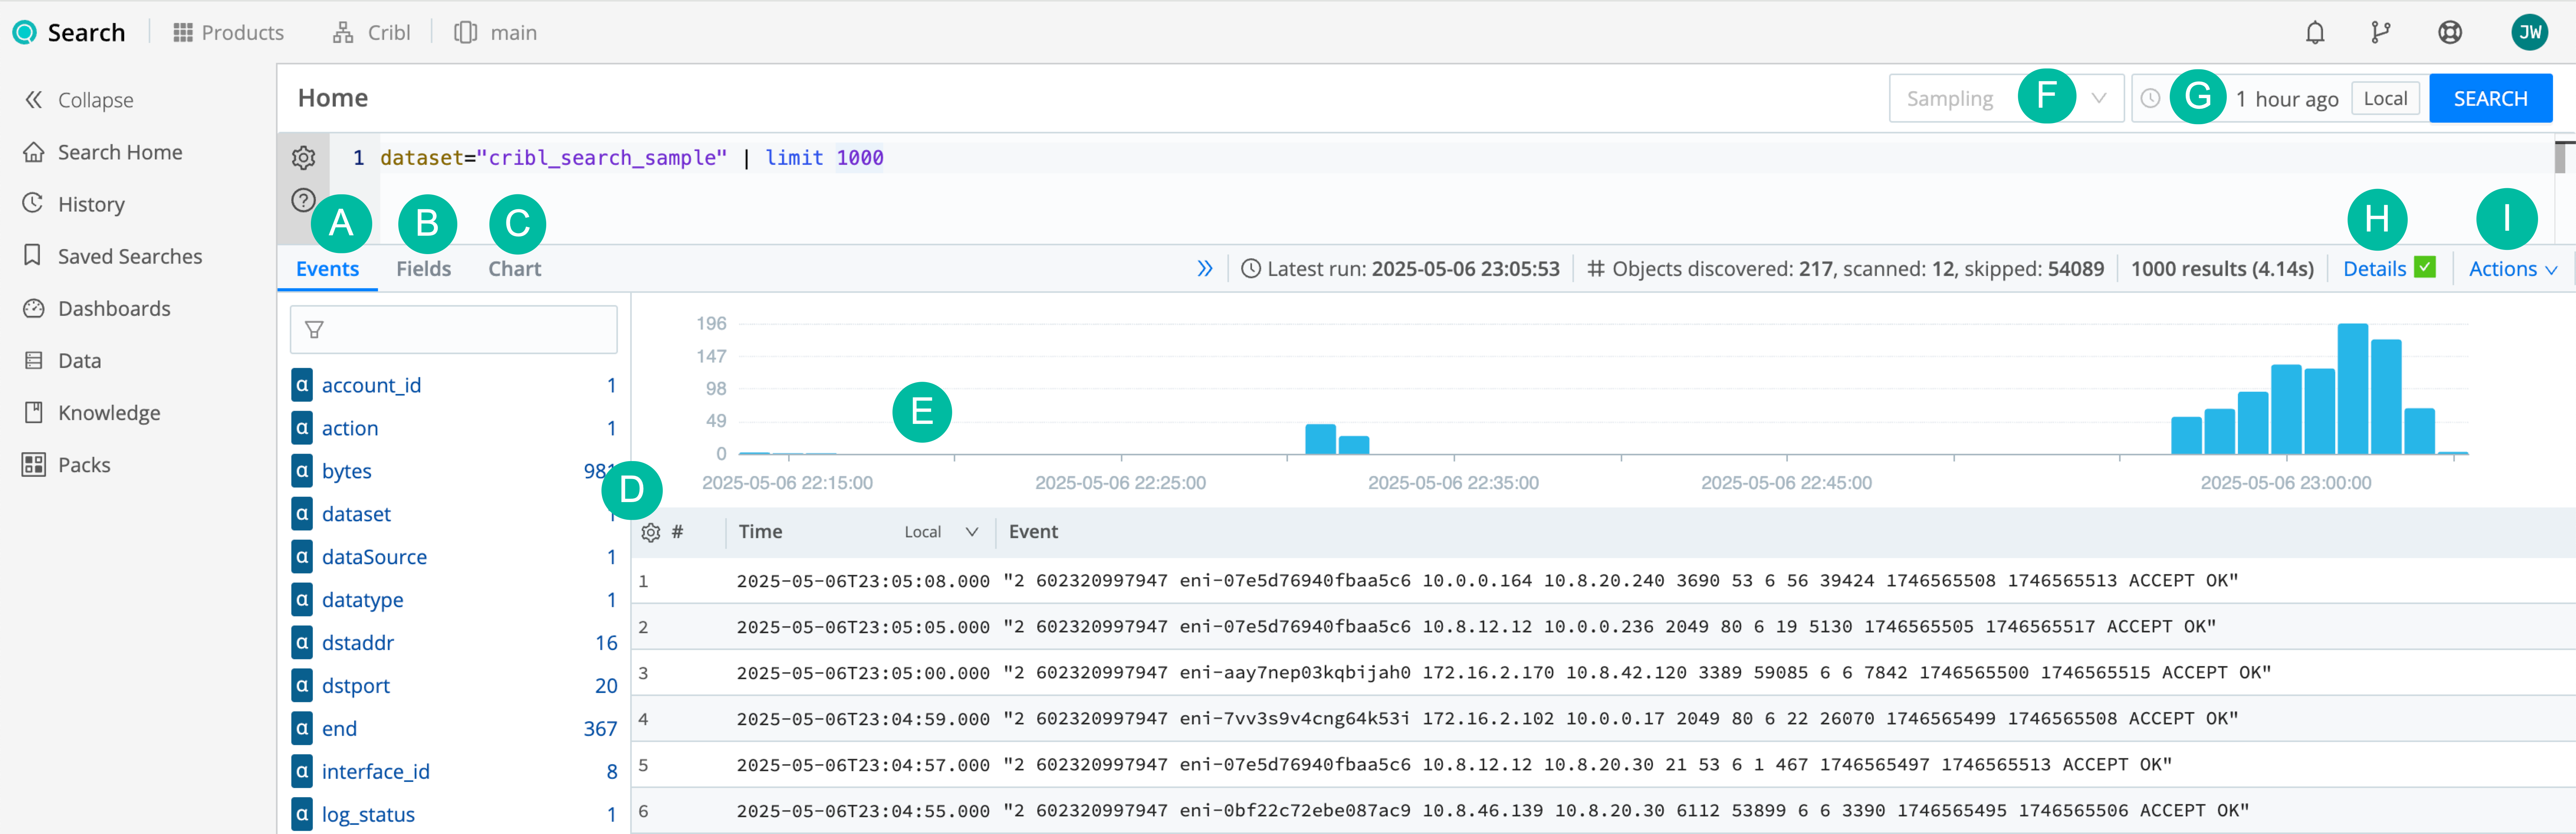
After running a search, your Search Home page looks like this:
| Letter | Description |
|---|---|
| A | The Events tab shows non-aggregate search results as events. |
| B | The Fields tab displays search results as fields. |
| C | The Chart tab visualizes aggregate search results. |
| D | This gear button lets you change the results view options. |
| E | The Histogram lets you view the results for the time you select. |
| F | The Sampling drop-down controls the sampling ratio of the current search. |
| G | The Time range field sets the date and time range of the current search. |
| H | The Details modal shows the search details, such as logs and metrics. |
| I | The Actions drop-down lets you save the current search, export the results, and more. |
If you enable Cribl Copilot, your Search Home might also show query suggestions, and other Copilot features.
History
History is where you can view, rerun, save, and delete previously run searches, filter and examine their results, and add them to Dashboards.
Search Admins see the history of all searches run within their Organization. Search Users and Editors see only their own searches.
At the upper left of History, use the Filter history field to define general filters for the searches. At the upper right, filter the searches by selecting All, Scheduled, or Not Scheduled.
To refresh the searches, select the refresh button
 next to the Last refreshed
timestamp.
next to the Last refreshed
timestamp.
History includes the following columns:
| Column | Description |
|---|---|
Search String | The query text used in the search. For scheduled searches, this column also displays the scheduled search name (hover over to copy) and the number of executions (select to view the execution history). |
| Search ID | Unique ID for the search. Select a search’s ID to launch the Details modal for the search. |
| Event Count | Number of events that the search returned. |
| Type | The search’s job type: standard, scheduled, command, or dashboard. |
| Status | The search’s status: Running, Completed, or Canceled. If a Completed search includes items, the status is represented by the number of items and a green icon. |
| Dataset | The name of the Dataset that is defined for the search. |
| User | The name of the Member who ran the search. |
| Duration (s) | Duration of the search’s run, in seconds. |
| Latest Run | Date and time when the search was run. |
| Actions | Menu of available actions for the search. Select the Actions button
 to access these options.
 |
Most of the columns in History support sorting and filtering:
- To sort, hover over a column heading to display the sorting arrows
 at the right side of the
column label. Select the up or down arrow to change the column’s sort order.
at the right side of the
column label. Select the up or down arrow to change the column’s sort order. - To filter, hover over a column heading, select the funnel button
 and define the
filter you want to apply.
and define the
filter you want to apply.
History also provides options for opening and deleting searches:
- To open a search in Search Home, select its row. Mind that this doesn’t rerun the search, but only loads the cached results.
- To delete one or more searches, select the check boxes on the left side of their rows and select Delete Selected Jobs at the bottom of the page.
Actions Options
The Actions menu in History includes the following options:
- Details: Launches the Details modal.
- Rerun: Opens Search Home and reruns the search.
- Save: Launches the Save Search modal, in which you can name, describe, and adjust the search and save it for future access Saved Searches.
- Search the Results: Opens a new browser tab, on which you can query the result set of the search.
- Add to Dashboard: Turn the search into a visualization panel and add it to a new or existing Dashboard.
- Cancel: Cancel the search. Included in the Actions menu only for searches that are still running.
- Delete: Delete the search.
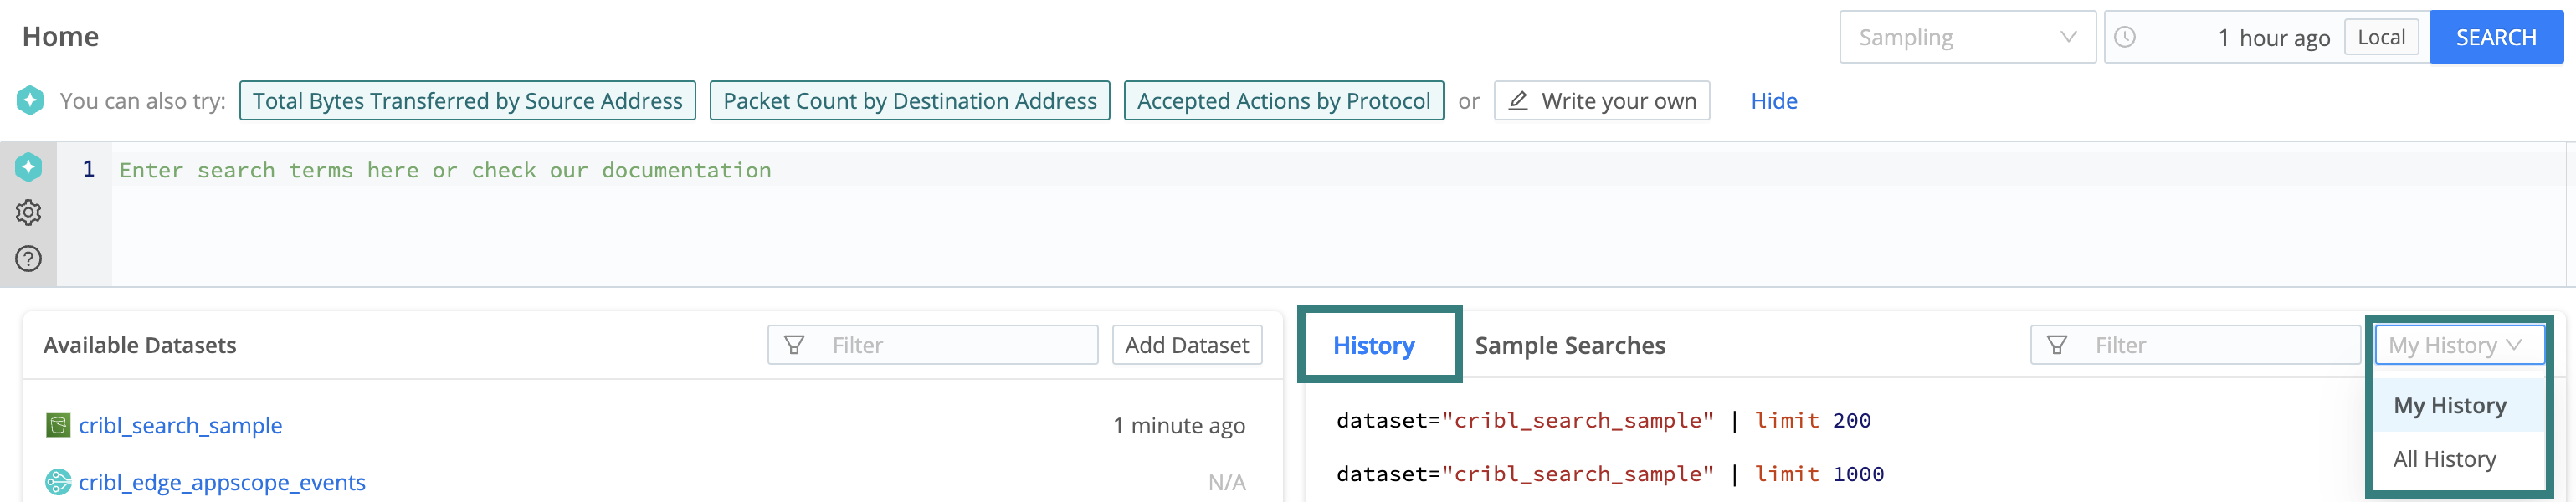
Toggle Between Personal and Organization History
As an Admin Search Member, you can quickly switch between viewing the history of your own searches and the history of all searches run in your Organization.
- From the Cribl Search sidebar, select Search Home.
- Select History next to Sample Searches (note that it’s separate from the main History).
- From the drop-down to the right, select either My History (default) or All History.
Saved Searches
The Saved Searches left tab is where you can add, run, clone, and delete saved searches, and add them to Dashboards. You can also export, share, and import saved searches in Packs.
After you save a search, you can schedule it to run at a specified time interval.
Search Admins see all searches saved within their Organization. (Admins can also schedule searches saved by active users.) Search Users and Editors see only their own saved searches.
On the Saved Searches page, you can:
- Create a new saved search by selecting Add Search at the upper right.
- Filter the saved searches by selecting All, Scheduled, or Not Scheduled.
- Display the columns that are hidden by default by changing the table options in the top-left corner (next to the Name column).
- At the upper left, use the Filter saved searches field to define general filters for the searches.
Saved Searches include the following columns:
| Column | Description |
|---|---|
Name | The user-provided name and description of the search. |
| Search String (hidden by default) | The search string used in the search. Select ...more to launch the Save Search modal, in which you can adjust the search and save it as a new search. |
| Earliest (hidden by default) | The earliest time within the search’s time range. If the value is 0, the search includes all relevant information without restrictions on how far back in time it looks. |
| Latest (hidden by default) | The latest time within the search’s time range. If the value is now, the time range includes the most recent information available at the time the search is executed. |
| Schedule | For scheduled searches, the schedule on which the search runs. For unscheduled searches, Off. |
| Next Run | For scheduled searches, the date and time at which the search will run next. For unscheduled searches, N/A. |
| Pack (hidden by default) | The name of the Pack that the search belongs to. |
| Created By | The name of the user who saved the search. |
| Notifications | Indicates whether at least one Notification is enabled on a saved search. Select the indicator to open the search’s configuration modal, where you can access the alert’s details. |
| Actions | Menu of available actions for the search. Select Run to run the saved search. Select the Actions button
to access these options. |
Most of the columns in Saved Searches support sorting and filtering:
- To sort, hover over a column heading to display the sorting arrows
at the right side of the
column label. Select the up or down arrow to change the column’s sort order.
- To filter, hover over a column heading, select the funnel button
and define the
filter you want to apply.
Select any row in the table to launch the Save Search modal, in which you can adjust the saved search and save it as a new search for future access from Saved Searches.
To delete one or more searches, select the check boxes on the left side of their rows and select Delete Selected searches at the bottom of the page. If the search you want to delete belongs to a Pack, see Delete a Pack Resource.
Actions Options
The Actions menu in Saved Searches includes the following options:
- Clone: Launches the Save Search modal, in which you can adjust the search and save it as a new search.
- Add to Dashboard: Turn the search into a visualization panel and add it to a new or existing Dashboard.
Changing Saved Search Ownership
If the creator of a saved search is no longer an active Cribl Search Member, Search Admins with access to the search can continue to run it ad hoc. (They will now appear as the user requesting the search.) However, they will be unable to schedule the search. The Admin will need to copy the search’s details, and to then re-create, save, and schedule the search under their ownership.
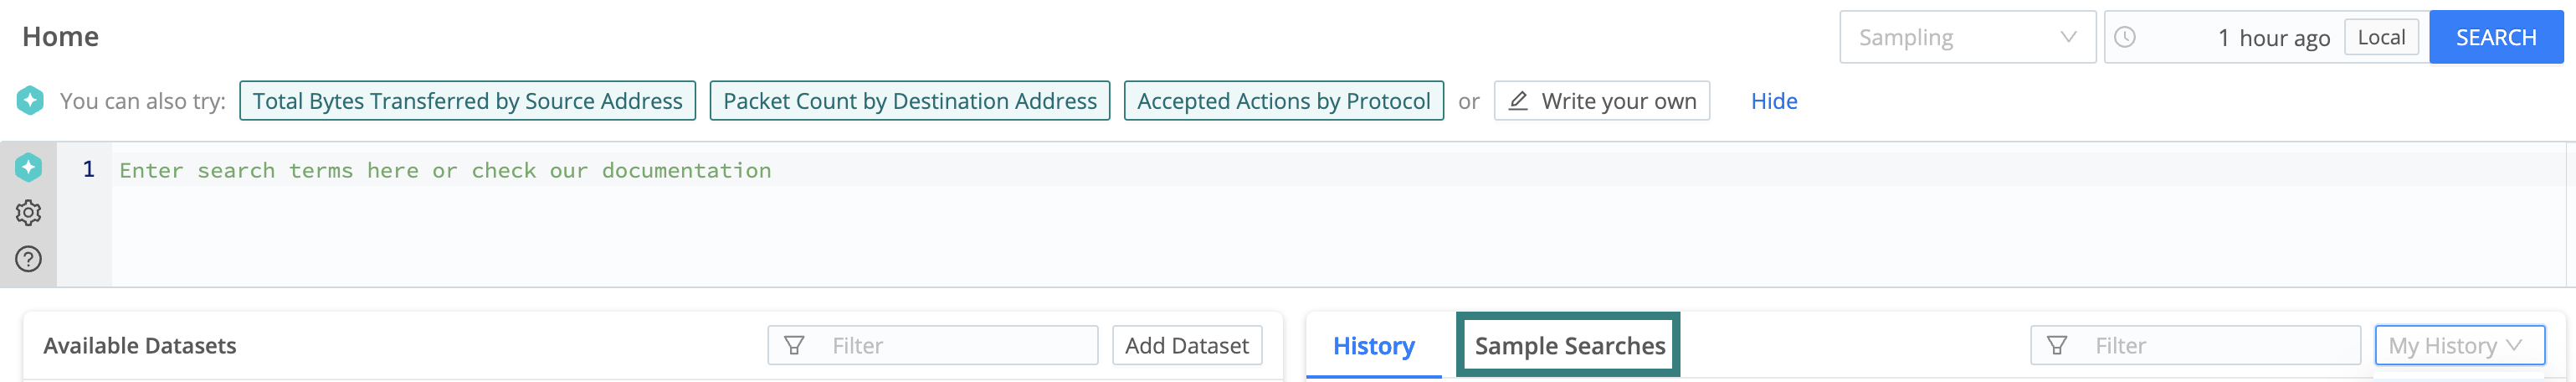
Sample Searches
Cribl Search provides several searches against its own internal logs. You can find them in Search Home > Sample Searches.
Search Results
A search returns results on three tabs:
- Events - displays non-aggregated search results. See Events Tab for details.
- Fields - displays all of the returned fields on a table. See Fields Tab for details.
- Chart - displays aggregated search results on a Chart and table. See Chart Tab for details.
Based on the type of the results, Cribl Search automatically selects the appropriate tab. However, you can override this
by using the render operator.
Track the Progress of Your Search
Once a search starts running, you can see its progress next to the Details indicator.

Select
 to expand the toolbar. Depending on the type and state of your search,
you’ll see the following details:
to expand the toolbar. Depending on the type and state of your search,
you’ll see the following details:
- Name of the search (if it’s a saved search).
- Latest run: The timestamp of the most recent initiation of that search. If you opened the search from History, this tells you how old the displayed results are.
- Total number of objects that Cribl Search has Discovered, successfully Scanned, or Skipped (for example, because they were in an unsupported Amazon S3 storage class).
- Number of results returned.
- Duration of the search.
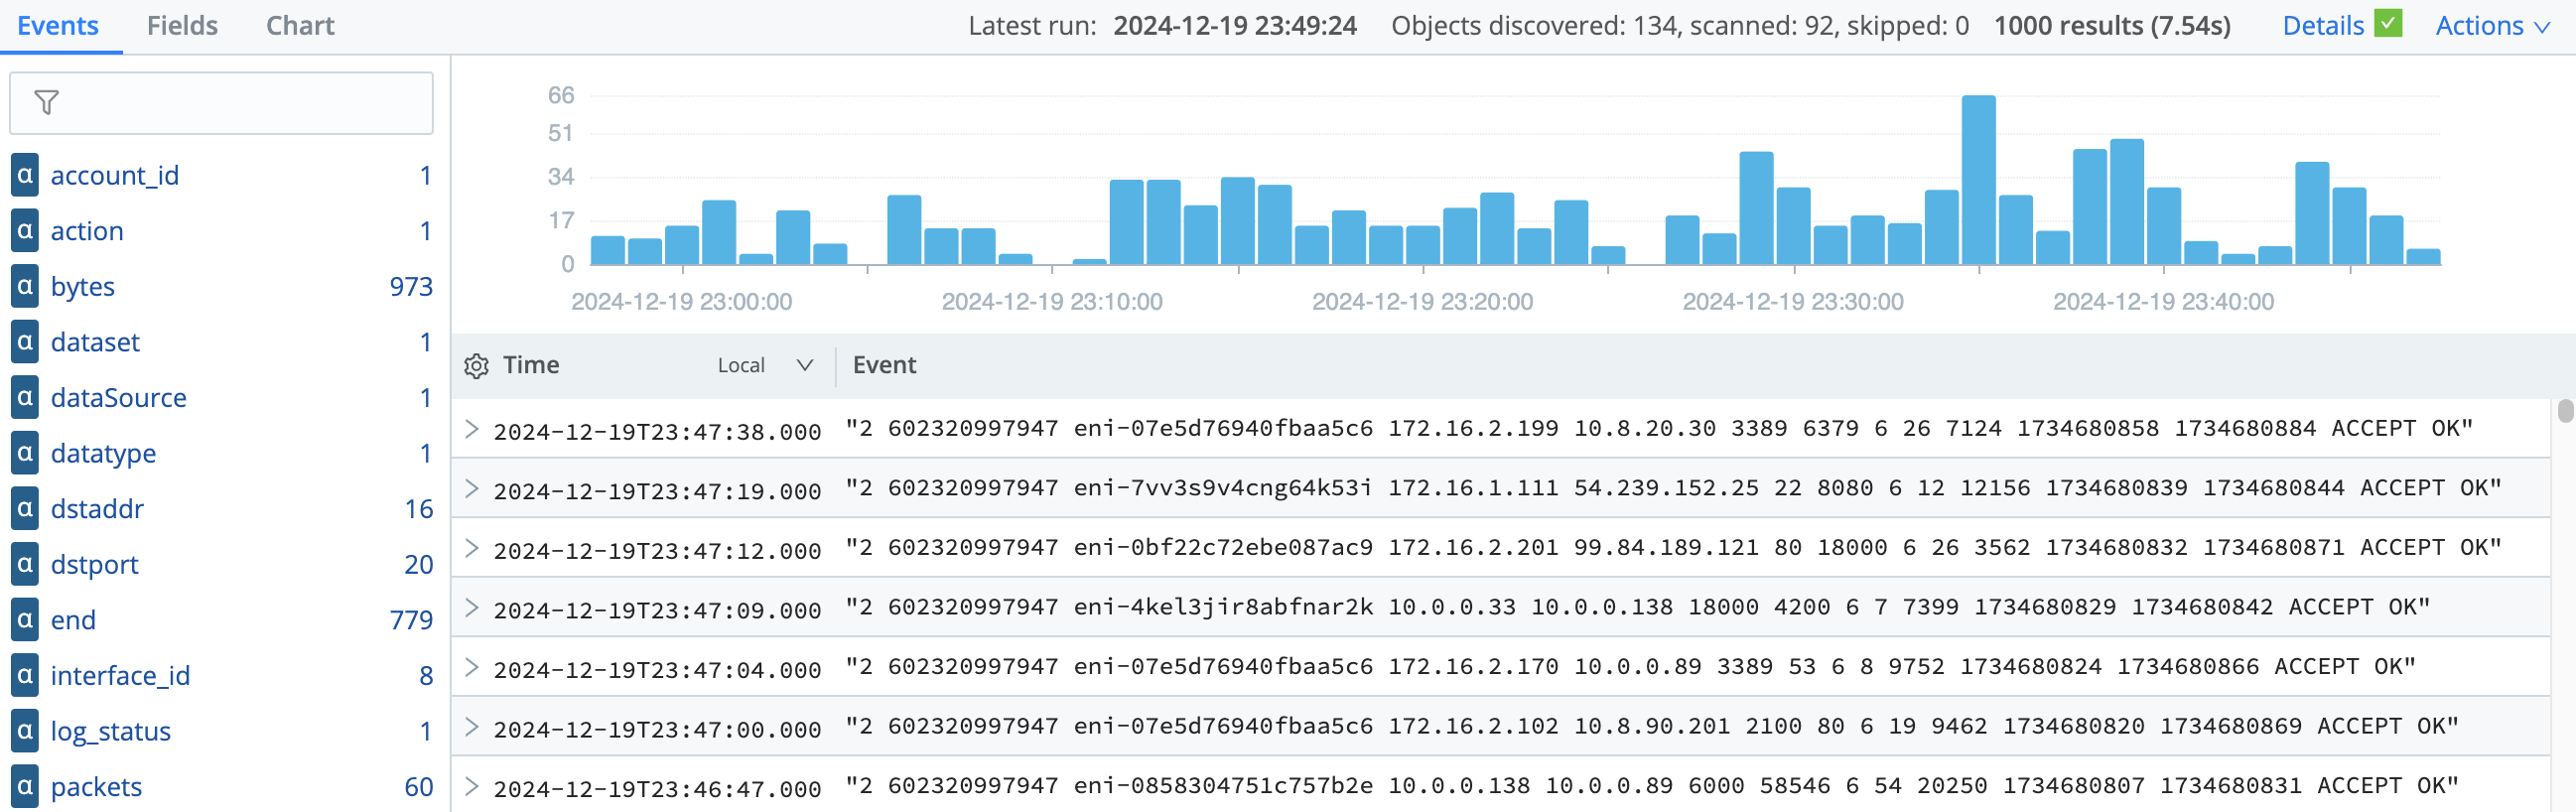
Events Tab
The Events tab displays a table with the raw log events returned from the search, along with a histogram, and the field browser.
To display results in the Events tab regardless of the search’s type, append your query with
| render event.
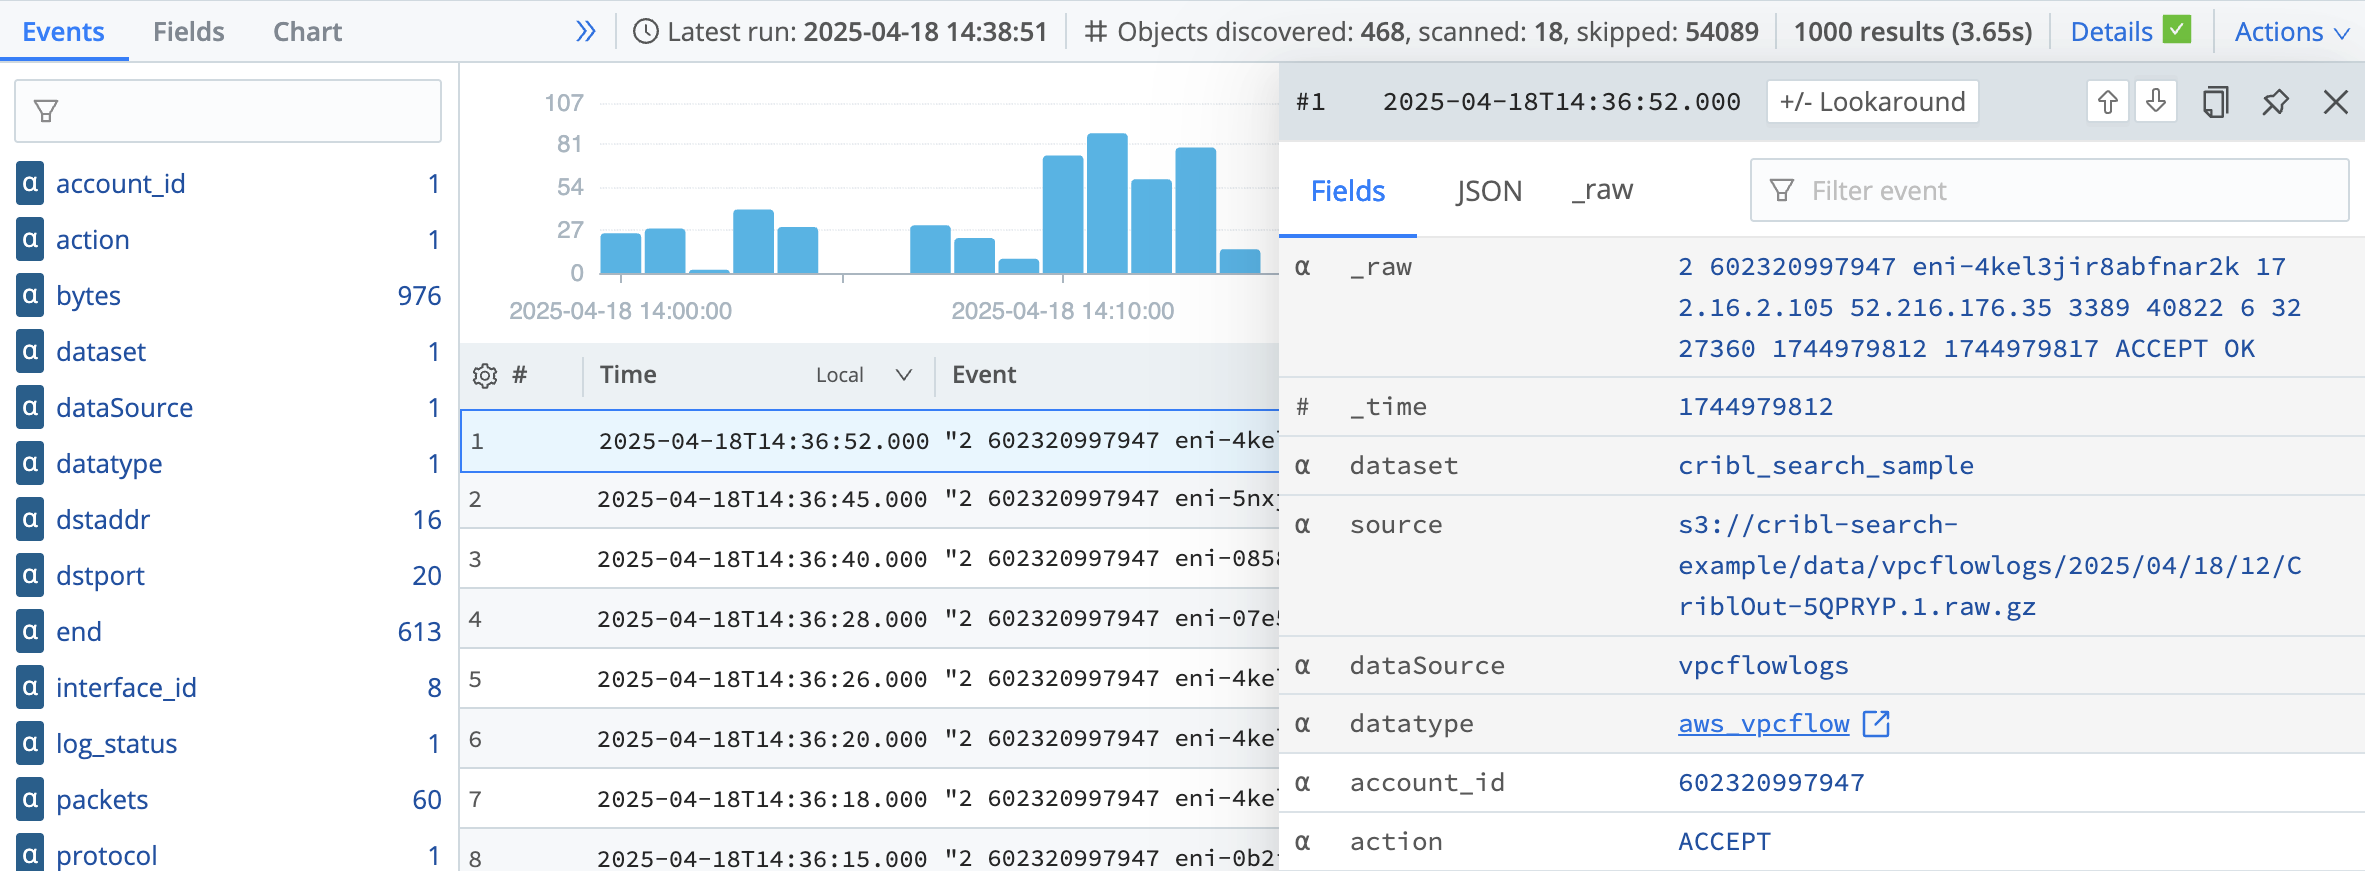
Select any of the rows to open the event details panel, which displays the fields of the selected event.
Now, you can navigate between events using your keyboard’s Up and Down arrow keys.
In the panel, you can:
- Filter the fields displayed. Type into the search bar at the top right.
- View the fields in JSON format. Select JSON at the top.
- View the
_rawfield, which contains the original event data. Select _raw at the top. - Look up events outside of the time frame of the current search. Use the Lookaround at the top.
- Copy the event’s JSON to the system clipboard. Select at the top.
- Pin the panel open. Select at the top right.
You can also quickly incorporate any of the fields into your next search. Select a field to see these options:
- Add field in search: Include this field name and value in the current query. If your query already includes this field, you’ll see the Remove field from search option.
- Exclude field from search: Exclude this field value in the query (for example,
action!="ACCEPT"). - New search with field: Open another Cribl Search window, and include this field name and value in the new query.
- Copy value to clipboard: Copy the value of this field to the system clipboard.
To close the panel, click anywhere outside of it, or select X at the top right.
Change the Event View Options
When viewing the Events tab, you can change how the results are displayed.
Select the gear button in the heading row (to the left of Time).
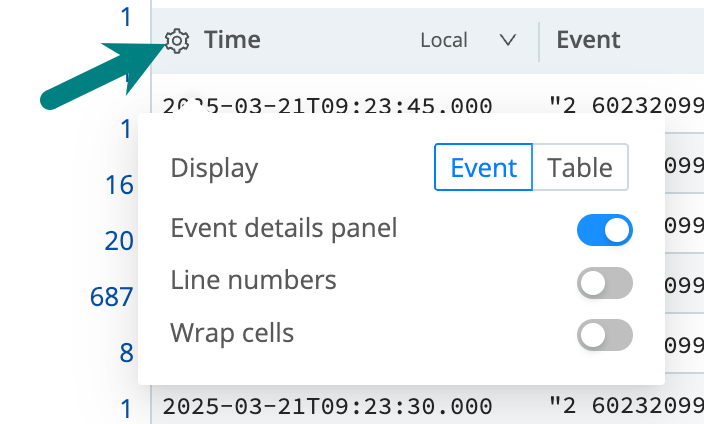
Here, you can:
- Toggle Event details panel off to disable it. You’ll now be able to view fields directly in the table, by selecting > at the left of an event row.
- Toggle Display to view the original Events, or a Table with only the returned fields.
(The Table option allows you to adjust the order of columns displayed. Select and drag a column to the desired location.) - Toggle Line numbers on or off to display or hide line numbers.
- Toggle Wrap cells on to prevent values from overflowing.
Events Shortcuts
In Events view, you can hover over field names in the sidebar to display an Add field to column button. Select these buttons to quickly build a custom Table view, showing only the fields that interest you.
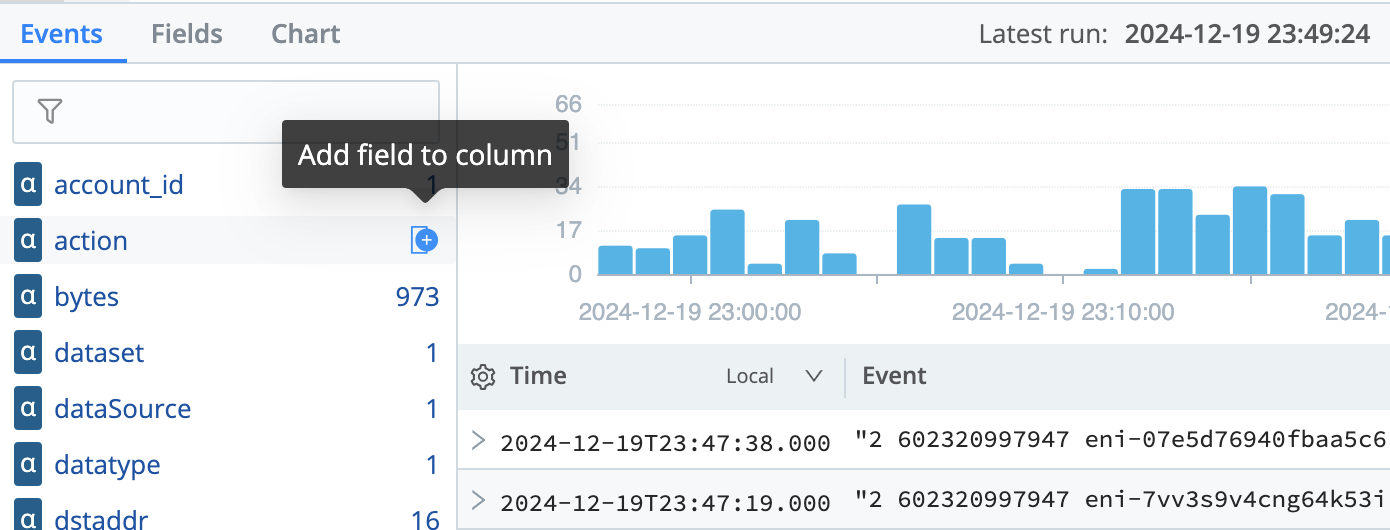
In Table view, you can hover over field names in the sidebar or heading row to display a close box. Select the x to remove their columns from the table.
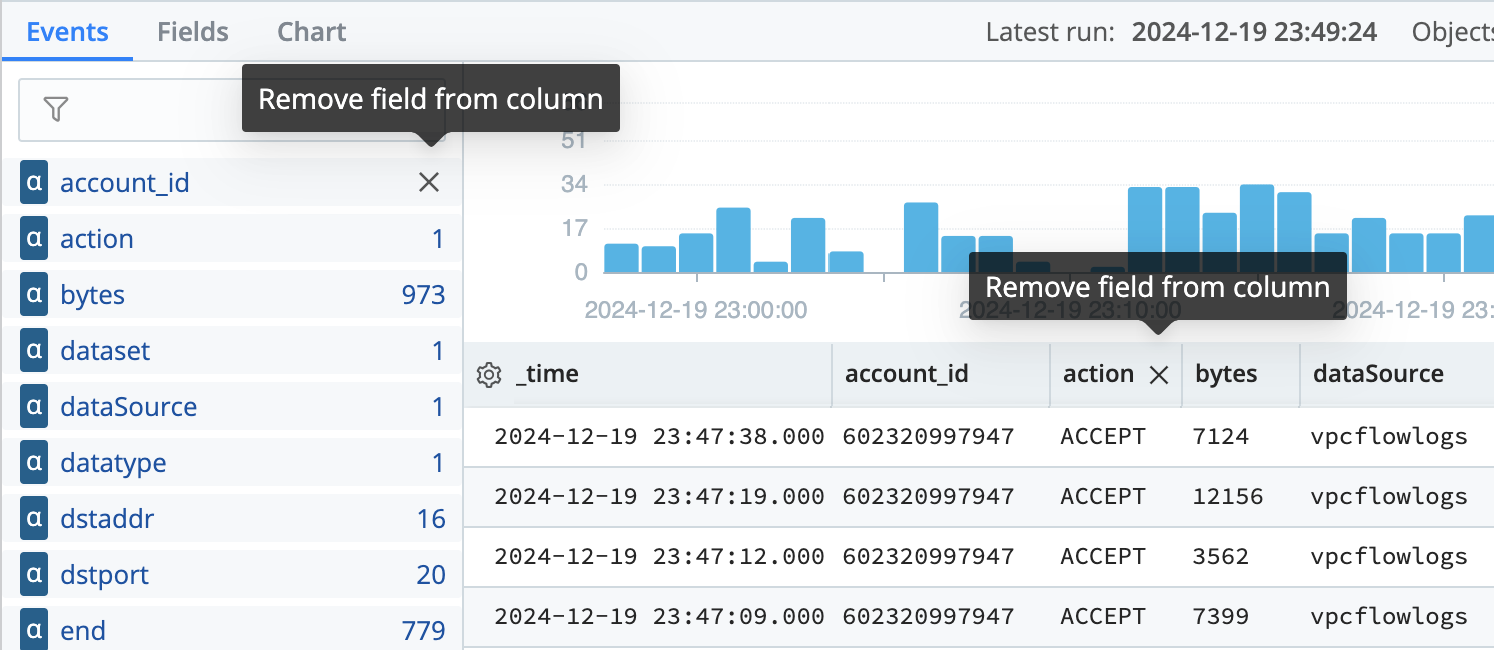
Columns that you hide using these shortcuts are not permanently hidden. They will reappear when you refresh the page or reload this search.
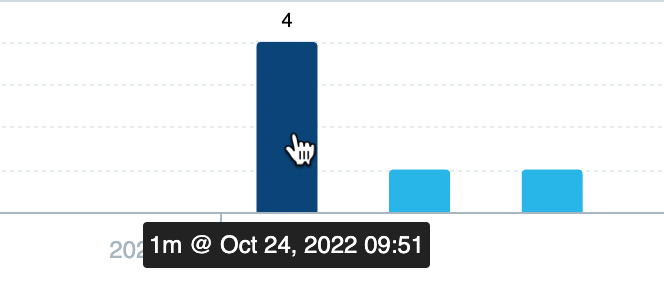
Histogram
You can select bars in the histogram to view results for only the selected times. Use shift+select to select multiple bars.
Approximate Versus Precise Events Counts
In the Events field browser’s left column, and on the Fields tab, both covered below: The displayed event counts are approximations, and are not expected to be exact. Top-N lists are generated using probabilistic analysis, and are similarly not exact. However, you can compute precise results for a given field using a query of this form:
dataset=<DatasetName> | summarize count() by <fieldName>
Field Browser
The field browser on the Events tab allows you to easily identify information about the fields returned from your search. Use the search bar to filter the returned fields. The browser gives you the data type, the unique count of values the field has, and the percentage of log events returned with the field.
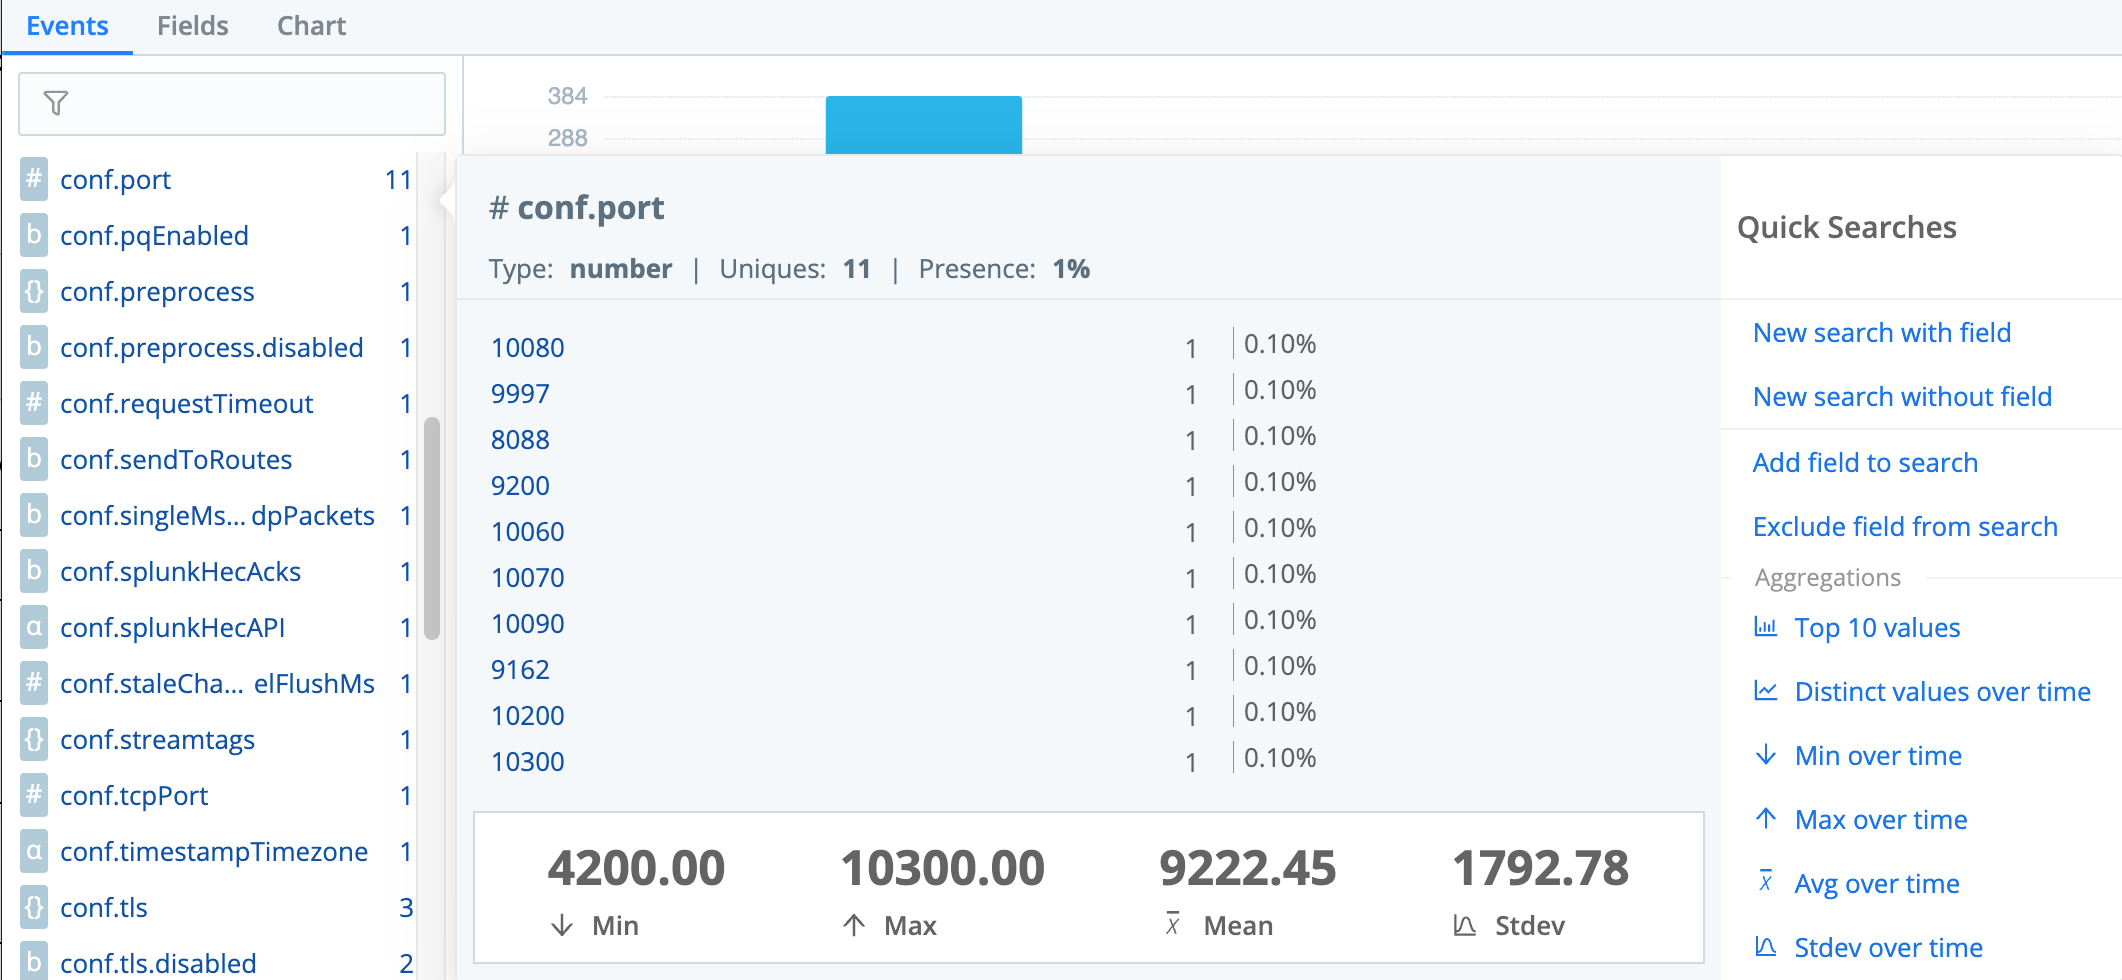
The options in the Quick Searches panel automatically generate and run a new search:
| Quick Search | Query Example |
|---|---|
| New search with field | response_time="*" |
| New search without field | response_time!="*" |
| Add field to search | dataset="cribl_search_sample" response_time="*" | limit 1000 |
| Exclude field from search | dataset="cribl_search_sample" response_time!="*" | limit 1000 |
| Top 10 values | dataset="cribl_search_sample" | limit 1000 | top-hitters 10 of response_time |
| Distinct values over time | dataset="cribl_search_sample" | limit 1000 | timestats dcount(response_time) |
| Min over time | dataset="cribl_search_sample" | limit 1000 | timestats min(response_time) |
| Max over time | dataset="cribl_search_sample" | limit 1000 | timestats max(response_time) |
| Avg over time | dataset="cribl_search_sample" | limit 1000 | timestats avg(response_time) |
| Stdev over time | dataset="cribl_search_sample" | limit 1000 | timestats stdev(response_time) |
See the Fields tab for a table of all of the returned fields.
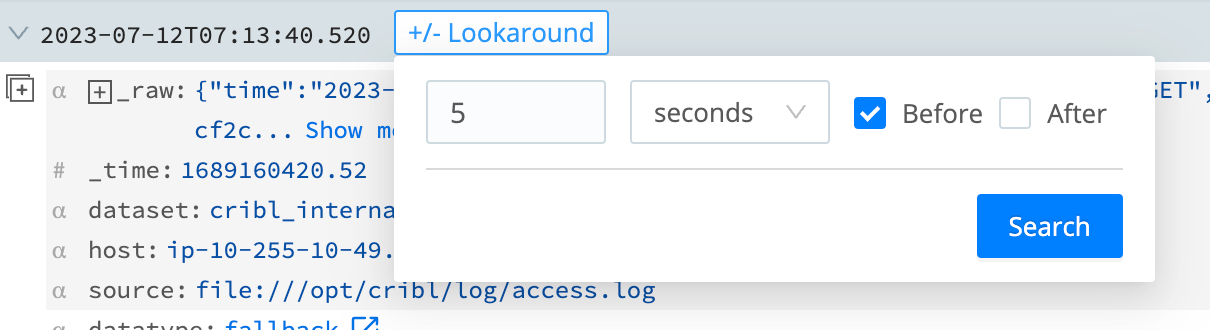
Lookaround
Lookaround allows you to filter search results by adding or subtracting seconds, minutes, hours, or days, enabling quick exploration of surrounding events.
Select an event’s Time field or expand a row and select +/- Lookaround to view the modal.
Export Search Results as NDJSON
You can export the raw results of any search in the Newline Delimited JSON (NDJSON) format.
- Run a search.
- At the bottom right of the query box, select Actions.
- Select Export results as NDJSON. The results are downloaded to your default download location.
Fields Tab
The Fields tab displays all of the returned fields on a table by the following dimensions:
- Type: Data type.
- Uniques: Number of unique values.
- Nulls: Number of
nullvalues. - Top Value Distribution: How often values occur using the standard cumulative beta distribution function.
- Presence: Percentage of results that contain the field.
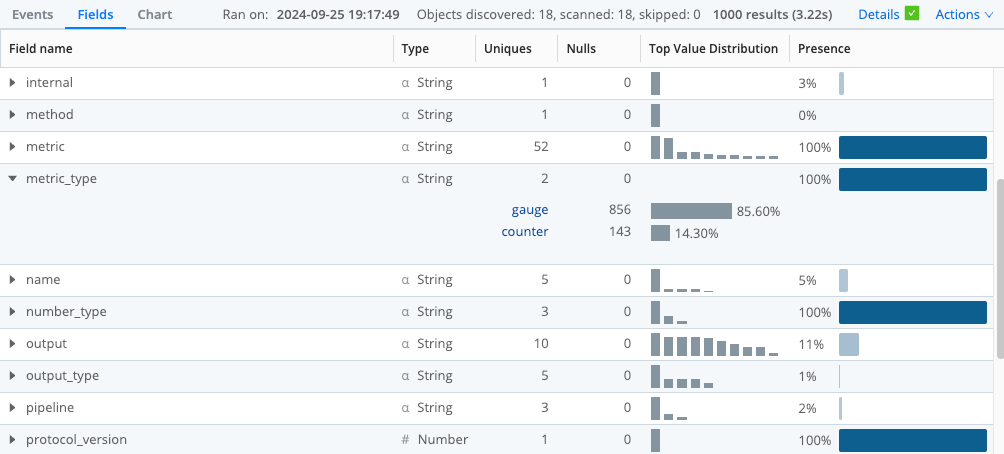
The table supports sorting and filtering, and allows you to adjust the order of columns.
- Select a column heading to change its sorting order.
- Hover over a column heading and select the funnel icon to define a filter.
- Select the triangle to the left of a Field name to expand and collapse the list of returned values.
See the note above about Approximate Versus Precise Events Counts.
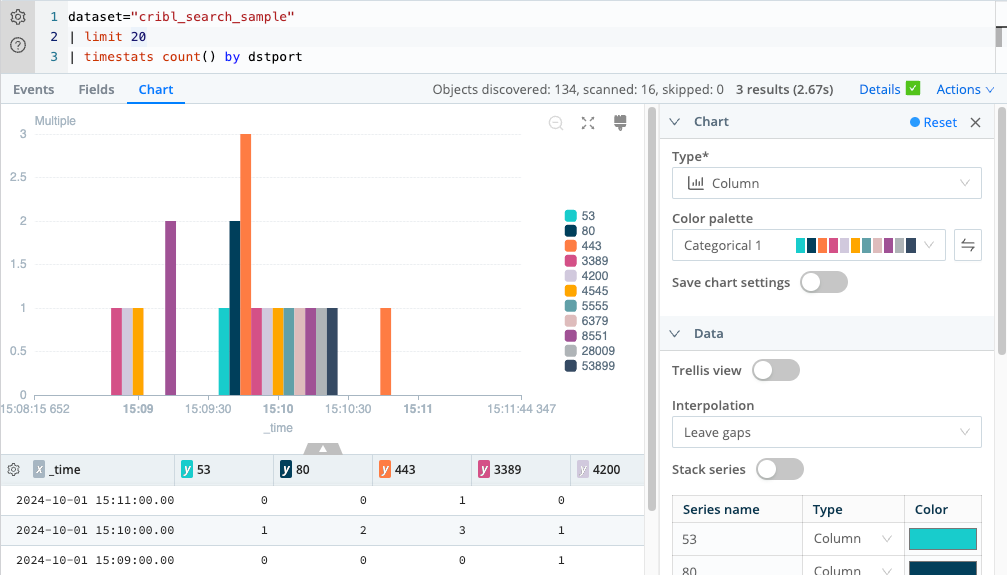
Chart Tab
When you run the summarize, eventstats, or timestats operator along with
an aggregation function, the Chart tab automatically displays your results in a Chart, along with a corresponding
results table. You can select from various Chart types and color palettes, manipulate how your results are plotted, and
customize the results table display.
To display results in the Chart tab regardless of the search’s type, append your query with
| render table.
For detailed information about manipulating data and visualizations in aggregate search results, see Charting.