


Connect Cribl Search to Prometheus
Configure Cribl Search to query your Prometheus instance.
Prometheus is a an open-source toolkit that collects and stores metrics as time-series data.
In this guide, you’ll set up a Dataset Provider and a Dataset to search data at rest in your Prometheus instance.
To search your Prometheus metrics much faster, ingest them into Cribl Search. See Ingest Prometheus Metrics into Cribl Search.
Add a Prometheus Dataset Provider
A Dataset Provider tells Cribl Search where to query and contains access credentials. Here, you will add a Prometheus Dataset Provider.
To add a new Dataset Provider, select Data, then Dataset Providers, then Add Provider.
Configure the resulting New Dataset Provider modal as follows:
- In ID, enter a unique identifier for your new Dataset Provider. You’ll reference this ID when adding
Datasets. Start the ID with a letter; the rest of the ID can use letters, numbers, and underscores (for
example,
my_dataset_provider_1). - In Description, you can add a few words to make your new Dataset Provider easy to recognize.
- Set Dataset Provider Type to Prometheus.
- In Endpoint, enter the full URL of your Prometheus API endpoint, for example:
https://prometheus.goats.biz. If you’re using Grafana, the URL may look like this:https://prometheus-foo-42-prod-us-central-0.grafana.net/api/prom. - In Concurrency limit, set the maximum number of concurrent API requests. The default is
3.
Higher values may improve performance but put more load on the target service (with the risk of being rate limited). - In Authentication type, select how Cribl Search should authenticate to your Prometheus instance.
- Basic: Select this if your Prometheus instance uses basic authentication. You’ll need to enter a username and password.
- Token: Select this if you’re using token-based authentication. You’ll need to enter a bearer token that Cribl Search will include with the authorization header.
- Select Save when finished.
Add a Prometheus Dataset
After creating a Prometheus Dataset Provider, you can add a Prometheus Dataset. Datasets tell Cribl Search what data to search from the Dataset Provider.
To add a new Dataset, select Data, then Datasets, then Add Dataset.
Configure the resulting New Dataset modal as follows:
Basic Configuration
- In ID, enter an identifier unique for both Cribl Search and Cribl Lake. You’ll reference this
ID from the query box, when searching your new Dataset. Start the ID with a letter; the rest
of the ID can use letters, numbers, and underscores (for example,
my_dataset_1). - In Description, you can add a few words to make your new Dataset easy to recognize.
- Set Dataset Provider to the ID of a Prometheus Dataset Provider.
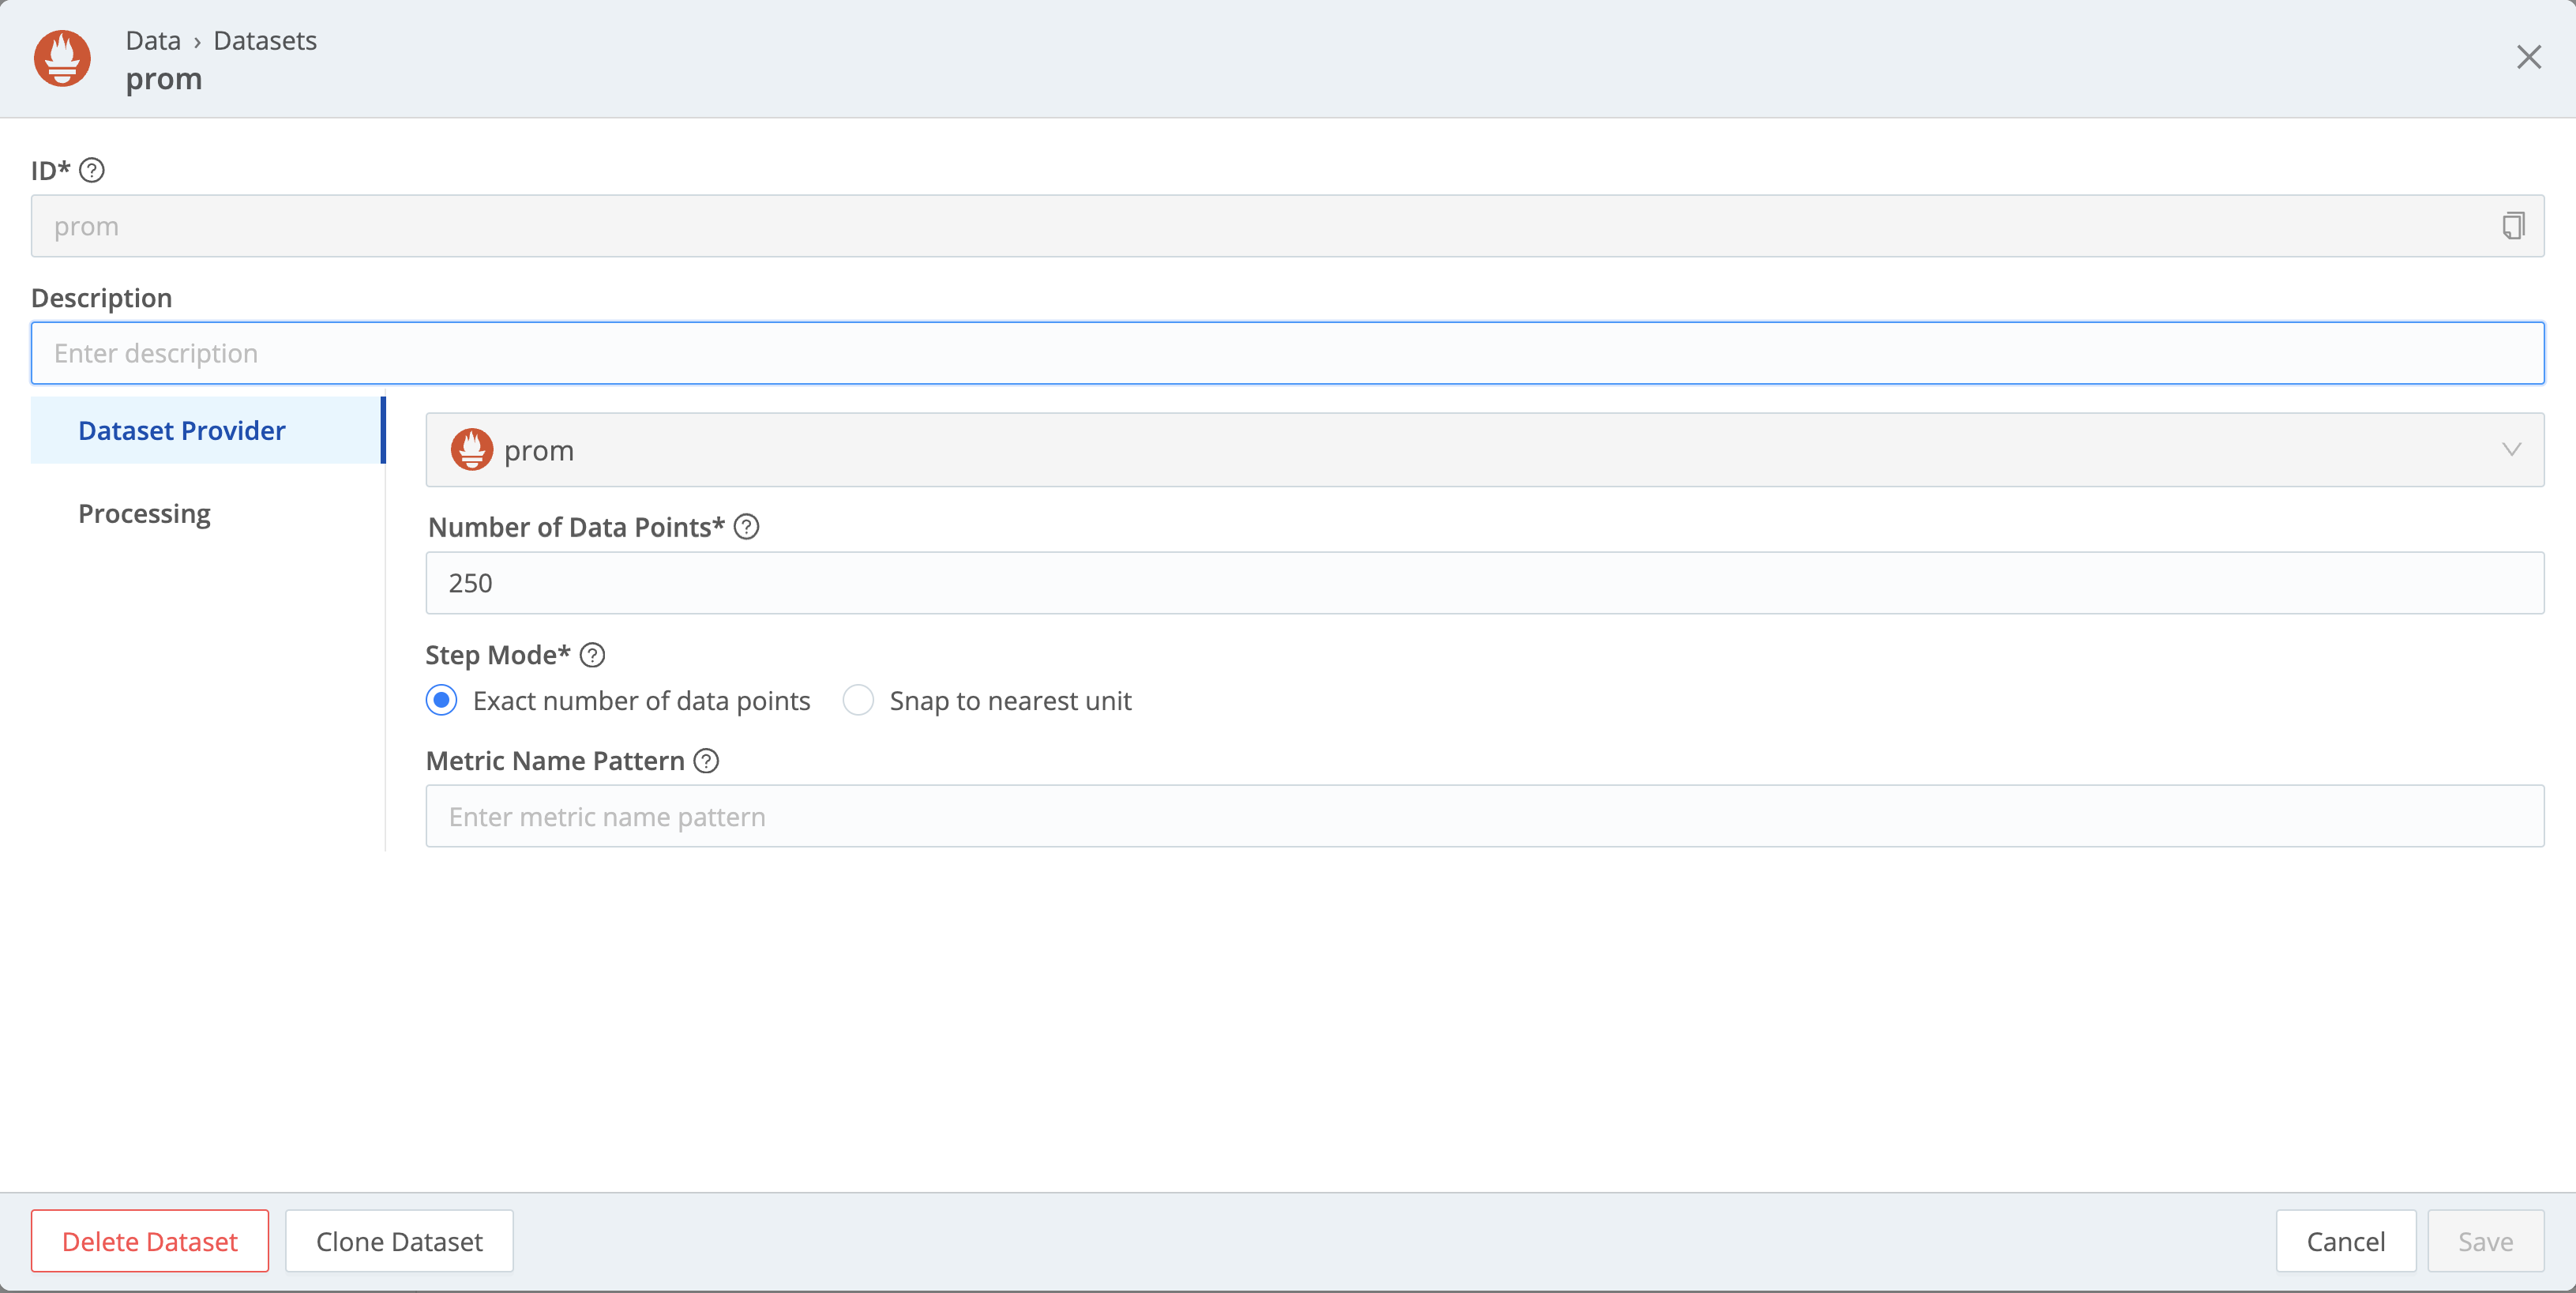
Prometheus Options
This exposes the following Prometheus-specific options:
Number of data points: How many data points you want to get each time you search this Dataset. Set this to a value between
1and11000(a limit imposed by Prometheus). The default is250.Step mode: Defines how to use the set Number of data points when calculating the interval between data points. Select one of the following:
- Exact number of data points: Adjust the interval between data points to match the exact Number of data points set above.
- Snap to nearest unit: Target the Number of data points set above, but snap the calculated interval up or
down to the nearest
Prometheus time unit. For example,
1043mswill snap to1s, and43 dayswill snap to6w.
Metric name pattern: Optionally, enter a regular expression to filter metric names. Cribl Search will include only those metrics whose names match this pattern. This filtering lets you control access to your metrics, as described below.
Select Save when finished.
Control Access to Your Prometheus Metrics
If you want a group of users to have access only to a subset of your Prometheus metrics, you can add separate Prometheus Datasets with different Metric name pattern configurations.
For example, you can add a single Dataset Provider, but two separate Datasets:
- Add a Prometheus Dataset Provider. This means both of your Prometheus Datasets can use the same authentication settings.
- Add a Prometheus Dataset (say,
prometheus_dataset_1). In the Metric name pattern field, add a regular expression that filters the names of your metrics, for example:^abc. When searching this Dataset, Cribl Search will include only those metrics whose names start withabc. - Add another Prometheus Dataset (say,
prometheus_dataset_2), with a different Metric name pattern, for example:^xyz. - Share
prometheus_dataset_1with one group of users (or a Team), andprometheus_dataset_2with another. Use the Read Only permission. - Now, one group of users can search only the
abcmetrics, and another only thexyzmetrics.
List the Contents of a Prometheus Dataset
You can quickly list all metrics accessible through a Prometheus Dataset, by using the
.show objects command. For example:
.show objects(prometheus_dataset_ID)This returns a list of metrics that your Prometheus Dataset consists of. Each metric comes with the following fields:
| Field | Description |
|---|---|
_time | The .show objects command’s execution time. It’s the same for every returned metric. |
success | Shows whether the command was successful. |
dataset | The ID of the examined Dataset. |
datasetType | The type of the examined Dataset. |
name | The name of the metric. |
Additionally, if your Prometheus instance supports the
/api/v1/targets/metadata API,
you’ll also get the following metadata fields:
| Field | Description |
|---|---|
type | The type of the metric. For example, counter. |
unit | What units the metric value conveys (usually empty). |
help | A description of the metric. |
Now, you can use the fields above to filter for specific metrics. For example, to list only gauge metrics:
.show objects(prometheus_dataset_ID)
| where type == "gauge"Search a Prometheus Dataset
After creating a Prometheus Dataset Provider and Dataset, you’re ready to start searching. See the examples just below.
Search for any metrics whose names, labels,
or label values start with node_:
dataset="prometheus_dataset_ID" node_*Search the metric named node_cpu_seconds_total for values higher than 42:
dataset="prometheus_dataset_ID" node_cpu_seconds_total > 42Filter by multiple fields, and project only the _time and cpu fields:
dataset="prometheus_dataset_ID" node_cpu_seconds_total > 42 mode=idle cpu=7
| project _time, cpuAlternatively, you can search by using the Prometheus __name__ field:
dataset="prometheus_dataset_ID" __name__=node_*You can also search by Prometheus labels alone. This allows you to search any metrics that have the given label values, for example:
dataset="prometheus_dataset_ID" mode=idle cpu=7Prometheus Results
Search results can start showing up within a second or two, but when the search completes depends on how much data there is in your Prometheus instance.
Each data point returned may include the following fields:
| Field | Description |
|---|---|
| Built-in fields | Cribl Search’s meta fields, such as _raw or _time. They’re not part of the metrics, but can be referenced in queries. |
| Metric + value | The name of the queried metric, along with its value. |
__name__ | Prometheus’s field that contains the name of the queried metric. |
step | The step value used for the Prometheus query request, which translates to the interval between data points returned. |
| Others | Any other labels that apply to this data point, which show up as event fields. |
Additionally, if your Prometheus instance supports the
/api/v1/targets/metadata API,
you’ll also get a metadata field, which contains the following:
| Field | Description |
|---|---|
type | The type of the metric. For example, counter. |
unit | What units the metric value conveys (usually empty). |
help | A description of the metric. |
Prometheus: Number of Data Points Returned
When searching a Prometheus Dataset, you can can decide how many data points you want to spread across the time range of your search.
For example, a search can produce 500 data points for a 1-hour time range, giving you 1 data point every 7.2 seconds.
To adjust this to your needs, you can:
- Set the default number of data points returned. Cribl Search will adjust the interval between data points to match this number.
- Optionally, set a specific interval between data points for a given search. Cribl Search will then adjust the number of data points returned to match the specified interval.
Prometheus: Set the Default Number of Data Points Returned
You can set the default number of data points when editing or creating your Prometheus Dataset. Enter the desired value into the Number of data points field.
With Step mode, you can tell Cribl Search how to use the set Number of data points when calculating the interval between data points.
To always get the same, exact number of data points, set Step mode to Exact number of data points. Then, if you
set the Number of data points to 250, a search will always give you 250 data points, spread across the time range
of your search. For example, searching a 60-day time range will give you exactly 250 data points, with the interval of
5.76 hours between them.
To round the interval to the nearest time unit, set Step mode to Snap to nearest unit. Then, if you set the
Number of data points to 250, and search a 60-day time range, Cribl Search will snap the 5.76-hour interval to 6
hours, and adjust the number of data points accordingly.
Prometheus: Set the Interval Between Data Points Returned (step)
Every Prometheus search can override the calculated interval between data points, by using an explicit step value. For
example:
dataset="prometheus_dataset_ID" step="30s"This will adjust the number of data points returned to match the specified interval.
The value of step must match the following pattern:
^\\d+(ms|s|m|h|d|w|y)$

// for example:
// 10s
// 5m