




Ingest Prometheus Metrics into Cribl Search
Preview Feature
Cribl is still developing this Preview feature. We don’t recommend using it in a production environment, because the feature might not be fully tested or optimized for performance, and related documentation could be incomplete.
Please continue to submit feedback through normal Cribl support channels, but assistance might be limited while the feature remains in Preview.
Collect metrics via the Prometheus Remote Write API to store them in Cribl Search for fast analysis.
Before You Begin
You’ll need:
- Cribl.Cloud Enterprise. For details, see Pricing.
- Search Editor Permission, or higher. Learn who can do what at Cribl Search Permissions.
- A Prometheus client that can reach Cribl Search over HTTP(S).
You can send metrics to this Source from a Prometheus client or from the Prometheus Destination in Cribl Stream or Cribl Edge.
To send OTLP metrics instead, use the OpenTelemetry Source. See Ingest OpenTelemetry Data into Cribl Search.
You don’t need Cribl Stream, Edge, or Lake. (Looking for the Prometheus Remote Write Source in Cribl Stream instead?)
To query your Prometheus instance without moving data into Cribl Search, see Connect Cribl Search to Prometheus.
1. Add a Lakehouse Engine
Metrics are stored on a lakehouse engine. See Lakehouse Engines in Cribl Search.
Metrics is a Preview feature. Adding metrics to a production lakehouse engine can affect its performance. Until the impact is better understood, use one of these approaches:
- On a production engine, keep the metrics volume small.
- Give metrics a dedicated engine, so their load doesn’t compete with production search. Route your metrics Source to that engine with Metric Dataset rules.
2. Review the Metrics Dataset
You don’t need to create a Dataset for your metrics. When you create an engine, Cribl Search auto-provisions a metrics
Dataset for it, named metrics for the first engine and metrics_<engine_id> for each additional one.
To review its naming, retention, and configuration, see The metrics Dataset.
3. Add a Prometheus Remote Write Source in Cribl Search
Your metrics engine ships with a built-in Prometheus Remote Write Source (in_prometheus_rw) that listens on port
10092. You can point your Prometheus client at this Source directly, or add another Prometheus Remote Write Source -
for example, to send a second data stream to a different engine.
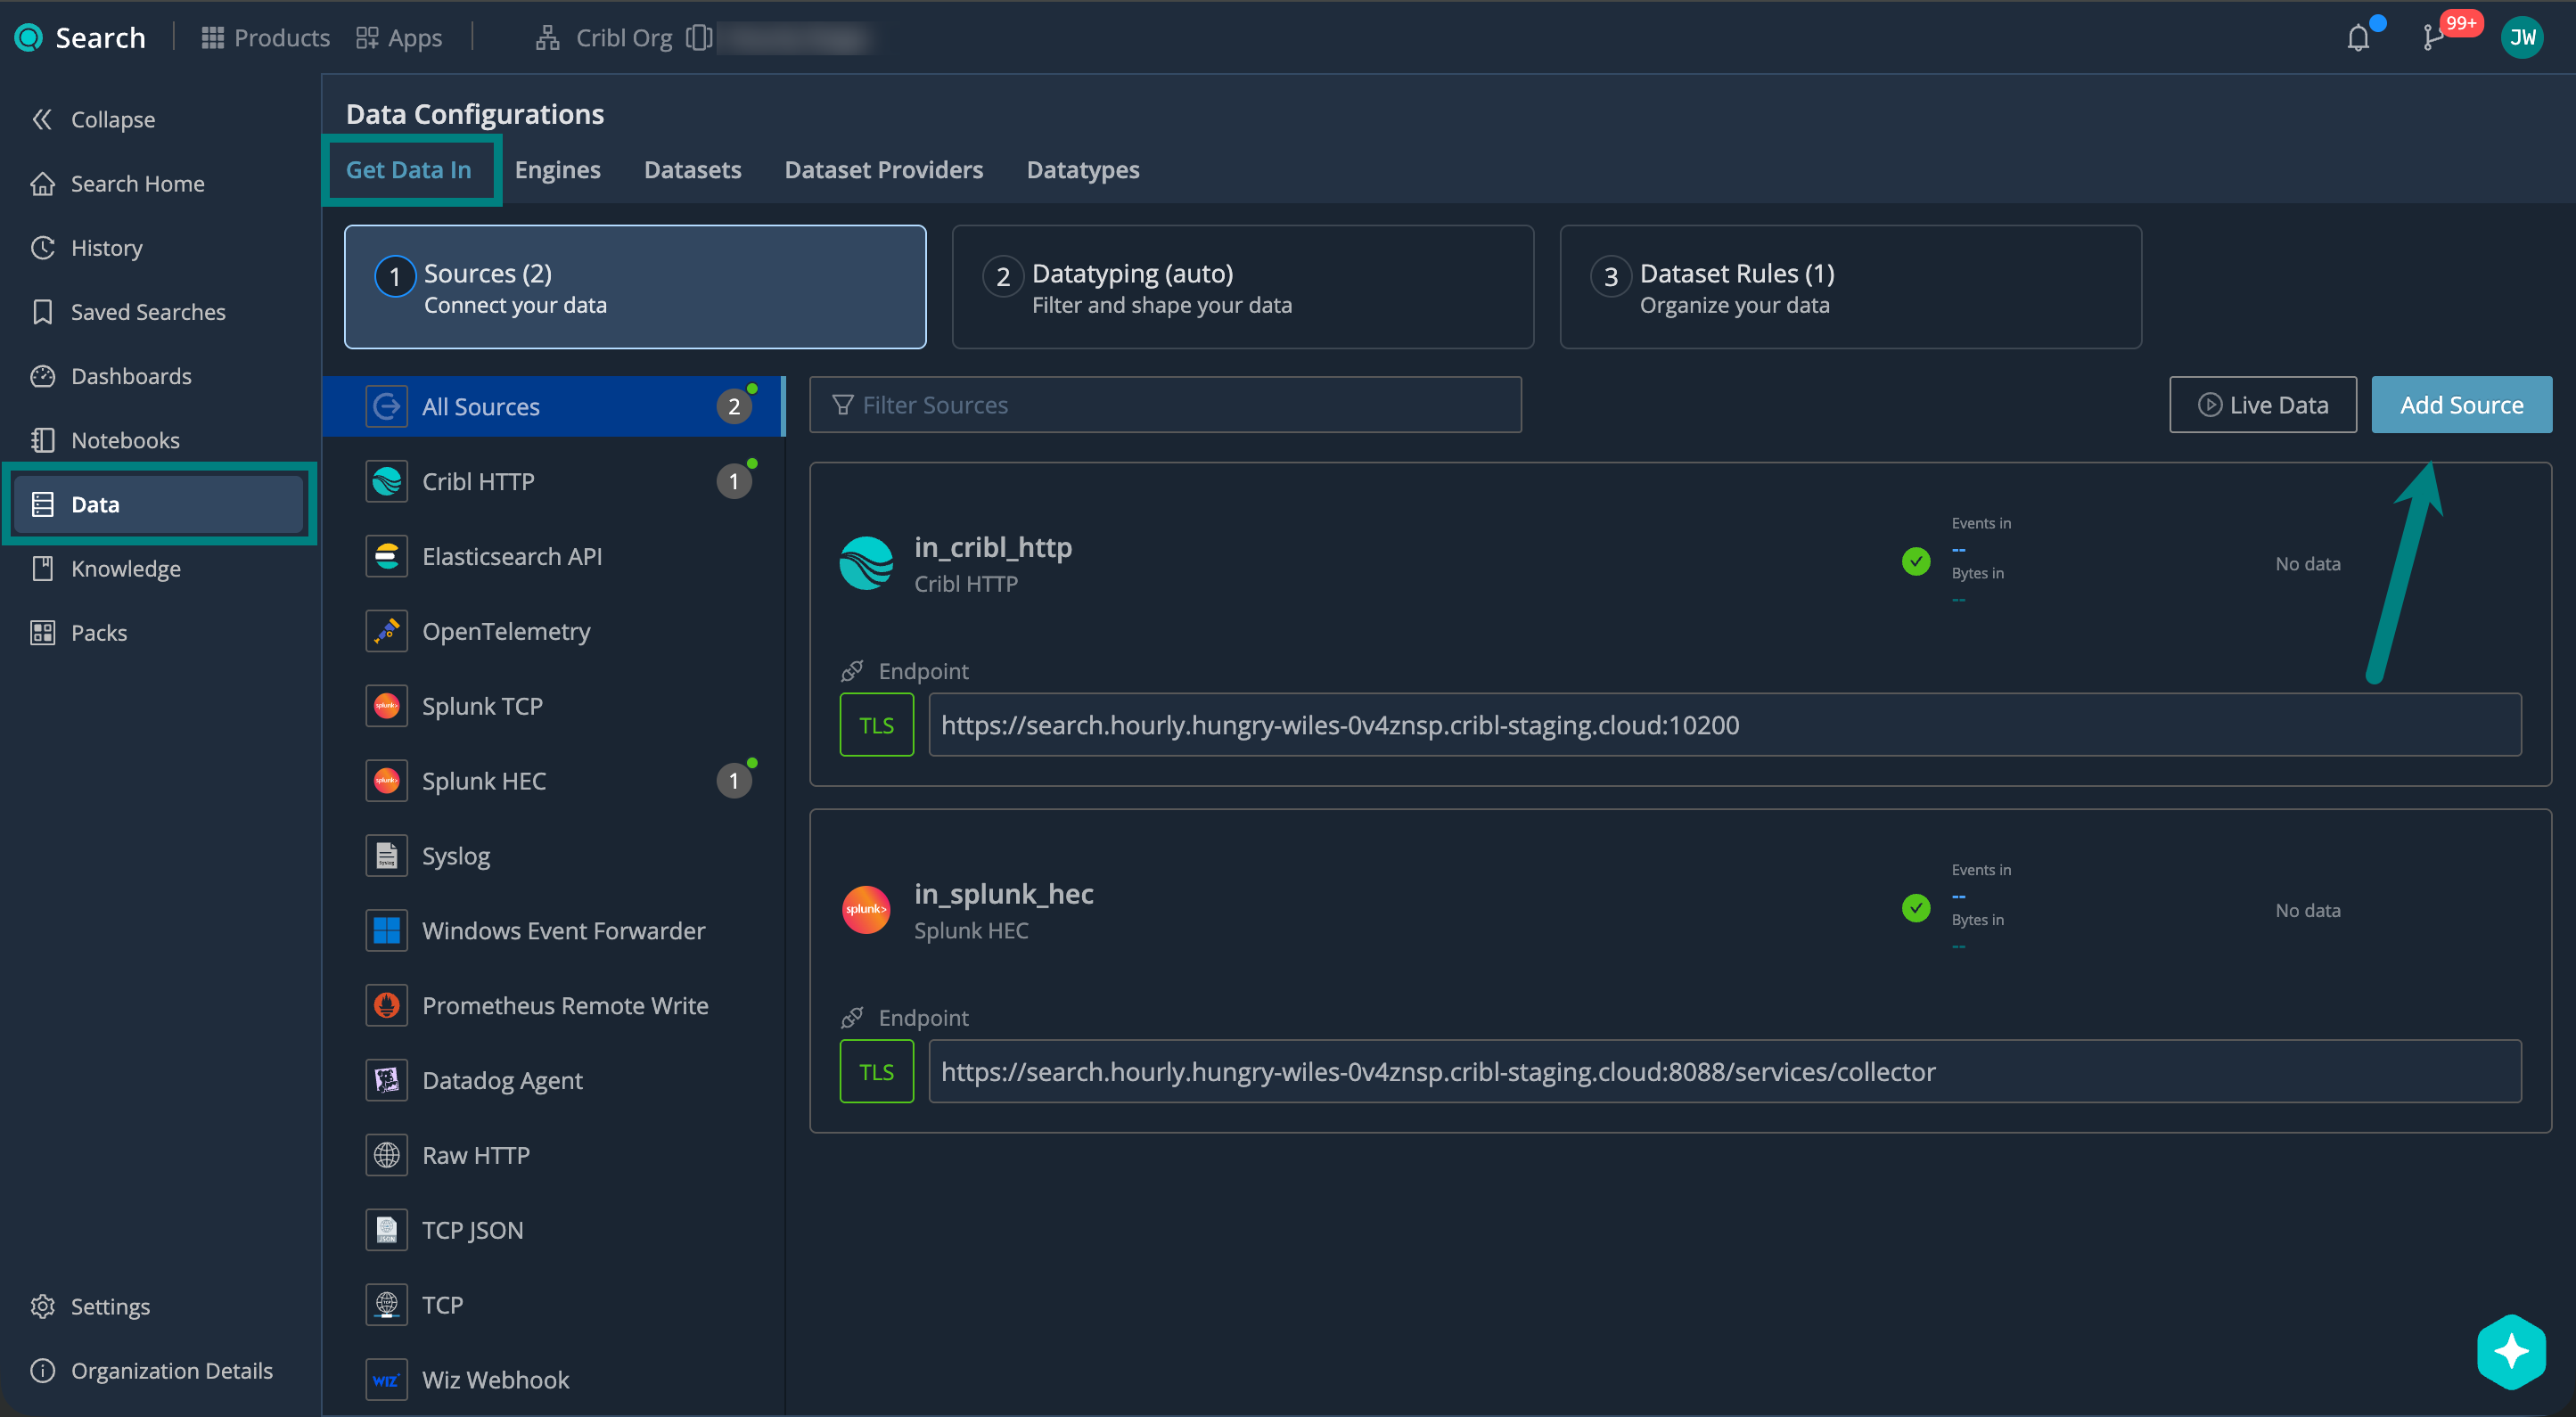
To add a Source, on the Cribl.Cloud top bar select Products > Search > Data > Add Source > Prometheus Remote Write.
Describe Your Source and Set the Endpoint
Under General, configure:
| Setting | Description | Example |
|---|---|---|
ID | Source ID, unique across your Cribl.Cloud Workspace. Use letters, numbers, underscores, hyphens. | prometheus_rw_prod |
| Description | Describe your Source so others know what it’s for. | Ingests Prometheus Remote Write metrics |
| Address | Hostname (FQDN) that your upstream sender connects to. You’ll need this to set up your upstream sender. | search.main.foo-bar-abc123.cribl.cloud |
| Port | Network port to listen on. The built-in metrics Source uses 10092. Change the default only if it conflicts with another service. | 10092 |
| Remote Write API endpoint | Base path on which to listen for Prometheus Remote Write API requests. | /api/v1/write (default) |
Set up Authentication
Use authentication to make sure only authorized senders can push data to your Cribl Search Source.
Under Authentication, select the Authentication type you want to use:
No authentication. Use only for testing or trusted internal networks.
Create a username and password. This is what your upstream sender will need to provide when sending data to your Source endpoint.
| Setting | Example |
|---|---|
| Username | prometheus_rw_user |
| Password | ******** |
Authenticate using a stored credentials secret instead of entering a username and password directly. This keeps credentials out of your Source configuration and makes them easier to rotate.
| Setting | Description | Example |
|---|---|---|
Credentials secret | Reference to a stored text secret that holds the credentials (username and password). Select a secret or Create a new one. (See Create and Manage Secrets in Cribl Stream). | sec_prometheus_rw_creds |
Create bearer tokens. This is what your upstream sender will need to provide in the authorization header.
Select
Add Token, then enter a token text or Generate a random one.
Authenticate using a stored token secret instead of entering a token text directly. This keeps tokens out of your Source configuration and makes them easier to rotate.
| Setting | Description | Example |
|---|---|---|
Token secret | Reference to a stored text secret that holds the token. Select a secret or Create a new one. (See Create and Manage Secrets in Cribl Stream). | sec_prometheus_rw_token |
Set Up Encryption
TLS encryption protects your data in transit between your upstream Prometheus client and the Cribl Search Source. The
built-in metrics Source and any new Source you add have TLS enabled by default, with TLS 1.2 as the minimum version.
Your Prometheus client must connect over https.
Under Encrypt, you can review or adjust the Minimum TLS version you want to accept:
| TLS Version | When to Use |
|---|---|
| 1.3 | Provides the strongest security. Use when your clients support it. |
| 1.2 | The default. Use for broad client compatibility. |
| Older than 1.2 | Avoid if possible. These versions are no longer considered secure. |
Select Save to create the Source.
4. Route Metrics with Metric Dataset Rules
Metric Dataset rules decide which metrics Dataset receives the metrics from this Source. By default, a single
Metrics catch-all rule (*) sends all metrics to the primary metrics Dataset. A rule for this Source matches
prometheus_rw:<your-source-id> - for example, prometheus_rw:in_prometheus_rw.
Metric Dataset rules apply to data as it arrives and aren’t retroactive, so add your rule before you start sending data. For details, see Add Metric Dataset Rules.
5. Set Up Your Prometheus Client
Configure your upstream Prometheus client, or the Prometheus Destination in Stream or Edge, to send data to your Cribl Search Source.
You’ll need these details from your Source configuration:
| Setting | Example |
|---|---|
| Address | search.main.foo-bar-abc123.cribl.cloud |
| Port | 10092 |
| Remote Write API endpoint | /api/v1/write (default) |
Example: Prometheus Remote Write > Cribl Search
Add a remote_write block to your prometheus.yml file, using the following example.
Replace the example address (search.main.foo-bar-abc123.cribl.cloud), username, password, endpoint, and port (if you
chose a different port) with your Source values.
remote_write:
  - url: "https://search.main.foo-bar-abc123.cribl.cloud:10092/api/v1/write"
    basic_auth:
      username: "your_username"
password: "********"Replace the example address (search.main.foo-bar-abc123.cribl.cloud), token, endpoint, and port (if you changed the
default 10092) with your Source values.
remote_write:
  - url: "https://search.main.foo-bar-abc123.cribl.cloud:10092/api/v1/write"
bearer_token: "420"Send Metrics from Cribl Stream or Edge
Use the Prometheus Destination to send metric events from Stream or Edge to this Source:
In a Pipeline, produce metric events that contain a nonempty
__criblMetricsarray. For example, use the Publish Metrics Function.For Remote Write URL, enter the complete URL for your Search Source. Combine the Address, Port, and Remote Write API endpoint values. For example:
https://search.main.foo-bar-abc123.cribl.cloud:10092/api/v1/writeConfigure the Destination authentication to match the Search Source authentication.
Select Save, then Commit & Deploy.
The Prometheus Destination sends events that contain __criblMetrics and drops other events.
6. Start Sending Data and Verify
Start sending events from your upstream Prometheus client, and verify that they’re successfully flowing into Cribl Search.
On the Cribl.Cloud top bar, select Products > Search > Data > Live Data.
Here, check for your Prometheus Remote Write Source. For details, see Live Data.
Read Metrics from External Tools
Each metrics Dataset exposes a Prometheus-compatible query endpoint that Prometheus-compatible tools such as Grafana
can read from. The endpoint has this form:
https://<cribl-host>/api/v1/products/lakehouse_engine_metrics/engines/<engine>/datasets/<dataset>/prom/Find this endpoint, labeled Prometheus compatible endpoint, in the metrics Dataset configuration. Control access
to it with the Dataset’s Query API Access authentication, which can be None or Basic (username and password).
Cribl strongly recommends setting Query API Access to Basic and configuring a username and password to lock down this endpoint. If you leave it set to None, the endpoint is completely open - anyone who can reach it can read your metrics, even if you never connect Grafana or another tool. Always set up Basic authentication to prevent unauthorized access.
Next Steps
Now that your metrics are in Cribl Search, you can start using them. For example: