


Write Your First Query
Write simple queries in Kusto Query Language, using operators such as limit, project, where,
count, order, and others.
Cribl Search is based on Kusto Query Language (KQL), which lets you delve into your data to discover patterns, identify anomalies and outliers, and create statistical models.
To generate queries from natural language, try the Cribl Copilot KQL assistant.
Example Scenario
Imagine you’re a security operations analyst working for a company that relies heavily on cloud infrastructure. You want to analyze a Dataset containing virtual private cloud (VPC) flow logs for insight into network traffic patterns, potential security threats, and resource utilization in different regions.
What You’ll Learn
You’ll write simple queries in KQL to analyze a sample Dataset of VPC flow logs. You’ll learn how to:
- Understand the structure of a Cribl Search query.
- Return a specific number of rows by using the
limitoperator. - Extract information from the
_rawfield using theextractoperator and Parser. - Filter data by using the
whereoperator. - Calculate available events by using the
countoperator.
Your Learning Goals
By the end of this tutorial, you’ll be able to write a query with the most commonly used operators in KQL to analyze VPC flow logs, understand network traffic patterns, and identify potential security threats within your cloud infrastructure.
The Structure of a Cribl Search Query
Organizations across various sectors process vast amounts of data and aim to extract valuable insight from it. In the VPC flow logs example, you have a Dataset with network traffic data from your organization’s cloud infrastructure. This tutorial will guide you through the fundamental structure of the Kusto Query Language to analyze and interpret the Dataset.
What’s a Cribl Search Query?
A Cribl Search query is a read-only request expressed in plain text that processes data and returns results in a tabular or graphical format. It consists of one or more query statements. The predominant type of query statement is a tabular expression statement.
What’s a Tabular Statement?
In a tabular expression statement, both input and output consist of tables or tabular Datasets.
Tabular statements hold zero or more operators, each beginning with tabular input and yielding tabular output. Operators are connected by a pipe (|), allowing data to flow from one operator to the next for filtering or manipulation. This sequential piping of information makes the query’s operator order crucial.
Think of it like a funnel, where you start with a full data table. The data is filtered, rearranged, or summarized as it passes through each operator. At the end of the funnel, you obtain a refined output.
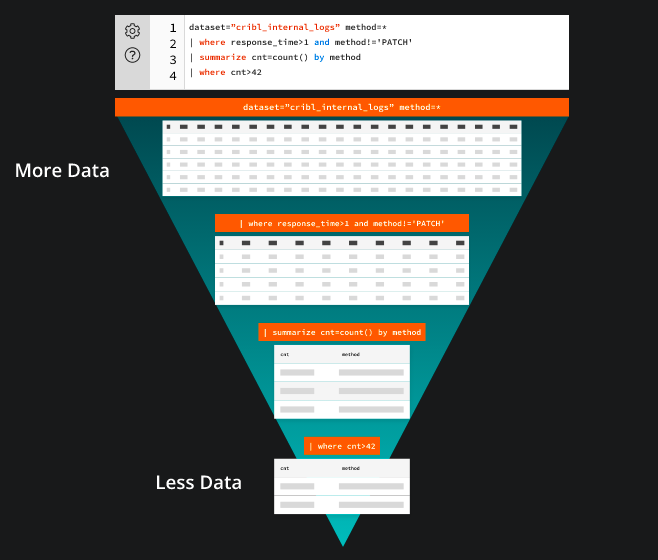
Here’s an example query:
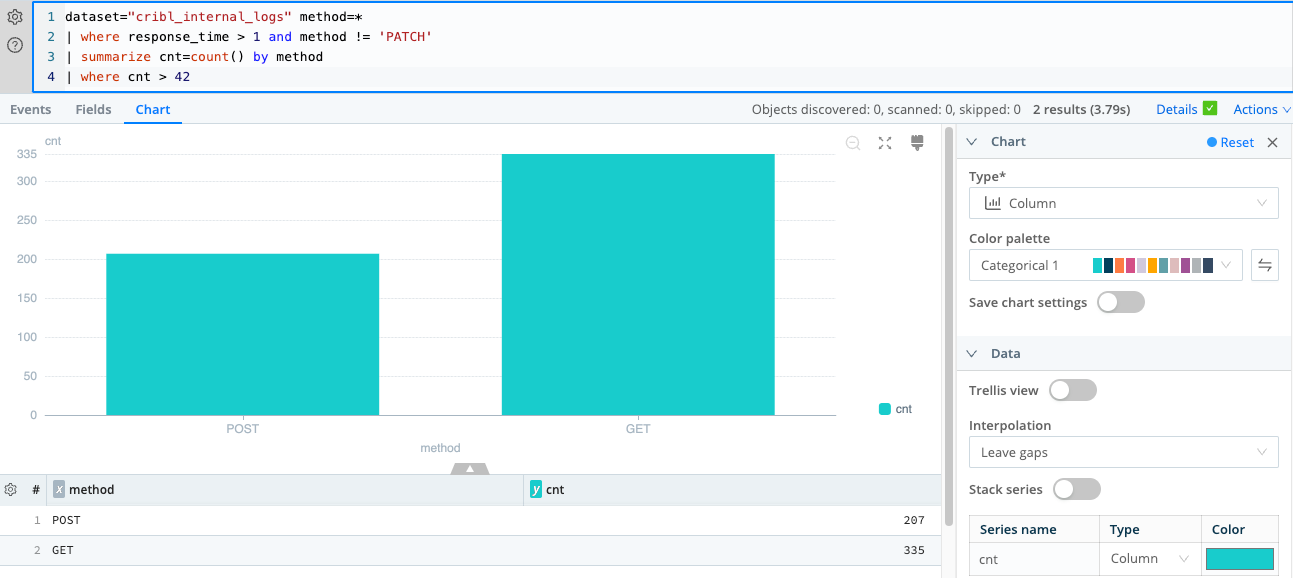
dataset="cribl_internal_logs" method=*
| where response_time > 1 and method != 'PATCH'
| summarize cnt=count() by method
| where cnt > 42This query contains a single tabular expression statement that references a Dataset called “cribl_internal_logs” and filters the data based on the method column. The data rows are filtered by the response_time column’s value and exclude rows with the method “PATCH”. The query then summarizes the count of rows for each method and filters the results to only display methods with a count greater than 42.
Return a Specific Number of Rows by Using the limit Operator
You can use a Cribl Search query to explore Datasets and gain insights. In this scenario, you have an unfamiliar Dataset of VPC flow logs called “cribl_search_sample” that ships out of the box with Cribl Search. You want to explore what you can learn from this data.
In this task, you’ll examine the structure of the data to understand the kinds of questions you can ask about these network flows.
Write Your First Query
This query returns a small subset of the data to help you familiarize yourself with the columns and types of data in the table.
The limit operator is perfect for this task, as it returns a specific number of arbitrary rows.
- Copy this query to your clipboard:
dataset="cribl_search_sample" | limit 100 - Paste the query into the search box.
Tip: You can autoformat the query text. - Notice that the query begins with a reference to the data table,
cribl_search_sample. This data is piped into the first and only operator, which then selects 100 arbitrary rows. - Run the query by selecting Search or pressing Enter.
- Review the results. The sample Dataset includes various data columns such as
_raw,source,host,dataSource, anddatatype.
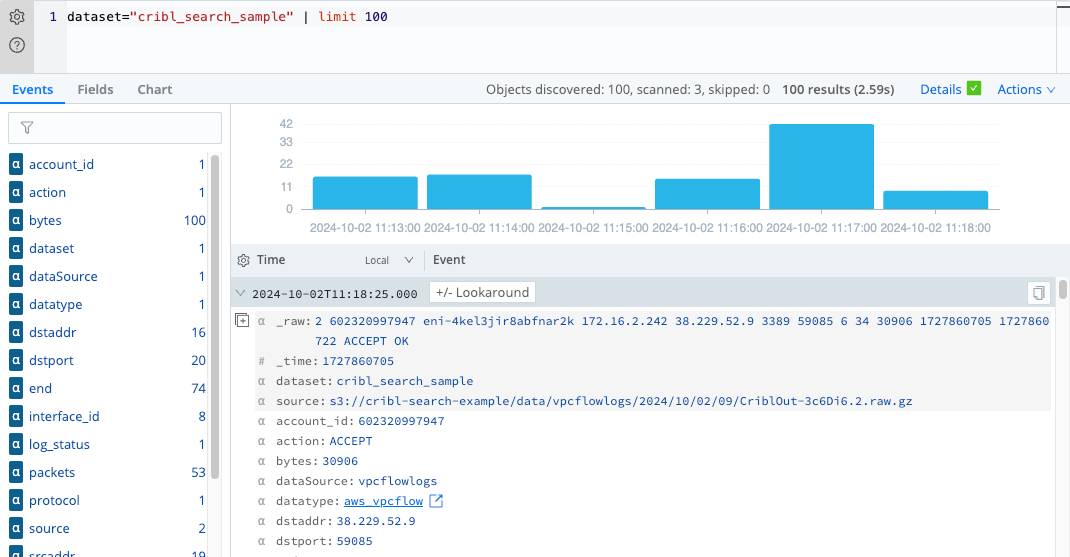
limit operatorExtract Information from the _raw Field by Using the extract Operator and Parser
Notice in the previous example that the useful information in the _raw field is unparsed. To analyze the data
effectively, you need to extract and parse the information into separate fields.
Write a Query to Parse the _raw Field
To parse the data, you can use the extract operator along with the appropriate Parser (in this
case, AWS VPC Flow Logs).
- Copy this query to your clipboard:
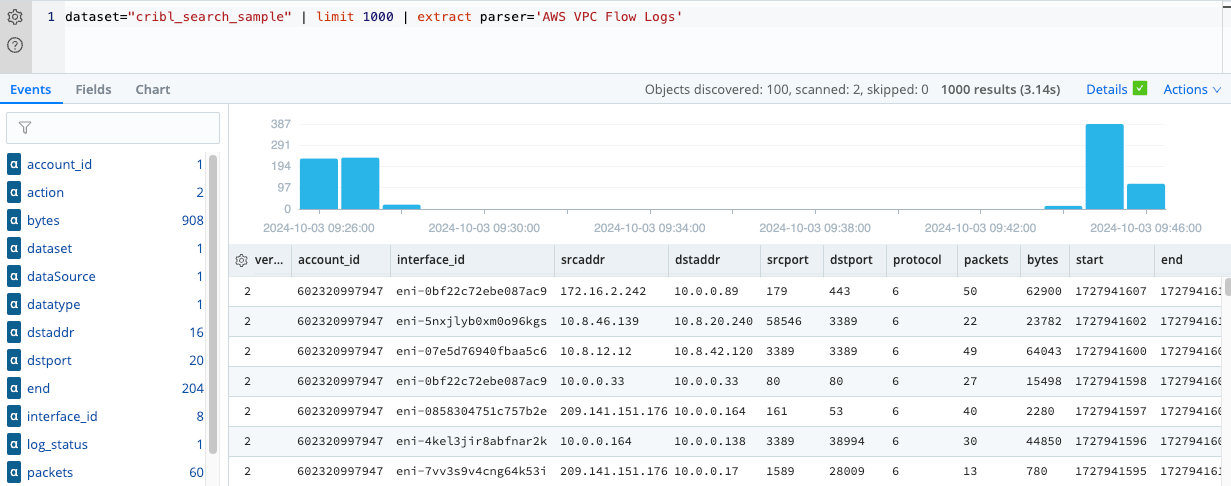
dataset="cribl_search_sample" | limit 1000 | extract parser='AWS VPC Flow Logs' - Paste the query into the search box and select Search or press Enter.
- Check that your parsed results are similar to the following example. The actual data in the rows might differ because
the rows are selected arbitrarily. The parsed results should now contain separate fields for each data point in the
_rawfield.
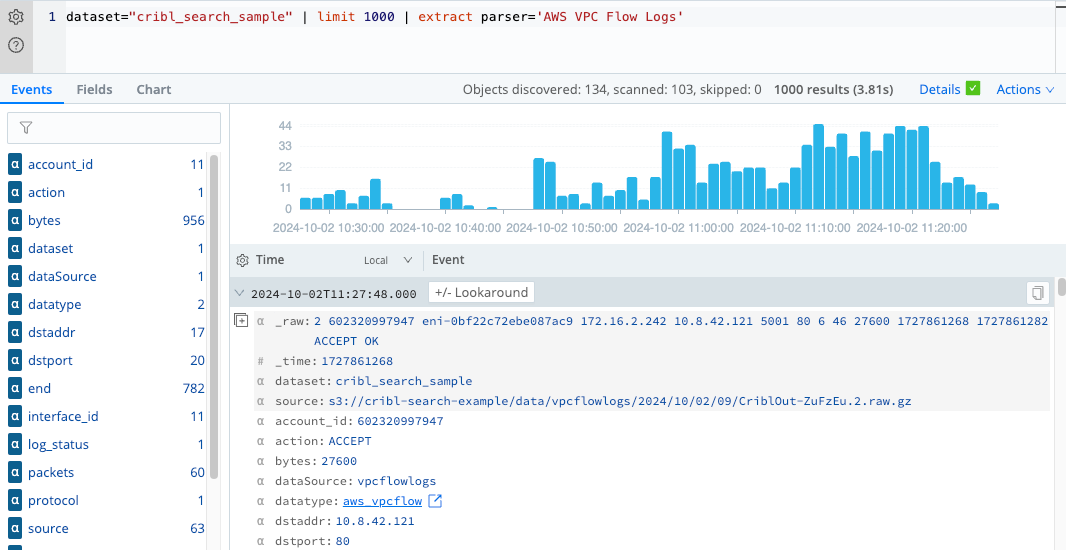
Now that the data is parsed and organized into separate fields, you can perform further analysis and create more advanced queries to gain insight into the VPC flow logs.
Filter Data by Using the where Operator
In the previous sections, you learned how to extract and parse information from the VPC flow logs Dataset. Now let’s
explore how to filter the data using the where operator to answer specific questions about the VPC flow logs.
Use the where Operator
All the operators you’ve used so far have returned selected columns. Now let’s take a look at specific rows of the data.
The where operator filters results that satisfy a certain condition. In this first example, you’ll compare an
integer column to a minimum value by using the numerical operator greater-than (>). Specifically, you want to see only
flows that have a certain number of packets. So you’ll look at rows of data where the number of packets is greater than
a given threshold.
Run the following query:
dataset="cribl_search_sample"
| extract parser='AWS VPC Flow Logs'
| where packets > 5
| project _time, srcaddr, dstaddr, packets
| take 10The extract parser line is superfluous, because Cribl Search applies the parser automatically, but it’s included for illustration.
Notice that all rows returned have packet values greater than 5.
Similarly, you can filter for flow events that have a start time that’s more recent than a certain time. For example,
run the following query, where earliest=-30m means last 30 minutes:
dataset="cribl_search_sample" earliest=-30m
| extract parser='AWS VPC Flow Logs'
| where packets > 5
| summarize count() by srcaddr, dstaddr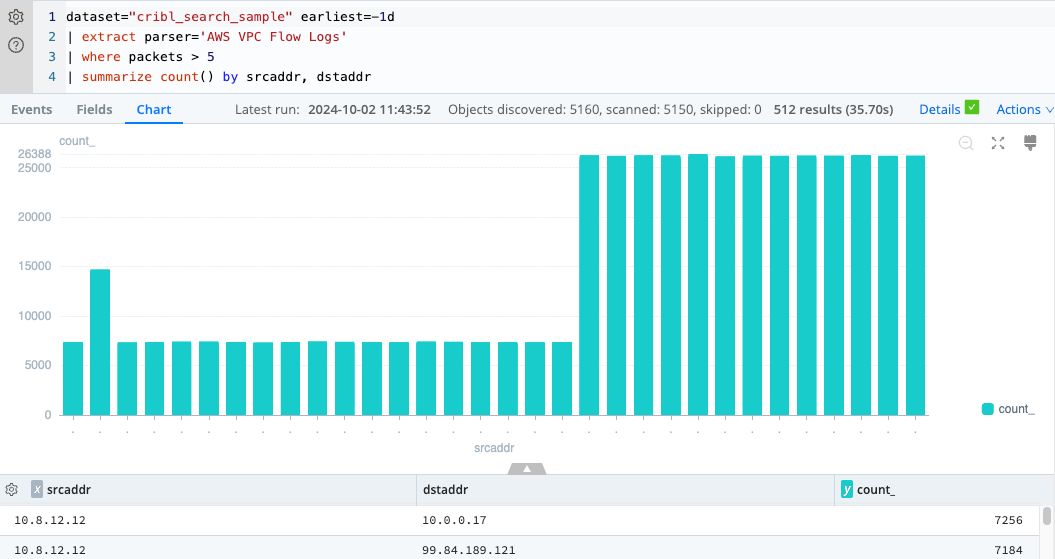
Filter by Using a String Value
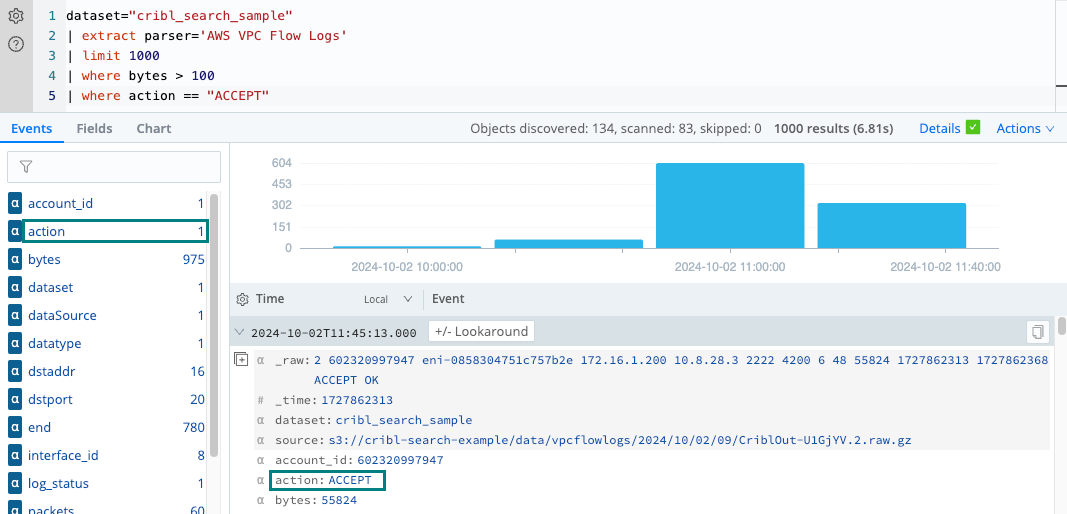
Let’s narrow down the flows to those that were accepted. Run the following query, which uses a second where
operator with the string value “ACCEPT”:
dataset="cribl_search_sample" bytes > 100 and action = "ACCEPT"
| limit 1000Notice that all records returned from this query have the action “ACCEPT” and bytes greater than 100.
Filter by Using the has Operator
You can search for specific strings in the flow log data by using the has operator. The has operator
is a case-insensitive search that matches a full term.
For example, let’s filter the VPC flow logs by a specific interface ID:
dataset="cribl_search_sample"
| extract parser='AWS VPC Flow Logs'
| where packets > 5
| where interface_id has "eni-07e5d76940fbaa5c6"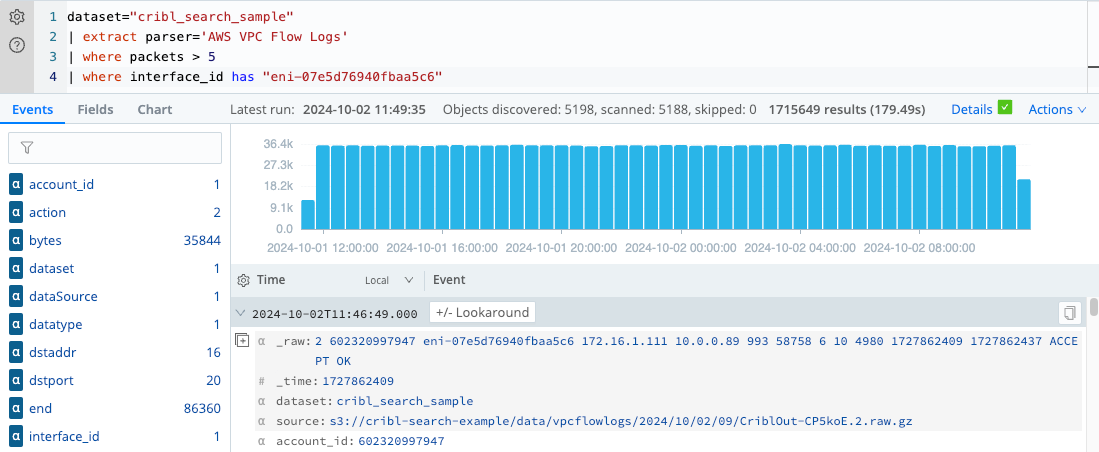
Filter on Time Range Values
Let’s look more closely at the flows within a specific time range. Because time ranges are bounded by two extremes, it’s most efficient to limit your query to events within these two times.
To construct a date range, use earliest and latest at the top level, with the following syntax:
[+|-]#TimeUnit[@SnapToTimeUnit]
Let’s incorporate the time range into a kind of query you’ve already seen. Run the following query:
dataset="cribl_search_sample" earliest=-35m latest=-5m
| limit 1000
| extract parser='AWS VPC Flow Logs'
| where bytes > 100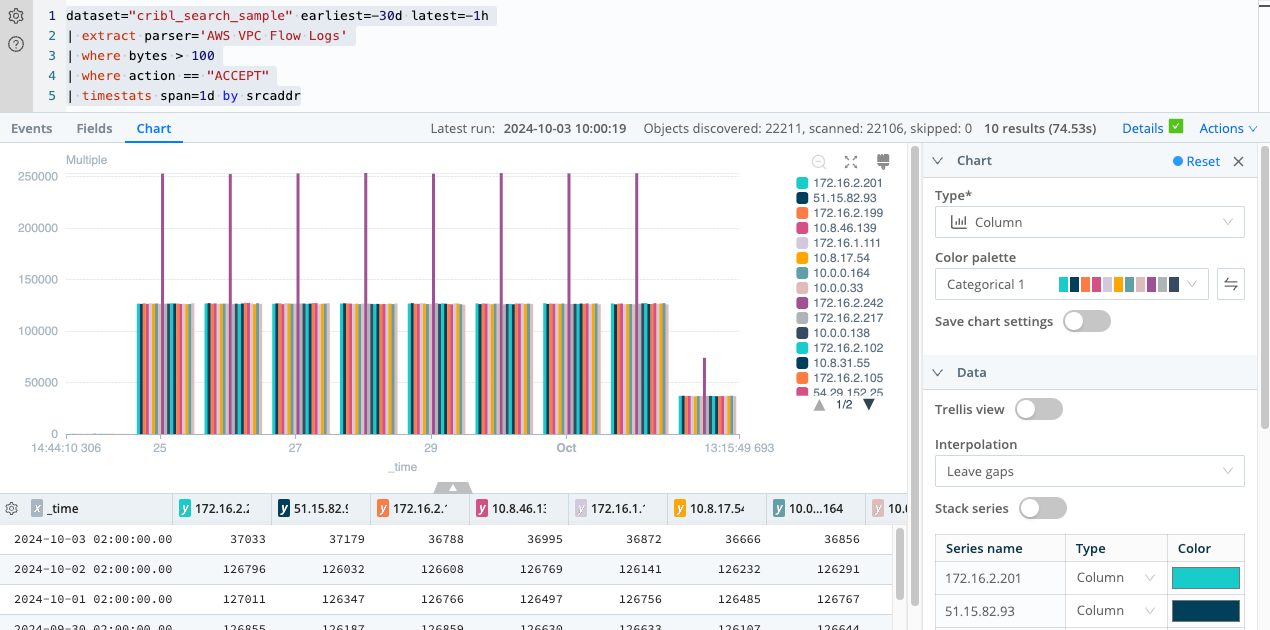
In this query, you filter the events in the Dataset by a specific time range, from 35 minutes ago to 5 minutes ago, using the
earliest and latest operators. You then extract and parse the data using the AWS VPC Flow Logs Parser. To focus on
flows with more than 100 bytes and action “ACCEPT”, use the where operator with the respective conditions.
Finally, you use the timestats operator to aggregate the data using a daily time span (span=1d) and
group the results by srcaddr.
The query will return results that show the aggregated statistics of VPC flows with action “ACCEPT” and bytes greater
than 100 for each srcaddr, separated by day, during the specified time period.
Calculate Available Events by Using the count Operator
Now that you’ve refined your query using helpful operators, such as the limit operator that returns a
specified number of events, suppose you want to determine the total number of events available within a specific
Dataset.
In this case, you can use the count operator. For example, say you want to count VPC flow events
where bytes are greater than 100 after extracting the logs using the AWS VPC Flow Logs parser.
To do this, run this query:
dataset="cribl_search_sample"
| limit 1000
| where bytes > 100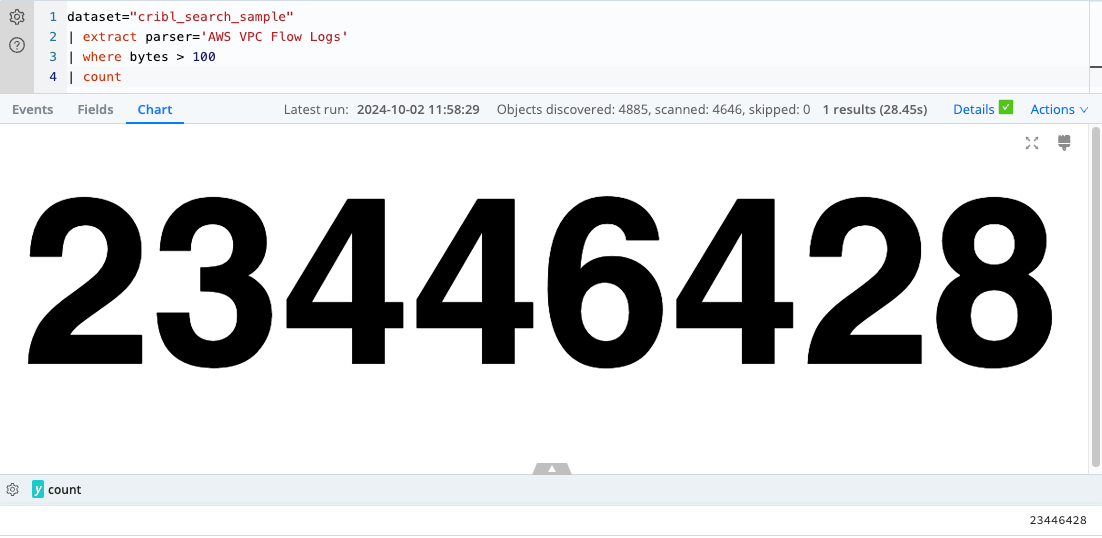
In this example, you first use the extract operator to parse the data in the cribl_search_sample
Dataset using the AWS VPC Flow Logs Parser. Next, filter the extracted VPC flow logs for flows with bytes greater
than 100. Finally, use the count operator to calculate the total number of events that meet this
criterion.
The query will return a single record containing the count of VPC flow events with bytes greater than 100.
Summary
Throughout this tutorial, you’ve explored various aspects of Cribl Search queries and their application to the analysis of VPC flow logs. Here’s a recap of what you’ve learned:
Return a specific number of rows by using the
limitoperatorYou learned how to get a sample of rows from the Dataset using the
limitoperator, which provided quick insight into the structure of the data.Extract information from the
_rawfield by using the extract operator and ParserYou extracted and parsed information from the
_rawfield by applying theextractoperator along with theAWS VPC Flow LogsParser.Filter data by using the
whereoperatorYou explored how to filter the data using the
whereoperator to answer specific questions about the VPC flow logs, such as filtering based on certain conditions, string values, or time ranges.Calculate the number of events by using the
countoperatorYou learned how to use the
countoperator to find the total number of input events in a Dataset that satisfy specific conditions, allowing you to get a quick overview of the data that met your filtering criteria.
By mastering these operators and techniques, you can effectively analyze and gain insights from the VPC flow logs Dataset. Armed with this knowledge, you can perform more advanced data analysis, create more complex queries to answer specific questions, and better understand the behavior and trends within your network flows.