


These docs are for Cribl Stream 4.0 and are no longer actively maintained.
See the latest version (4.17).
Getting Started Guide
This guide walks you through planning, (optionally) installing, and configuring a basic deployment of Cribl Stream. You’ll capture some realistic sample log data, and then use Cribl Stream’s built-in Functions to redact, parse, refine, and shrink the data.
By the end of this guide, you’ll have assembled all of Cribl Stream’s basic building blocks: a Source, Route, Pipeline, several Functions, and a Destination. You can complete this tutorial using Cribl Stream’s included sample data, without connections to - or licenses on - any inbound or outbound services.
Assuming a cold start (from first-time setup of a Cribl.Cloud or self-hosted instance), this guide might take about an hour. But you can work through it in chunks, and Cribl Stream will persist your work between sessions.
If you’ve already launched a Cribl Stream instance (either Cloud or self-hosted), skip ahead to Get Data Flowing.
Once you’ve mastered all the techniques in this tutorial, check out its Distributed Quick Start successor.
Cloud or Self-Hosted?
To quote Robert Frost and Robert Plant (of Led Zeppelin), there are two paths that you can go by:
Do this tutorial with a free Cribl.Cloud instance, hosted by Cribl. Follow the registration instructions in the section just below. This skips you past all the requirements and installation sections below - you’ll have nothing to install or host. Because Cribl.Cloud always runs in distributed mode, this will require a few extra clicks (all clearly labeled) later in the tutorial’s body. But it will give you immediate experience with Cribl Stream’s typical production mode.
Do this tutorial by downloading and installing Cribl Stream software on your own hardware or virtual machine. Follow the Requirements and Download and Install instructions below. You’ll need to provide your own infrastructure. But if you’re planning to use self-hosted/on-prem Cribl Stream in production, this will walk you through its realistic setup.
To fully experience a real-world, self-hosted production setup, you can switch your Cribl Stream installation to distributed mode. And then chase this tutorial with our Distributed Quick Start, which fully exercises distributed mode’s multiple Workers and Worker Groups.
Quick Start with a Cloud Instance
As indicated just above, you can skip installing Cribl Stream software - and skip this tutorial’s next several sections - by registering a free Cribl.Cloud instance. Cribl will quickly spin up a fully functioning copy of Cribl Stream for you, and manage it on your behalf. To use this fastest option:
- In the Cribl.Cloud Launch Guide, follow the four steps listed in Registering a Cribl.Cloud Portal.
- In the same Cribl.Cloud Launch Guide, jump ahead to follow the four steps listed in Managing Cribl.Cloud.
- That’s it! Come right back to this tutorial, and skip ahead to Get Data Flowing.
Really, skip all the other sections of the linked Cloud Guide, and all this tutorial’s sections between here and Get Data Flowing. We told you this was a quick start!
Requirements for Self-Hosted Cribl Stream
The minimum requirements for running this tutorial are the same as for a Cribl Stream production single-instance deployment.
OS (Intel Processors)
- Linux 64-bit kernel >= 3.10 and glibc >= 2.17
- Examples: Ubuntu 16.04, Debian 9, RHEL 7, CentOS 7, SUSE Linux Enterprise Server 12+, Amazon Linux 2014.03+
OS (ARM64 Processors)
- Linux 64-bit
- Tested so far on Ubuntu (14.04, 16.04, 18.04, and 20.04), CentOS 7.9, and Amazon Linux 2
System
- +4 physical cores, +8GB RAM - all beyond your basic OS/VM requirements
- 5GB free disk space (more if persistent queuing is enabled)
We assume that 1 physical core is equivalent to 2 virtual/hyperthreaded CPUs (vCPUs) on Intel/Xeon or AMD processors; and to 1 (higher-throughput) vCPU on Graviton2/ARM64 processors.
Browser Support
- Firefox 65+, Chrome 70+, Safari 12+, Microsoft Edge
Network Ports
By default, Cribl Stream listens on the following ports:
| Component | Default Port |
|---|---|
| UI default | 9000 |
| HTTP Inbound, default | 10080 |
| User options | + Other data ports as required. |
You can override these defaults as needed.
Plan for Production
For higher processing volumes, users typically enable Cribl Stream’s Distributed Deployment option. While beyond the scope of this tutorial, that option has a few additional requirements, which we list here for planning purposes:
- Port
4200must be available on the Leader Node for Workers’ communications. - Git (1.8.3.1 or higher) must be installed on the Leader Node, to manage configuration changes.
See Sizing and Scaling for further details about configuring Cribl Stream to handle large data streams.
Download and Install Cribl Stream
To avoid permissions errors, you should both install and run (next section) Cribl Stream as the same Linux user. For details on creating a new user (addressing both systemd and initd distro’s), see Enabling Start on Boot.
Download the latest version of Cribl Stream at https://cribl.io/download/.
Un-tar the resulting .tgz file in a directory of your choice (e.g., /opt/). Here’s general syntax, then a specific example:
tar xvzf cribl-<version>-<build>-<arch>.tgz
tar xvzf cribl-3.5.0-fa5eb040-linux-x64.tgzYou’ll now have Cribl Stream installed in a cribl subdirectory, by default: /opt/cribl/. We’ll refer to this cribl subdirectory throughout this documentation as $CRIBL_HOME.
Run Cribl Stream
In your terminal, switch to the $CRIBL_HOME/bin directory (e.g,: /opt/cribl/bin). Here, you can start, stop, and verify the Cribl Stream server using these basic ./cribl CLI commands:
- Start:
./cribl start - Stop:
./cribl stop - Get status:
./cribl status
For other available commands, see CLI Reference.
Next, in your browser, open http://<hostname>:9000 (e.g., http://localhost:9000) and log in with default credentials (admin, admin).
Register your copy of Cribl Stream when prompted.
After registering, you’ll be prompted to change the default password.
That’s it!
Get Data Flowing
With Cribl Stream now running - either in Cribl.Cloud or in your self-hosted copy - you’re ready to configure a working Cribl Stream deployment. You’ll set up a Source, Destination, Pipeline, and Route, and will assemble several built-in Functions to refine sample log data.
Add a Source
Each Cribl Stream Source represents a data input. Options include Splunk, Elastic Beats, Kinesis, Kafka, syslog, HTTP, TCP JSON, and others.
For this tutorial, we’ll enable a Cribl Stream built-in datagen (i.e., data generator) that generates a stream of realistic sample log data.
If you’re on Cribl.Cloud or any other distributed mode, first click the top nav’s Manage tab to select the
default(or another) Worker Group.
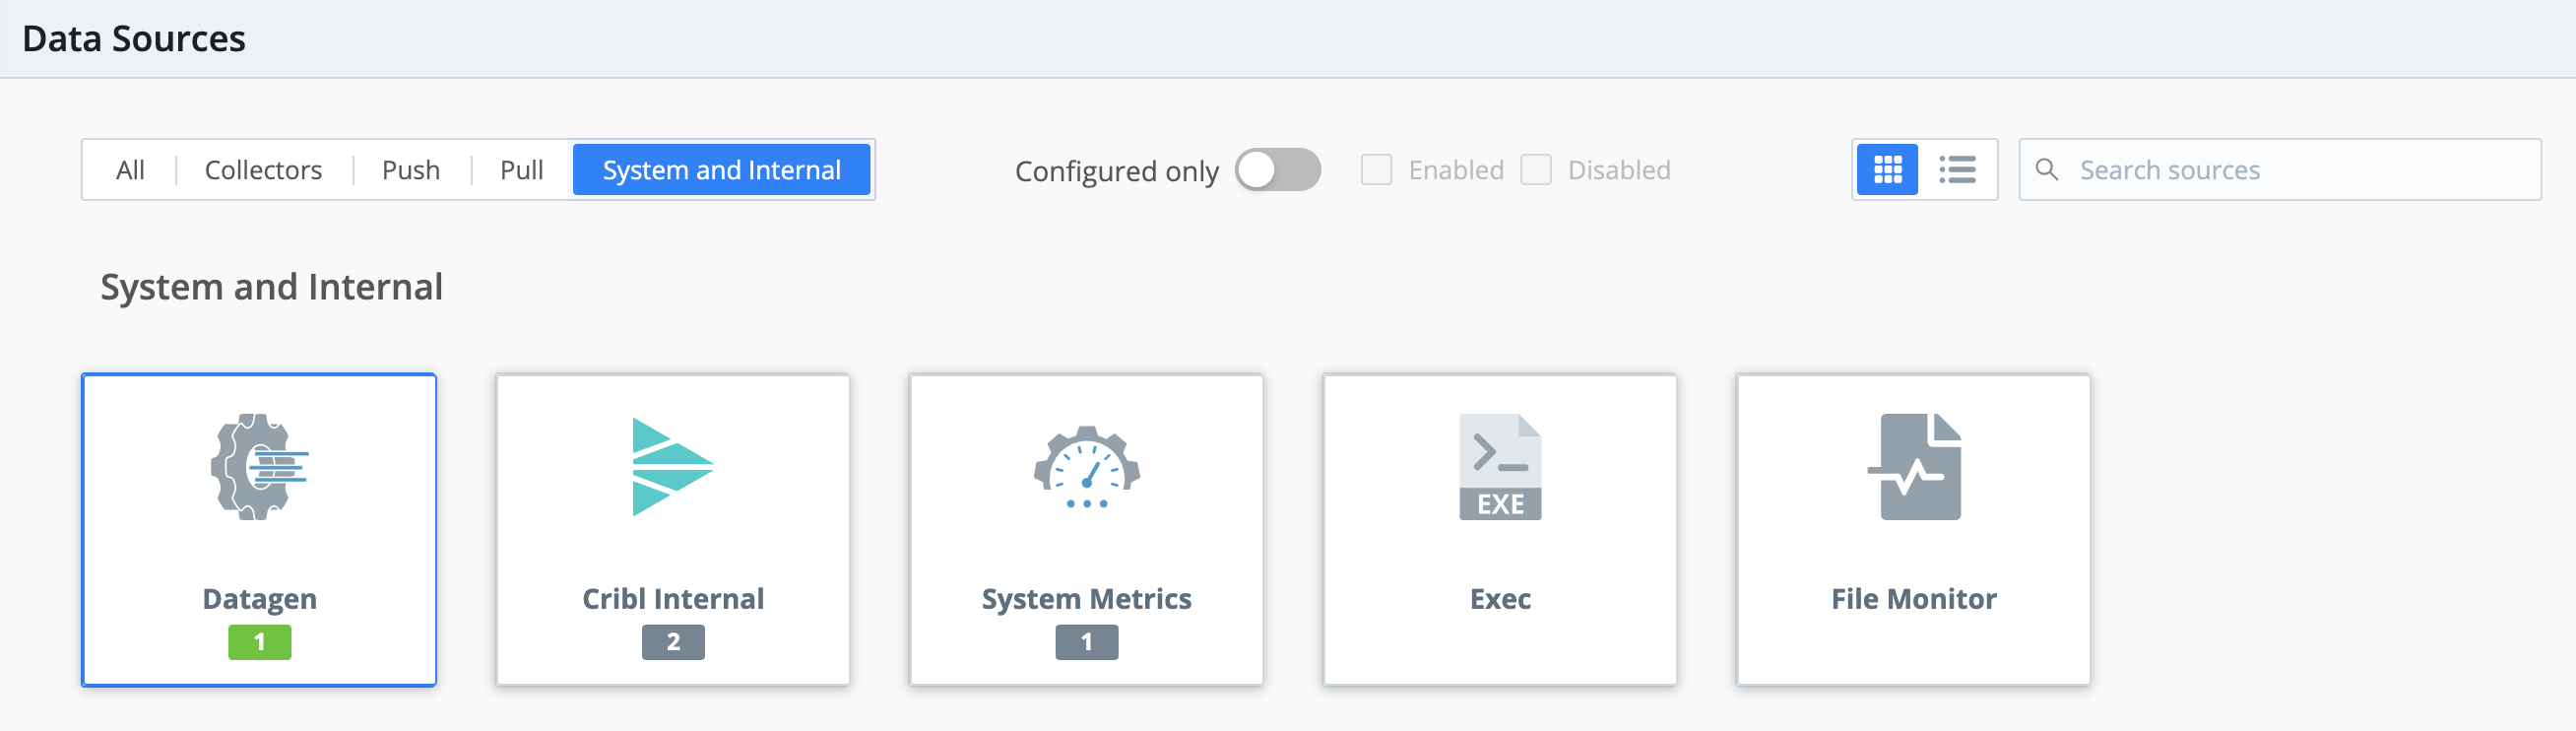
From Cribl Stream’s Manage submenu, select Data > Sources.
From the Data Sources page’s tiles or left menu, select Datagen.
(You can use the search box to jump to the Datagen tile.)
Click New Source to open the New Source modal.
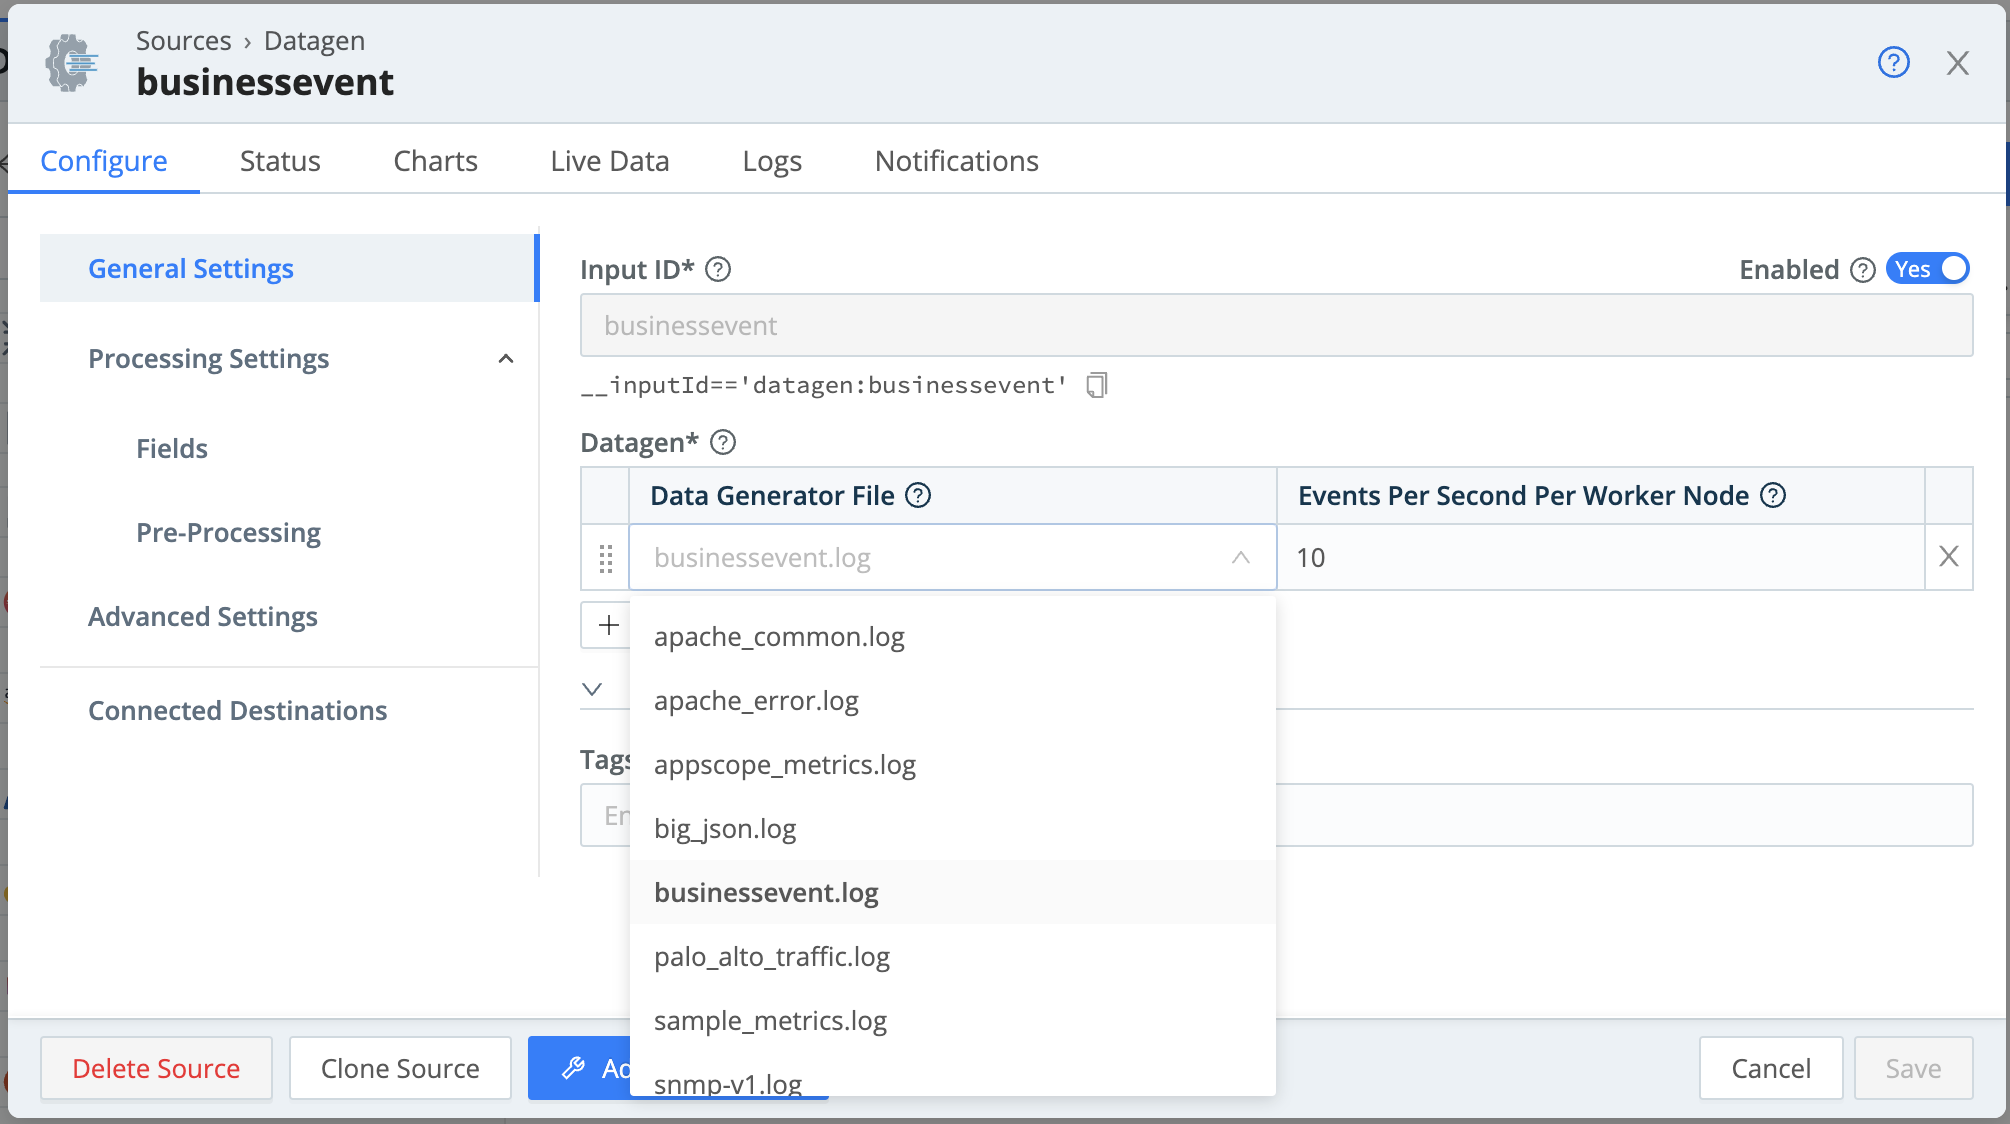
In the Input ID field, name this Source
businessevent.In the Data Generator File drop-down, select
businessevent.log.This generates…log events for a business scenario. We’ll look at their structure shortly, in Capture and Filter Sample Data.
Click Save.
If you’re on Cribl.Cloud or any other distributed mode, click Commit & Deploy at Cribl Stream’s upper right before proceeding. Then, in the resulting dialog box, click Commit & Deploy to confirm. You’ll see a Commit successful message.
The Yes slider in the Enabled column indicates that your Datagen Source has started generating sample data.
Add a Destination
Each Cribl Stream Destination represents a data output. Options include Splunk, Kafka, Kinesis, InfluxDB, Snowflake, Databricks, TCP JSON, and others.
For this tutorial, we’ll use Cribl Stream’s built-in DevNull Destination. This simply discards events - not very exciting! But it simulates a real output, so it provides a configuration-free quick start for testing Cribl Stream setups. It’s ideal for our purposes.
To verify that DevNull is enabled, let’s walk through setting up a Destination, then setting it up as Cribl Stream’s default output:
On Cribl.Cloud or any other distributed mode, first click the top nav’s Manage tab to select the
default(or another) Worker Group.
From Cribl Stream’s top menu, select Data > Destinations.
From the Data Destinations page’s tiles or left menu, select DevNull.
(You can use the search box to jump to the DevNull tile.)
On the resulting devnull row, look for the Live indicator under Status. This confirms that the DevNull Destination is ready to accept events.
From the Data Destinations page’s left nav, select the Default Destination at the top.
On the resulting Manage Default Destination page, verify that the Default Output ID drop-down points to the devnull Destination we just examined.
If you’re on Cribl.Cloud or any other distributed mode, click Commit & Deploy at Cribl Stream’s upper right (if available) before proceeding. Then, in the resulting dialog box, click Commit & Deploy to confirm. You’ll see a Commit successful message.
We’ve now set up data flow on both sides. Is data flowing? Let’s check.
Monitor Data Throughput
Click the top nav’s Monitoring tab. This opens a summary dashboard, where you should see a steady flow of data in and out of Cribl Stream. The left graph shows events in/out. The right graph shows bytes in/out.
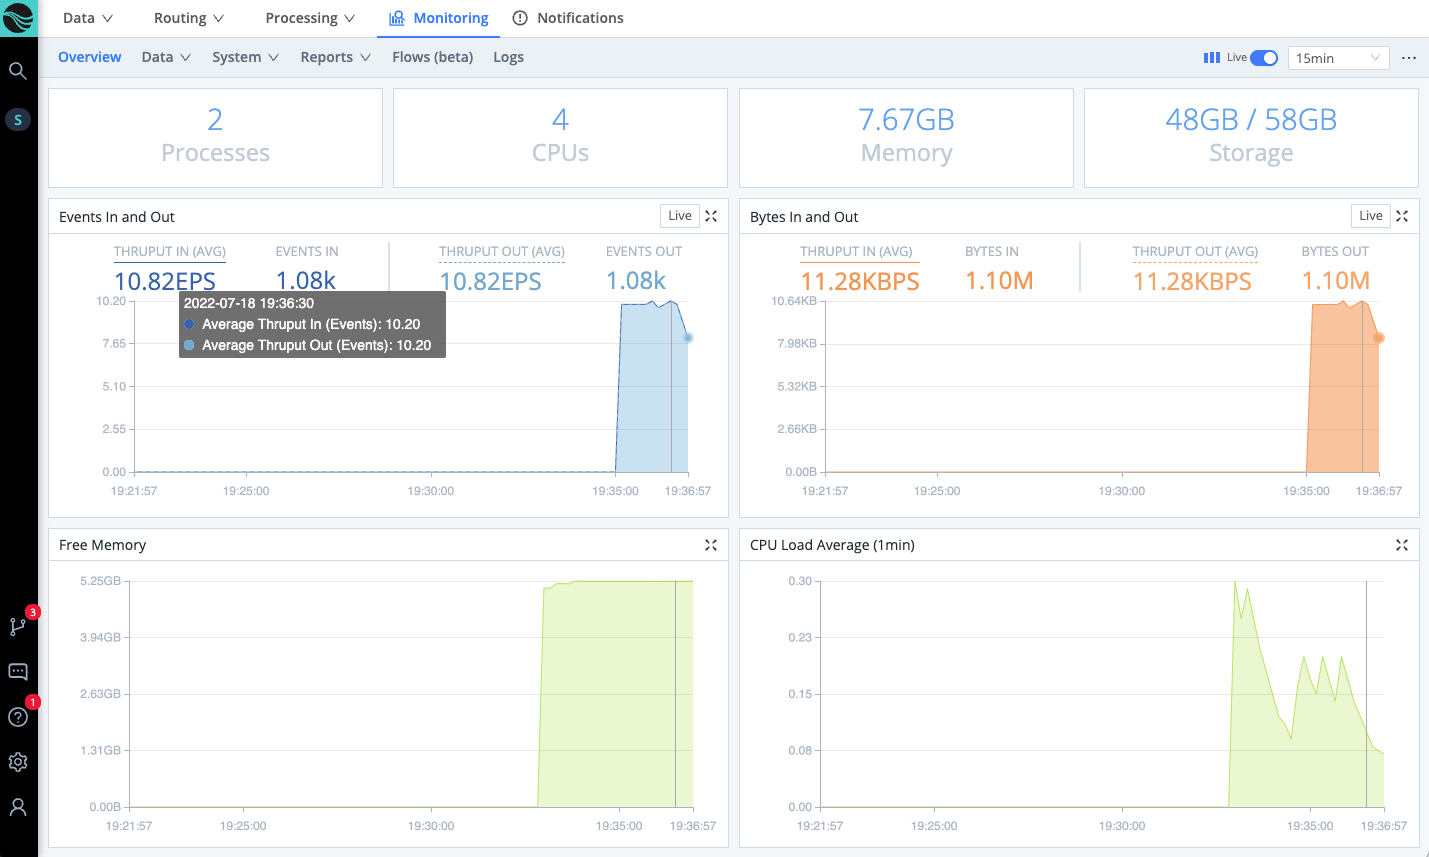
Monitoring displays data from the preceding 24 hours. You can use the Monitoring submenu to open detailed displays of Cribl Stream components, collection jobs and tasks, and Cribl Stream’s own internal logs. Click Sources on the lower submenu to switch to this view:
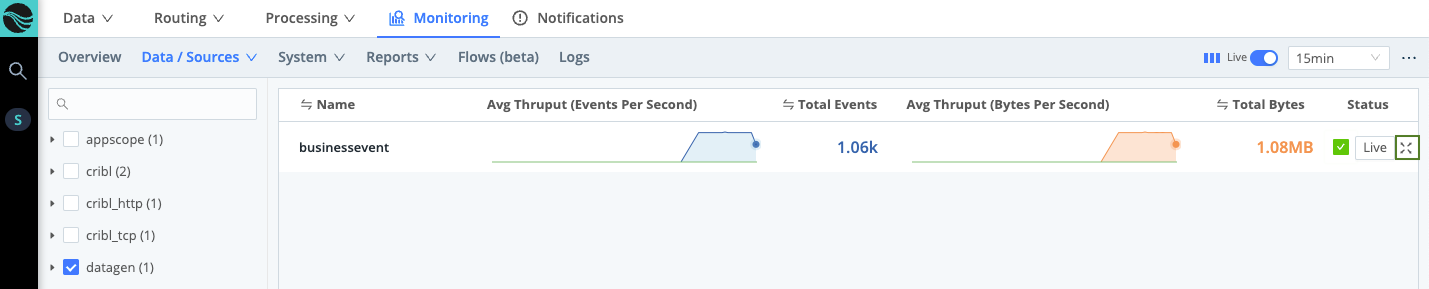
This is a compact display of each Source’s inbound events and bytes as a sparkline. You can click each Source’s Expand button (highlighted at right) to zoom up detailed graphs.
Click Destinations on the lower submenu. This displays a similar sparklines view, where you can confirm data flow out to the devnull Destination:
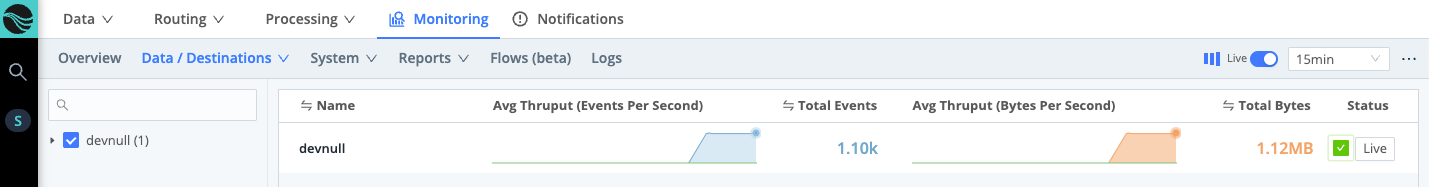
With confidence that we’ve got data flowing, let’s send it through a Cribl Stream Pipeline, where we can add Functions to refine the raw data.
Create a Pipeline
A Pipeline is a stack of Cribl Stream Functions that process data. Pipelines are central to refining your data, and also provide a central Cribl Stream workspace - so let’s get one going.
On Cribl.Cloud or any other distributed mode, first click the top nav’s Manage tab to select the
default(or another) Worker Group.
From the top menu, select Processing > Pipelines.
You now have a two-pane view, with a Pipelines list on the left and Sample Data controls on the right. (We’ll capture some sample data momentarily.)
At the Pipelines pane’s upper right, click + Pipeline, then select Create Pipeline.
In the new Pipeline’s ID field, enter a unique identifier. (For this tutorial, you might use
slicendice.)Optionally, enter a **Description ** of this Pipeline’s purpose.
Click Save.
Now scroll through the right Preview pane. Depending on your data sample, you should now see multiple events struck out and faded - indicating that Cribl Stream will drop them before forwarding the data.
If you’re on Cribl.Cloud or any other distributed mode, click Commit & Deploy at Cribl Stream’s upper right before proceeding. Then, in the resulting dialog box, click Commit & Deploy to confirm. You’ll see a Commit successful message.
Your empty Pipeline now prompts you to preview data, add Functions, and attach a Route. So let’s capture some data to preview.

Capture and Filter Sample Data
The right Sample Data pane provides multiple tools for grabbing data from multiple places (inbound streams, copy/paste, and uploaded files); for previewing and testing data transformations as you build them; and for saving and reloading sample files.
Since we’ve already got live (simulated) data flowing in from the datagen Source we built, let’s grab some of that data.
Capture New Data
In the right pane, click Capture New.
Click Capture, then accept the drop-down’s defaults - click Start.
When the modal finishes populating with events, click Save as Sample File.
In the SAMPLE FILE SETTINGS fly-out, change the generated File Name to a name you’ll recognize, like
be_raw.log.Click Save. This saves to the File Name you entered above, and closes the modal. You’re now previewing the captured events in the right pane. (Note that this pane’s Preview Simple tab now has focus.)
Click the Show more link to expand one or more events.
By skimming the key-value pairs within the data’s _raw fields, you’ll notice the scenario underlying this preview data (provided by the businessevents.log datagen): these are business logs from a mobile-phone provider.
To set up our next step, find at least one marketState K=V pair. Having captured and examined this raw data, let’s use this K=V pair to crack open Cribl Stream’s most basic data-transformation tool, Filtering.
Filter Data and Manage Sample Files
Click the right pane’s Sample Data tab.
Again click Capture New.
In the Capture Sample Data modal, replace the Filter Expression field’s default
truevalue with this simple regex:_raw.match(/marketState=TX/)We’re going to Texas! If you type this in, rather than pasting it, notice how Cribl Stream provides typeahead assist to complete a well-formed JavaScript expression.
You can also click the Expand button at the Filter Expression field’s right edge to open a modal to validate your expression. The adjacent drop-down enables you to restore previously used expressions.

Expand button and history drop-down Click Capture, then Start.
Using the Capture drop-down’s default limits of 10 seconds and 10 events, you’ll notice that with this filter applied, it takes much longer for Cribl Stream to capture 10 matching events.
Click Cancel to discard this filtered data and close the modal.
On the right pane’s Sample Data tab, click Simple beside
be_raw.log.
This restores our preview of our original, unfiltered capture. We’re ready to transform this sample data in more interesting ways, by building out our Pipeline’s Functions.
Refine Data with Functions
Functions are pieces of JavaScript code that Cribl Stream invokes on each event that passes through them. By default, this means all events - each Function has a Filter field whose value defaults to true. As we just saw with data capture, you can replace this value with an expression that scopes the Function down to particular matching events.
In this Pipeline, we’ll use some of Cribl Stream’s core Functions to:
- Redact (mask) sensitive data
- Extract (parse) the
_rawfield’s key-value pairs as separate fields. - Add a new field.
- Delete the original
_rawfield, now that we’ve extracted its contents. - Rename a field for better legibility.
Mask: Redact Sensitive Data
In the right Preview pane, notice each that event includes a social key, whose value is a (fictitious) raw Social Security number. Before this data goes any further through our Pipeline, let’s use Cribl Stream’s Mask Function to swap in an md5 hash of each SSN.
In the left Pipelines pane, click + Function.
Search for
Mask, then click it.In the new Function’s Masking Rules, click the into Match Regex field.
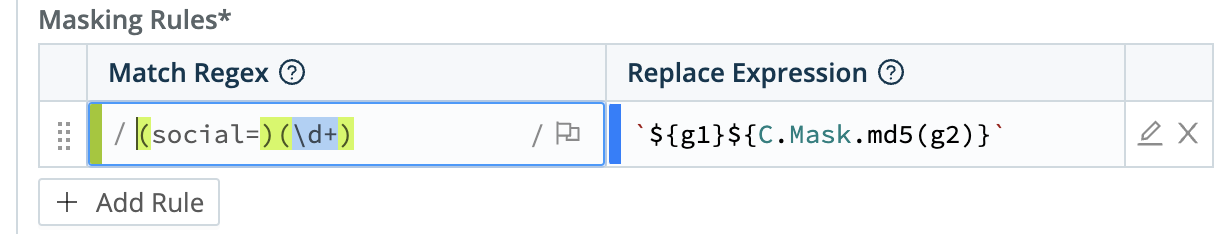
Now we want to build the Match Regex/Replace Expression row shown just below.
Enter or paste this regex, which simply looks for the string
social=, followed by any digits:(social=)(\d+)In Replace Expression, paste the following hash function. The backticks are literal:
`${g1}${C.Mask.md5(g2)}`Note that Apply to Fields defaults to
_raw. This is what we want to target, so we’ll accept this default.Click Save.
You’ll immediately notice some obvious changes:
The Preview pane has switched from its IN to its OUT tab, to show you the outbound effect of the Pipeline you just saved.
Each event’s
_rawfield has changed color, to indicate that it’s undergone some redactions.
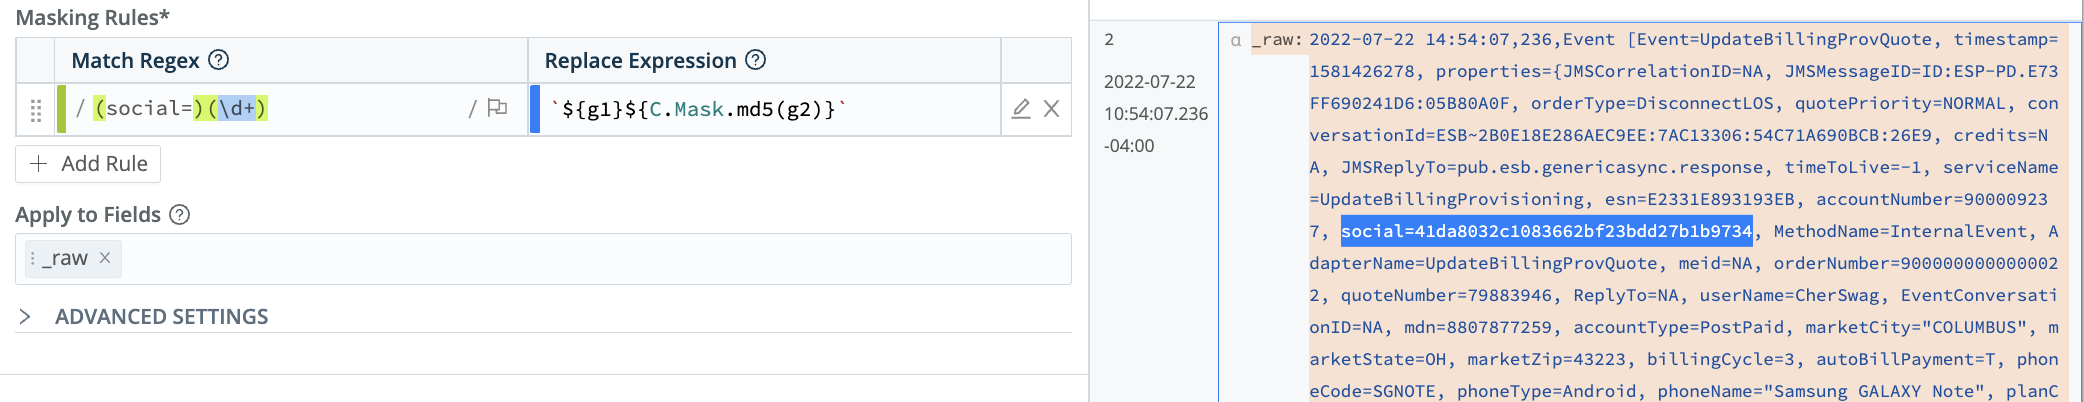
Now locate at least one event’s Show more link, and click to expand it. You can verify that the social values have now been hashed.
Parser: Extract Events
Having redacted sensitive data, we’ll next use a Parser function to lift up all the _raw field’s key-value pairs as fields:
In the left Pipelines pane, click + Function.
Search for
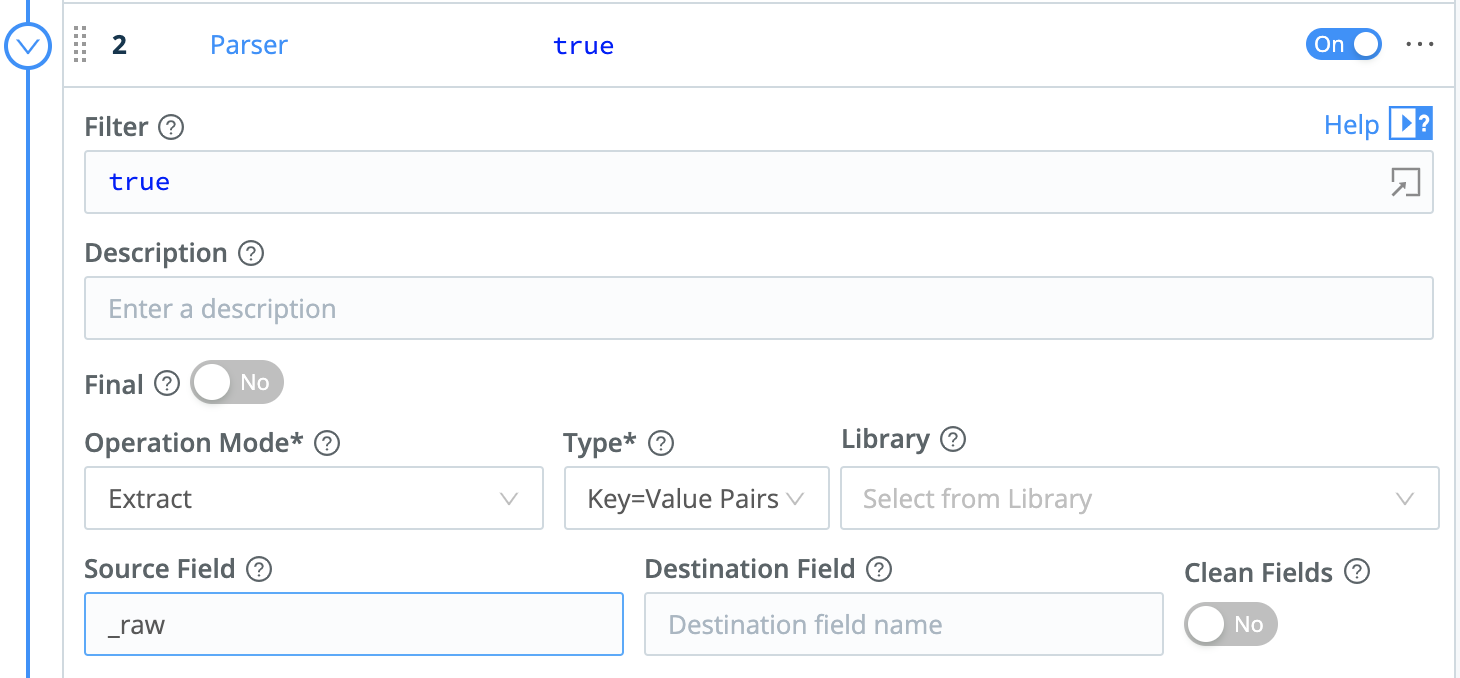
Parser, then click it.Leave the Operation Mode set to its
Extractdefault.Set the Type to
Key=Value Pairs.Leave the Source Field set to its
_rawdefault.Click Save.
_rawYou should see the Preview pane instantly light up with a lot more fields, parsed from _raw. You now have rich structured data, but not all of this data is particularly interesting: Note how many fields have NA (“Not Applicable”) values. We can enhance the Parser Function to ignore fields with NA values.
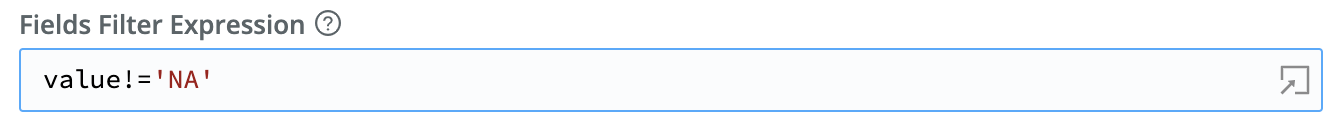
In the Function’s Fields Filter Expression field (near the bottom), enter this negation expression:
value!='NA'.Note the single-quoted value. If you type (rather than paste) this expression, watch how typeahead matches the first quote you type.
Click Save, and watch the Preview pane.
Several fields should disappear - such as credits, EventConversationID, and ReplyTo. The remaining fields should display meaningful values. Congratulations! Your log data is already starting to look better-organized and less bloated.
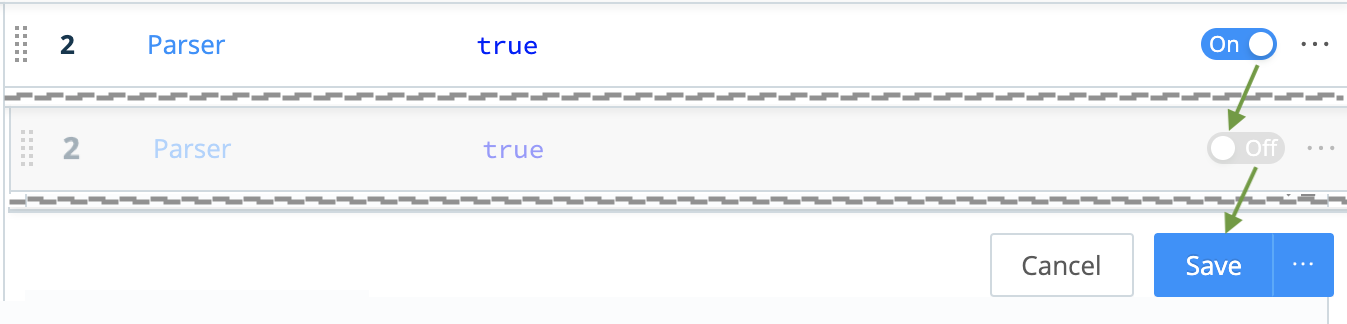
Missed It?
If you didn’t see the fields change, slide the Parser Function Off, click Save below, and watch the Preview pane change. Using these toggles, you can preserve structure as you test and troubleshoot each Function’s effect.
Note that each Function also has a Final toggle, defaulting to Off. Enabling Final anywhere in the Functions stack will prevent data from flowing to any Functions lower in the UI.
Be sure to toggle the Function back On, and click Save again, before you proceed!
Next, let’s add an extra field, and conditionally infer its value from existing values. We’ll also remove the _raw field, now that it’s redundant. To add and remove fields, the Eval Function is our pal.
Eval: Add and Remove Fields
Let’s assume we want to enrich our data by identifying the manufacturer of a certain popular phone handset. We can infer this from the existing phoneType field that we’ve lifted up for each event.
Add Field (Enrich)
In the left Pipelines pane, click + Function.
Search for
Eval, then click it.Click + Add Fields to open the Evaluate Fields table.
Here you add new fields to events, defining each field as a key-value pair. If we needed more key-value pairs, we could click
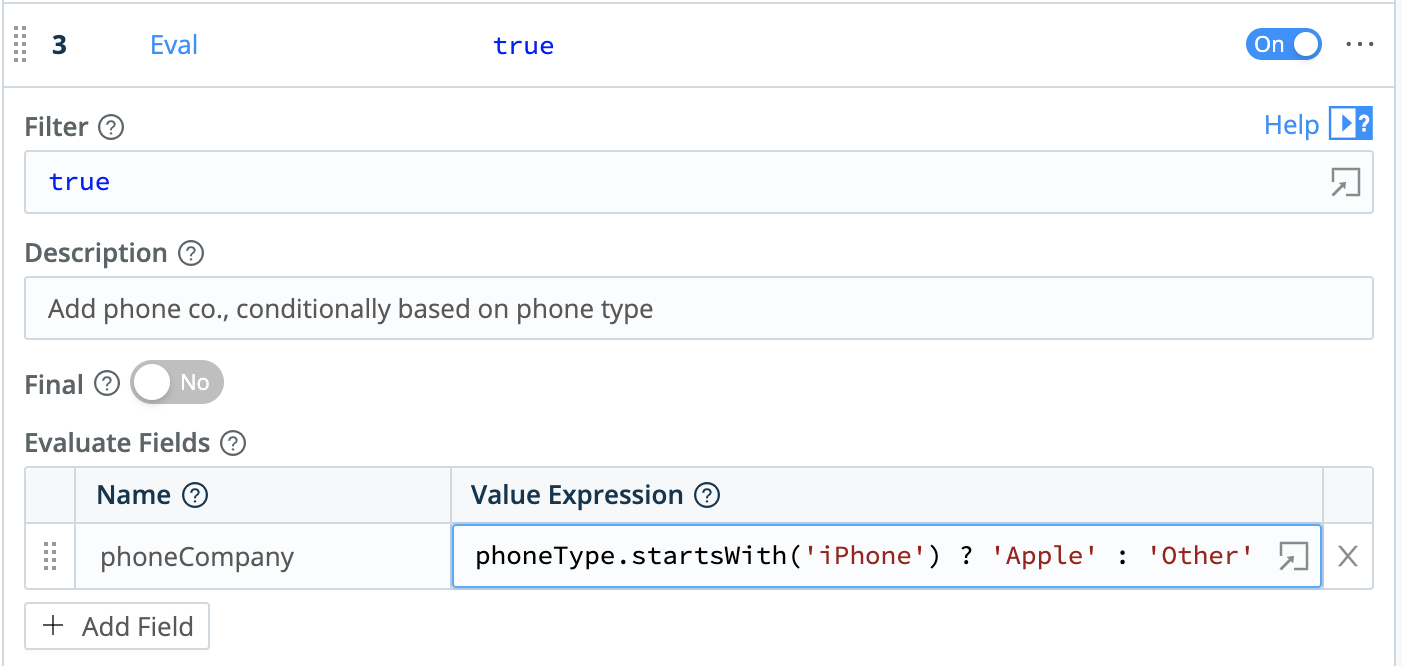
+ Add Fieldfor more rows.In the table’s first row, click into the Name field and enter:
phoneCompany.In the adjacent Value Expression field, enter this JS ternary expression that tests
phoneType’s value:phoneType.startsWith('iPhone') ? 'Apple' : 'Other'(Note the?and:operators, and the single-quoted values.)Click Save. Examine some events in the Preview pane, and each should now contain a
phoneCompanyfield that matches itsphoneType.
Remove Field (Shrink Data)
Now that we’ve parsed out all of the _raw field’s data - it can go. Deleting a (large) redundant field will give us cleaner events, and reduced load on downstream resources.
Still in the Eval Function, click into Remove Fields.
Type:
_rawand press Tab or Enter.Click Save.
The Preview pane’s diff view should now show each event’s _raw field stripped out.

Our log data has now been cleansed, structured, enriched, and slimmed-down. Let’s next look at how to make it more legible, by giving fields simpler names.
Rename: Refine Field Names
In the left Pipelines pane, click
+ Function.This rhythm should now be familiar to you.
Search for
Rename, then click it.Click + Add fields to open the Rename fields table.
Click into the new Function’s Rename fields table.
This has the same structure you saw above in Eval: Each row defines a key-value pair.
In Current name, enter the longhaired existing field name:
conversationId.In New name, enter the simplified field name:
ID.Watch any event’s
conversationIdfield in the Preview pane as you click Save at left. This field should change toIDin all events.
Drop: Remove Unneeded Events
We’ve already refined our data substantially. To further slim it down, a Pipeline can entirely remove events that aren’t of interest for a particular downstream service.
As the “Pipeline” name implies, your Cribl Stream installation can have multiple Pipelines, each configured to send out a data stream tailored to a particular Destination. This helps you get the right data in the right places most efficiently.
Here, let’s drop all events for customers who use prepaid monthly phone service (i.e., not postpaid):
In the left Pipelines pane, click + Function.
Search for
Drop, then click it.Click into the new Function’s Filter field.
Replace the default
truevalue with this JS negation expression:accountType!='PostPaid'Click Save.
Now scroll through the right Preview pane. Depending on your data sample, you should now see multiple events struck out and faded - indicating that Cribl Stream will drop them before forwarding the data.
A Second Look at Our Data
Torture the data enough, and it will confess. By what factor have our transformations refined our data’s volume? Let’s check.
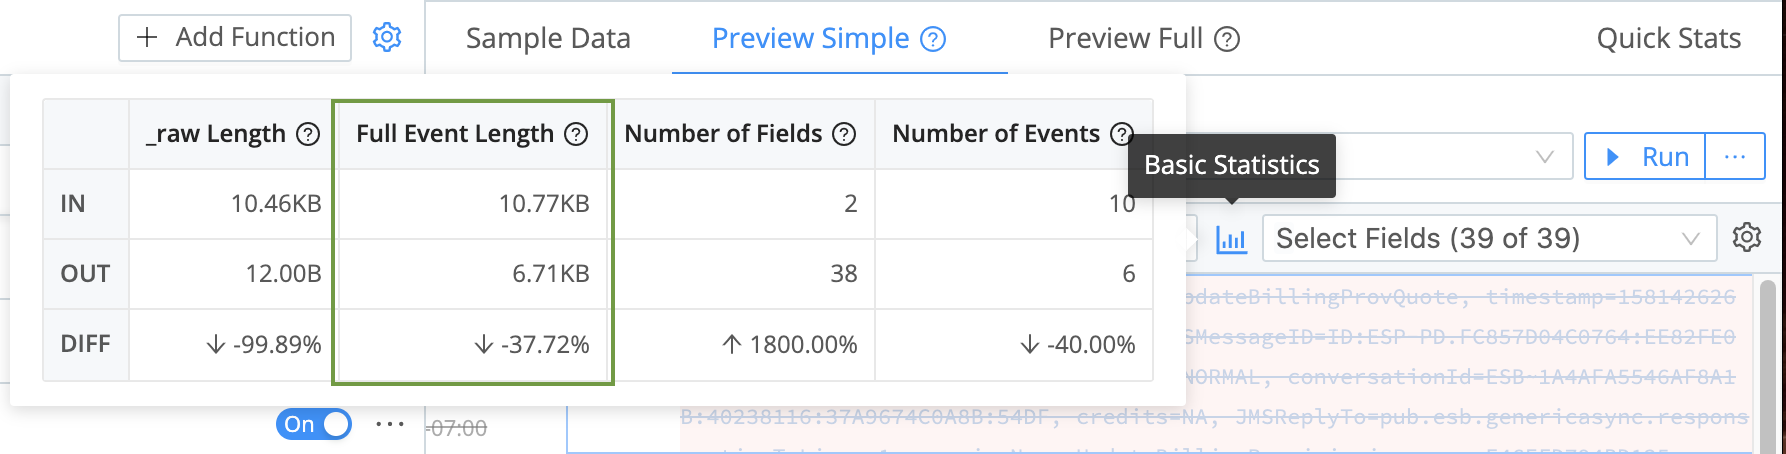
In the right Preview pane, click the Basic Statistics button:
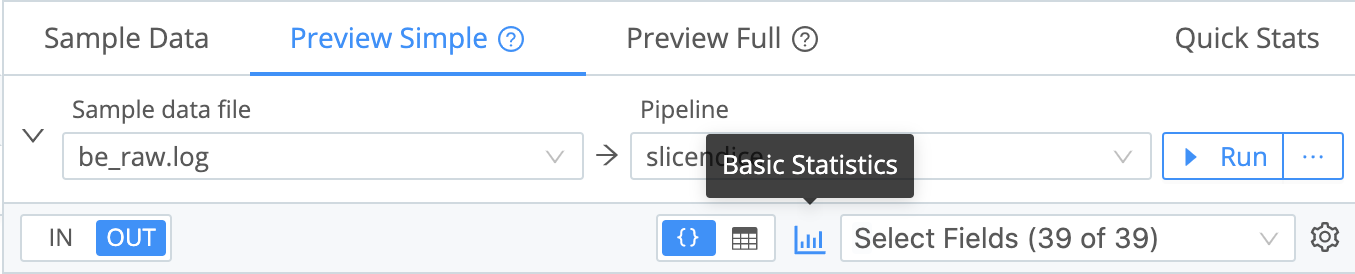
Even without the removal of the _raw field (back in Eval) and the dropped events, you should see a substantial % reduction in the Full Event Length.
Woo hoo! Before we wrap up our configuration: If you’re curious about individual Functions’ independent contribution to the data reduction shown here, you can test it now. Use the toggle Off > Save > Basic Statistics sequence to check various changes.
Add and Attach a Route
We’ve now built a complete, functional Pipeline. But so far, we’ve tested its effects only on the static data sample we captured earlier. To get dynamic data flowing through a Pipeline, we need to filter that data in, by defining a Cribl Stream Route.
At the Pipelines page’s top left, click Attach to Route.
This displays the Routes page. It’s structured very similarly to the Pipelines page, so the rhythm here should feel familiar.
Click
+ Route.Enter a unique, meaningful Route Name, like
demo.Leave the Filter field set to its
truedefault, allowing it to deliver all events.Because a Route delivers events to a Pipeline, it offers a first stage of filtering. In production, you’d typically configure each Route to filter events by appropriate
source,sourcetype,index,host,_time, or other characteristics. The Filter field accepts JavaScript expressions, including AND (&&) and OR (||) operators.Set the Pipeline drop-down to our configured
slicendicePipeline.Leave the Enable Expression field set to its No default. Toggling this field to Yes changes the Output field to an Output Expression field where you can enter a JavaScript expression for your Destination name.
Set the Output drop-down to either
devnullordefault.This doesn’t matter, because we’ve set
defaultas a pointer todevnull. In production, you’d set this carefully.You can leave the Description empty, and leave Final set to Yes.
Grab the new Route by its left handle, and drag it above the
defaultRoute, so that our new Route will process events first. You should see something like the screenshot below.Click Save to save the new Route to the Routing table.
If you’re on Cribl.Cloud or any other distributed mode, click Commit & Deploy at Cribl Stream’s upper right before proceeding. Then, in the resulting dialog box, click Commit & Deploy to confirm. You’ll see a Commit successful message.
The sparklines should immediately confirm that data is flowing through your new Route:
To confirm data flow through the whole system we’ve built, select Monitoring > Data > Routes and examine demo.
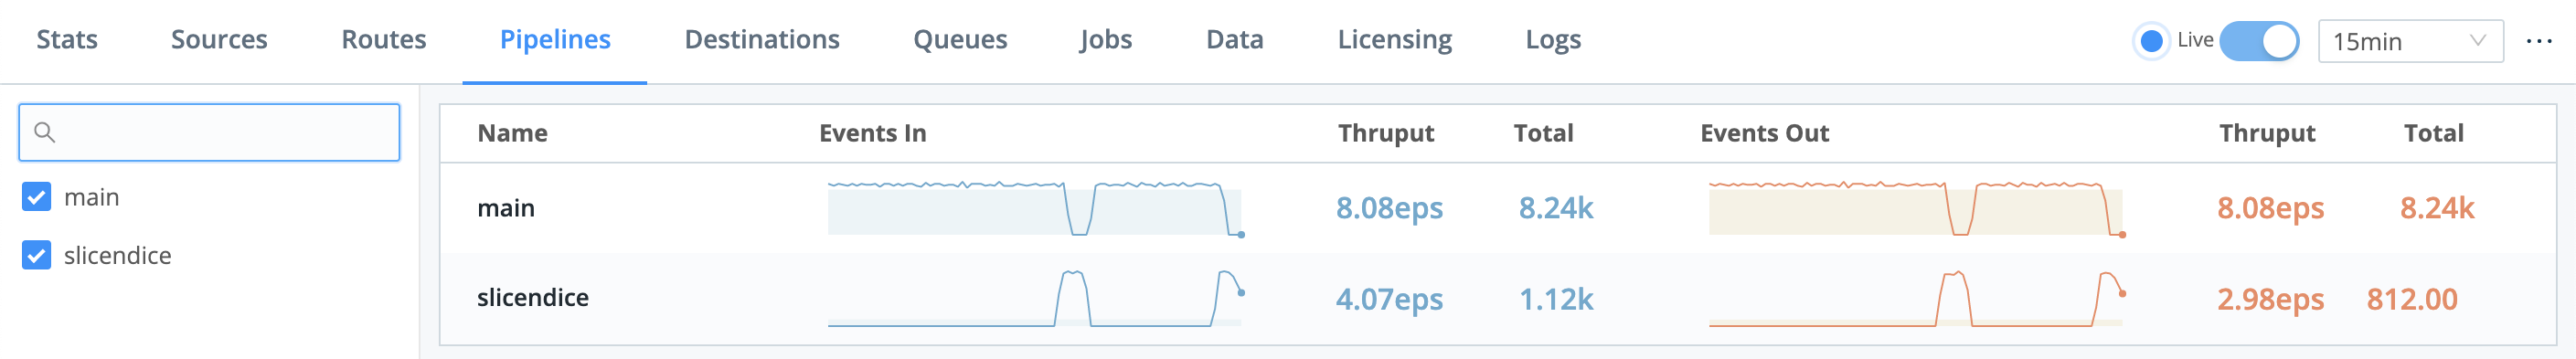
Also select Monitoring > Data > Pipelines and examine slicendice.
What Have We Done?
Look at you! Give yourself a pat on the back! In this short, scenic tour - with no hit to your cloud-services charges - you’ve built a simple but complete Cribl Stream system, exercising all of its basic components:
- Downloaded, installed, and run Cribl Stream.
- Configured a Source to hook up an input.
- Configured a Destination to feed an output.
- Monitored data throughput, and checked it twice.
- Built a Pipeline.
- Configured Cribl Stream Functions to redact, parse, enrich, trim, rename, and drop event data.
- Added and attached a Route to get data flowing through our Pipeline.
Next Steps
Interested in guided walk-throughs of more-advanced Cribl Stream features? We suggest that you next check out these further resources.
Cribl Stream Sandbox: Work through general and specific scenarios in a free, hosted environment, with terminal access and real data inputs and outputs.
Distributed Quick Start: Building on this tutorial that you’ve just completed, launch and configure a Cribl Stream distributed deployment. You’ll work with a small but realistic model of a fully scaleable production deployment.
Use Cases documentation: Bring your own services to build solutions to specific challenges.
Cribl Concept: Pipelines - Video showing how to build and use Pipelines at multiple Cribl Stream stages.
Cribl Concept: Routing - Video about using Routes to send different data through different paths.
Cleaning Up
Oh yeah, you’ve still got the Cribl Stream server running, with its businessevent.log datagen still firing events. If you’d like to shut these down for now, in reverse order:
Go to Data > Sources > Datagen.
Slide
businesseventto Off, and click Save. (Refer back to the screenshot above.)In your terminal’s
$CRIBL_HOME/bindirectory, shut down the server with:./cribl stop
That’s it! Enjoy using Cribl Stream.