


These docs are for Cribl Stream 4.1 and are no longer actively maintained.
See the latest version (4.17).
Diagnosing Issues
To help diagnose Cribl Stream problems, you can share a diagnostic bundle with Cribl Support. The bundle contains a snapshot of configuration files and logs at the time the bundle was created, and gives troubleshooters insights into how Cribl Stream was configured and operating at that time.
What’s in the Diagnostic Bundle
The following subdirectories (and their contents) of $CRIBL_HOME are included:
.../default/*.../local/*- except for/local/cribl/auth/, to exclude sensitive files..../log/*.../groups/*.../state/jobs/*- will return all jobs if left empty.
As a security measure, the bundle excludes all .crt, .pem, .cer, and .key files from all $CRIBL_HOME subdirectories.
Creating and Exporting a Diagnostic Bundle
If you’re managing your own Cribl Stream deployment (single-instance or distributed), you can create and securely share bundles with Cribl Support, either from the UI or via the CLI.
With a Cribl.Cloud deployment, create bundles and securely share them with Cribl Support directly from the UI. In the Using the UI instructions below, Send to Cribl Support will always be enabled, and the Export/download option will be unavailable.
Requirements
Using either medium, you’ll need outbound internet access to https://diag-upload.cribl.io and a valid support case number. The above URL works only when using the cribl diag command or uploading using the Cribl Stream UI. (So connecting directly to it with your web browser will fail.)
Open your support case before sending a diagnostic bundle to Cribl Support. Then, when creating the bundle, be sure to use the case number provided. Case numbers are 8 digits in length, and you must include any leading zeros. For example, 00001234.
Using the UI
Depending on the issue you’re debugging, you can create a bundle either from the Leader or from an individual Worker’s host.
From the Leader
To create a bundle from the Leader, go to Settings > Global Settings > Diagnostics > Diagnostic Bundle and click Create Diagnostic Bundle.
- To share the bundle with Cribl Support, toggle Send to Cribl Support to Yes. Enter your case number, and then click Export.
- To download the bundle locally to your machine (on-prem only), click Export.
From a Worker
To create a bundle from individual Workers, you must be able to access the Worker’s UI. You can easily use the Leader to get authenticated access to each Worker, if you first enable the parent Group’s UI Access (Teleporting) setting:
- Go to Manage > Groups.
- Make sure the relevant Group’s UI Access toggle is on.
- Click the Group’s Workers link.
- Click the link for the Worker you’re debugging.
- Look for the magenta border to confirm that you’ve teleported to that Worker.
- Click Worker Settings (top right) > Diagnostics (lower left) > Diagnostic Bundle, and click Create Diagnostic Bundle.
- Use the appropriate Export option listed above for the Leader.
On customer-managed/on-prem deployments, new and previously created bundles are stored in $CRIBL_HOME/diag. They’re also listed in the UI, where you can re-download them or share them with Cribl Support.
UI Options
The Create & Export Diag Bundle modal includes:
- Rename .js files toggle (defaults to
Yes). - Include metrics toggle (defaults to
Yes). - Latest number of jobs to include field (defaults to empty = unlimited).
Cribl Support will advise you on changing the defaults here. Disabling Include metrics can reduce the diag bundle’s size, where necessary.
Using the CLI
To create a bundle using the CLI, use the diag command. (This option is on-prem only.) Depending on the issue you’re debugging, you can create a bundle either from the Leader’s host or from an individual Worker’s host.
# $CRIBL_HOME/bin/cribl diag
Usage: [sub-command] [options] [args]

Commands:
get    - List existing Cribl Stream diagnostic bundles
create - Creates diagnostic bundle for Cribl Stream
send   - Send Cribl Stream diagnostic bundle to Cribl Support, args:
   -c <caseNumber> - Cribl Case Number
  [-p <path>]      - Diagnostic bundle path (if empty, then new bundle will be created)

## Creating a diagnostic bundle
# $CRIBL_HOME/bin/cribl diag create
Created Cribl Stream diagnostic bundle at /opt/cribl/diag/cribl-logstream-<hostname>-<datetime>.tar.gz.

## Creating and sending a diagnostic bundle
# $CRIBL_HOME/bin/cribl diag send -c <caseNumber>
Sent Cribl Stream diagnostic bundle to Cribl Support

## Sending a previously created diagnostic bundle
# $CRIBL_HOME/bin/cribl diag send -p /opt/cribl/diag/cribl-logstream-<hostname>-<datetime>.tar.gz -c <caseNumber>
Sent Cribl Stream diagnostic bundle to Cribl SupportIncluding CPU Profiles
If Cribl Support asks you to grab CPU profiles of Worker Processes, follow these steps:
- Use
toporhtopon the Worker Node to identify Worker PIDs consuming a lot of CPU. - See Sizing & Scaling > CPU Profiling for instructions on accessing the UI’s Profile options (for your deployment type), and generating and saving profiles.
- Find the Worker Processes matching the PIDs you identified above.
- Click Profile on each. Start with the default 10-second Duration.
- Once the profile is displayed, save it to a JSON file. (See details at the above link.)
- Repeat steps 3-6 for other CPU-intensive Worker Processes.
- Upload the profile JSON files to Cribl Support.
On an already CPU-starved Worker Node, profiling might fail with an error message, or just hang. In this case, you might need a few retries to get a successful profile.
Including Memory Snapshots
If you encounter a memory leak, Cribl Support might request a memory snapshot of a Worker Process, to better understand where the leak is occurring. To capture the memory snapshot, follow these instructions.
Configure Node JS Debug Mode
On the affected system, stop the LogStream process or service.
Systemd
If you have bootstrapped Cribl Stream, follow the section for Persisting Systemd Overrides. Add the following to the [Service] stanza:
Environment=NODE_ENV=debugOnce the environment variable has been added to the override file, run the following commands to start Cribl Stream again:
systemctl daemon-reload
systemctl start criblCommand Line
If starting Cribl Stream from the CLI, prepend NODE_ENV=debug to your command. E.g.: NODE_ENV=debug $CRIBL_HOME/bin/cribl start
Find Inspect Ports
On the Leader or Worker that you have configured for debug mode, run the following command: ps aux | grep cribl | grep -v grep. This will generate an output similar to the following:
[root@worker ~]# ps aux | grep cribl | grep -v grep
cribl    11525  2.6  1.4 1021944 150988 ?      Sl   07:36   0:25 /opt/cribl/bin/cribl server
cribl    11539 20.3  1.9 1136336 201164 ?      Rl   07:36   3:21 /opt/cribl/bin/cribl --inspect=0.0.0.0:9230 --inspect-port=9230 /opt/cribl/bin/cribl.js server -r WORKER
cribl 11545 20.3 2.0 1134336 204676 ? Sl 07:36 3:21 /opt/cribl/bin/cribl --inspect=0.0.0.0:9230 --inspect-port=9231 /opt/cribl/bin/cribl.js server -r WORKERMake note of the --inspect-port= values.
In the next step, you will configure Google Chrome to connect to these ports. You will need to ensure network connectivity from your machine to the Cribl Stream instance’s inspect ports.
If you don’t have direct network connectivity from your machine to the Cribl Stream instance, you will need to use SSH port forwarding. Repeat this example command for each port that you need to forward:
ssh -L 9230:localhost:9230 cribl@example.com
Obtain Remote Snapshots Using Google Chrome
Open Google Chrome and navigate to chrome://inspect. Ensure that you are on the Devices tab.
To the right of Discover network targets, click the Configure… button.
If you have previously generated a memory snapshot using this method, delete the old hosts from this list.
Next, as shown in the example below, enter the host and port combinations that you obtained in the previous step.
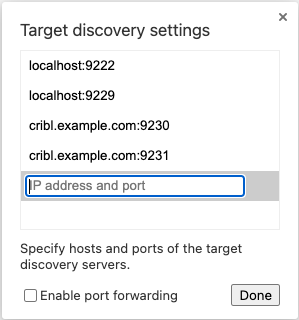
Click the Done button. You will now have a list of Remote Targets that you can inspect.
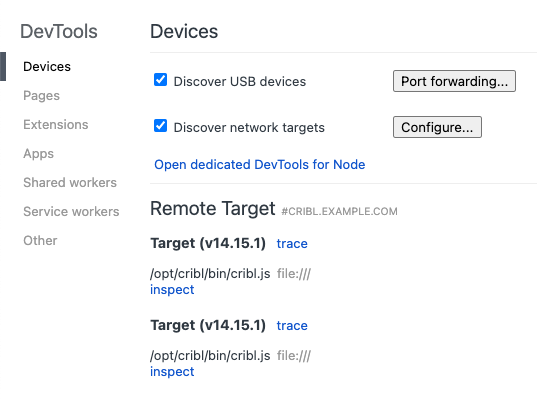
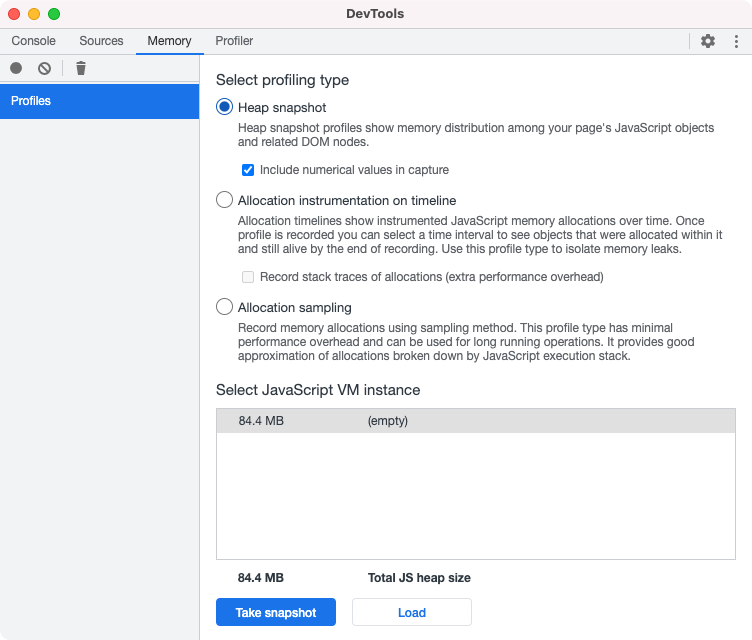
Click the blue inspect link for each target. This will open a new window. Select its Memory upper tab.
Select Heap snapshot, and select the check box labeled Include numerical values in capture.
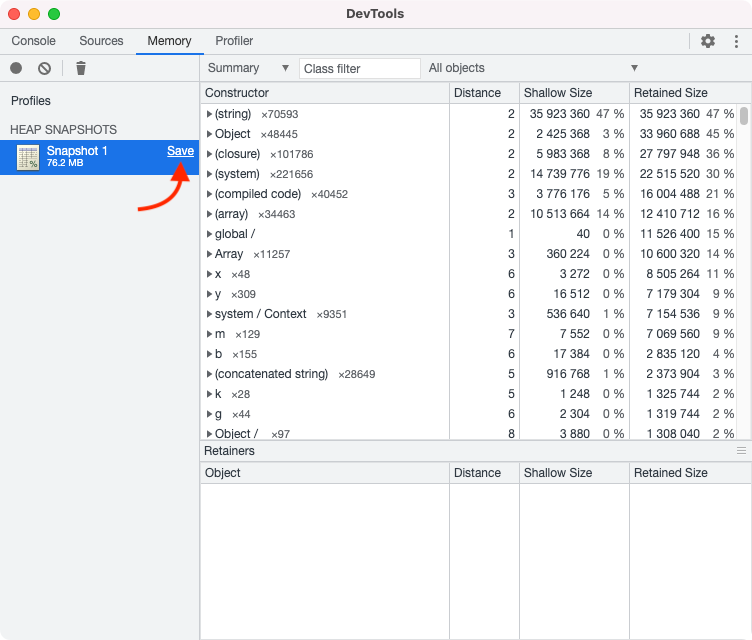
Next, click the blue Take snapshot button at the bottom of the window.
Download each snapshot by clicking the save link to the right of the snapshot number. As you download these files, be sure to append the Worker Process or inspect port number to each file name.
Then provide these files to Cribl Support.
Incomplete File Names?
If you forgot to record the Worker Process from which snapshots originated, you can run the following command:
grep -r '/opt/cribl/state/w_' .Example output:
./Heap-20220222T113432.heapsnapshot:"/opt/cribl/log/worker/2/cribl.log", ./Heap-20220222T115411.heapsnapshot:"/opt/cribl/log/worker/4/cribl.log", ./Heap-20220222T111147.heapsnapshot:"/opt/cribl/log/worker/1/cribl.log",The above files correspond to Worker Processes 2, 4, and 1, respectively.