These docs are for Cribl Stream 4.1 and are no longer actively maintained.
See the latest version (4.17).
Splunk to Exabeam
In many organizations, the IT department uses a tool like Splunk for operational logging, while the Security team relies on Exabeam to prevent insider threats. These tools use separate agents to access the same data, leading to some data-sharing conundrums:
- Installing the Exabeam agent in parallel with Splunk would duplicate the data.
- Some servers, like domain controllers, allow only a single agent. In this case, you can’t feed two platforms with the same data.
- Querying Splunk for the data would introduce extra latency and overhead costs.
- Forwarding data directly from Splunk Universal Forwarders (UFs) is a nonstarter. Classic logs from Splunk UFs embed newlines and special characters, which break Exabeam’s parser.
Cribl Stream can help you unblock these issues: Ingest data directly into Cribl Stream from Splunk UFs running on the domain controller, and transform the events in Stream before routing them to Exabeam.
While this example is written around a Splunk-to-Exabeam scenario, you can use the same general techniques to connect and transform data between several other upstream and downstream services.
Transforming Data from Splunk to Exabeam’s Format
In Cribl Stream’s core, you can easily design a Pipeline that modifies the original Splunk event to fit the format that Exabeam expects. Some Cribl Stream Functions useful for this transformation are:
- Serialize: Remove all of the newlines and spaces, and then transform the data into
JSONformat. - Mask: Remove the special characters, and replace them with space.
- Eval: Create a new field called
Message, and remove everything else using the Remove Fields option.
In this guide, we’ll show you how to:
- Capture sample logs.
- Apply the Functions (outlined above) to transform the sample log into Exabeam’s expected format.
- Validate your fields with Exabeam Parsers.
- Stream your event to Exabeam to test the entire sequence.
Capture Sample Logs
Start with sample logs of the event data you plan to work with. In our example, we’ll copy and paste the log sample straight into Cribl Stream.
Once you’ve pasted the log sample, enter a unique File Name on the modal’s left side, then click Save as Sample File at right.
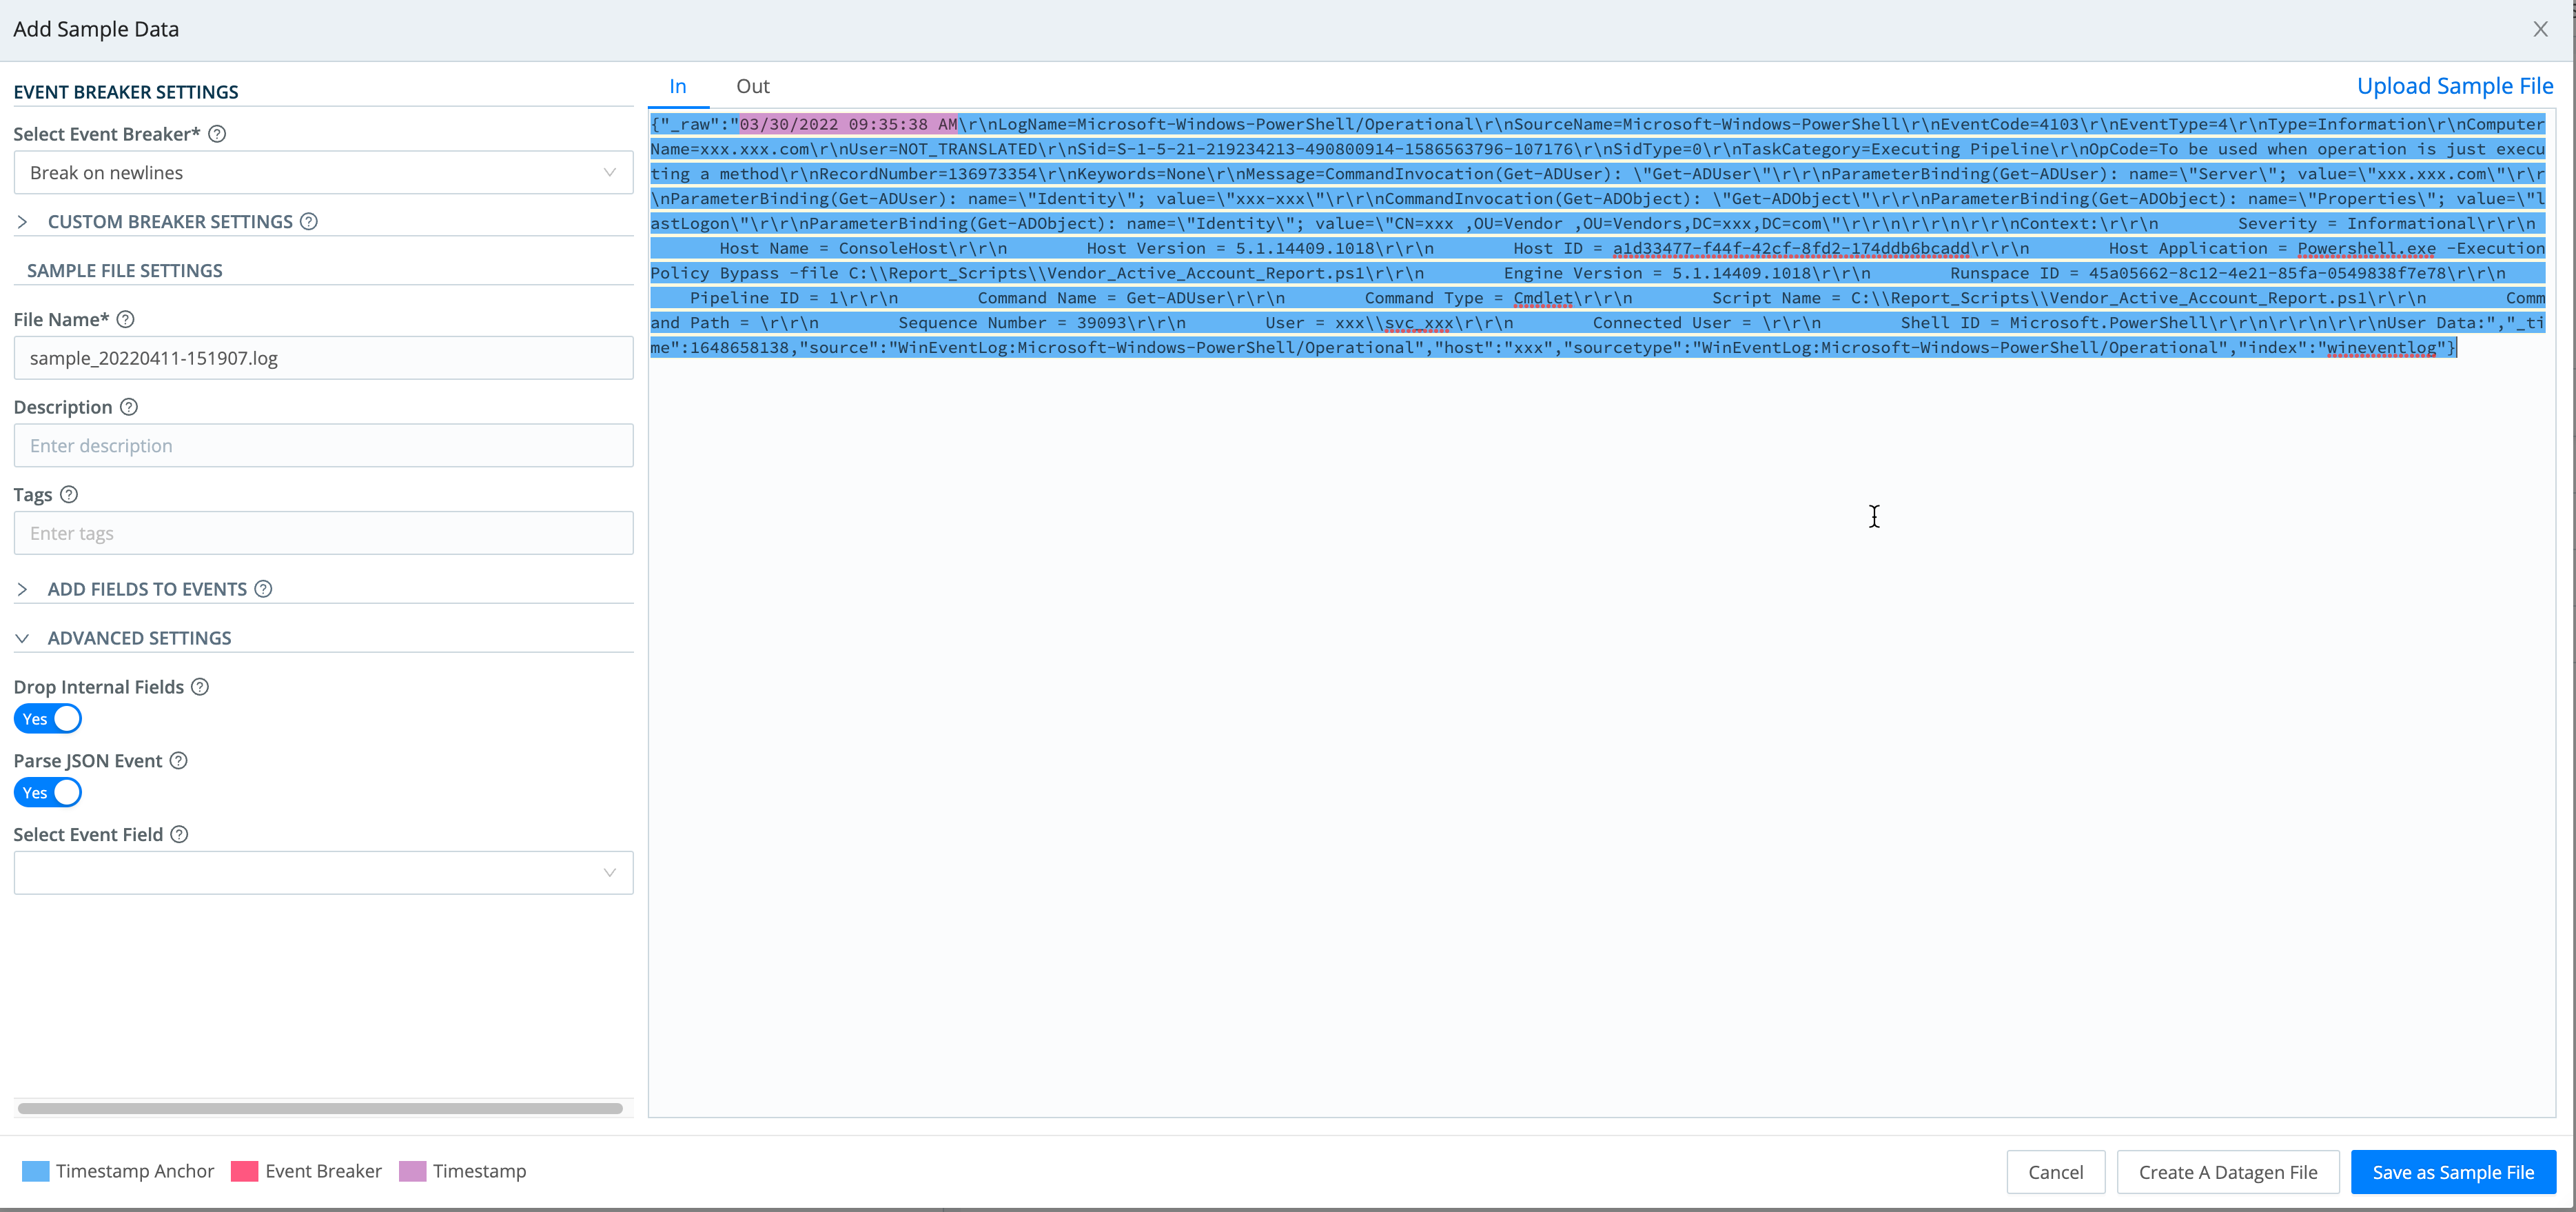
In your production environment, you can filter incoming events in real time (e.g., using a filter expression like Windows Security logging) to identify your in-scope Exabeam data.
Configure Pipeline
Next, this section shows relevant Functions that you can assemble into a processing Pipeline to transform the sample log into Exabeam’s expected format.
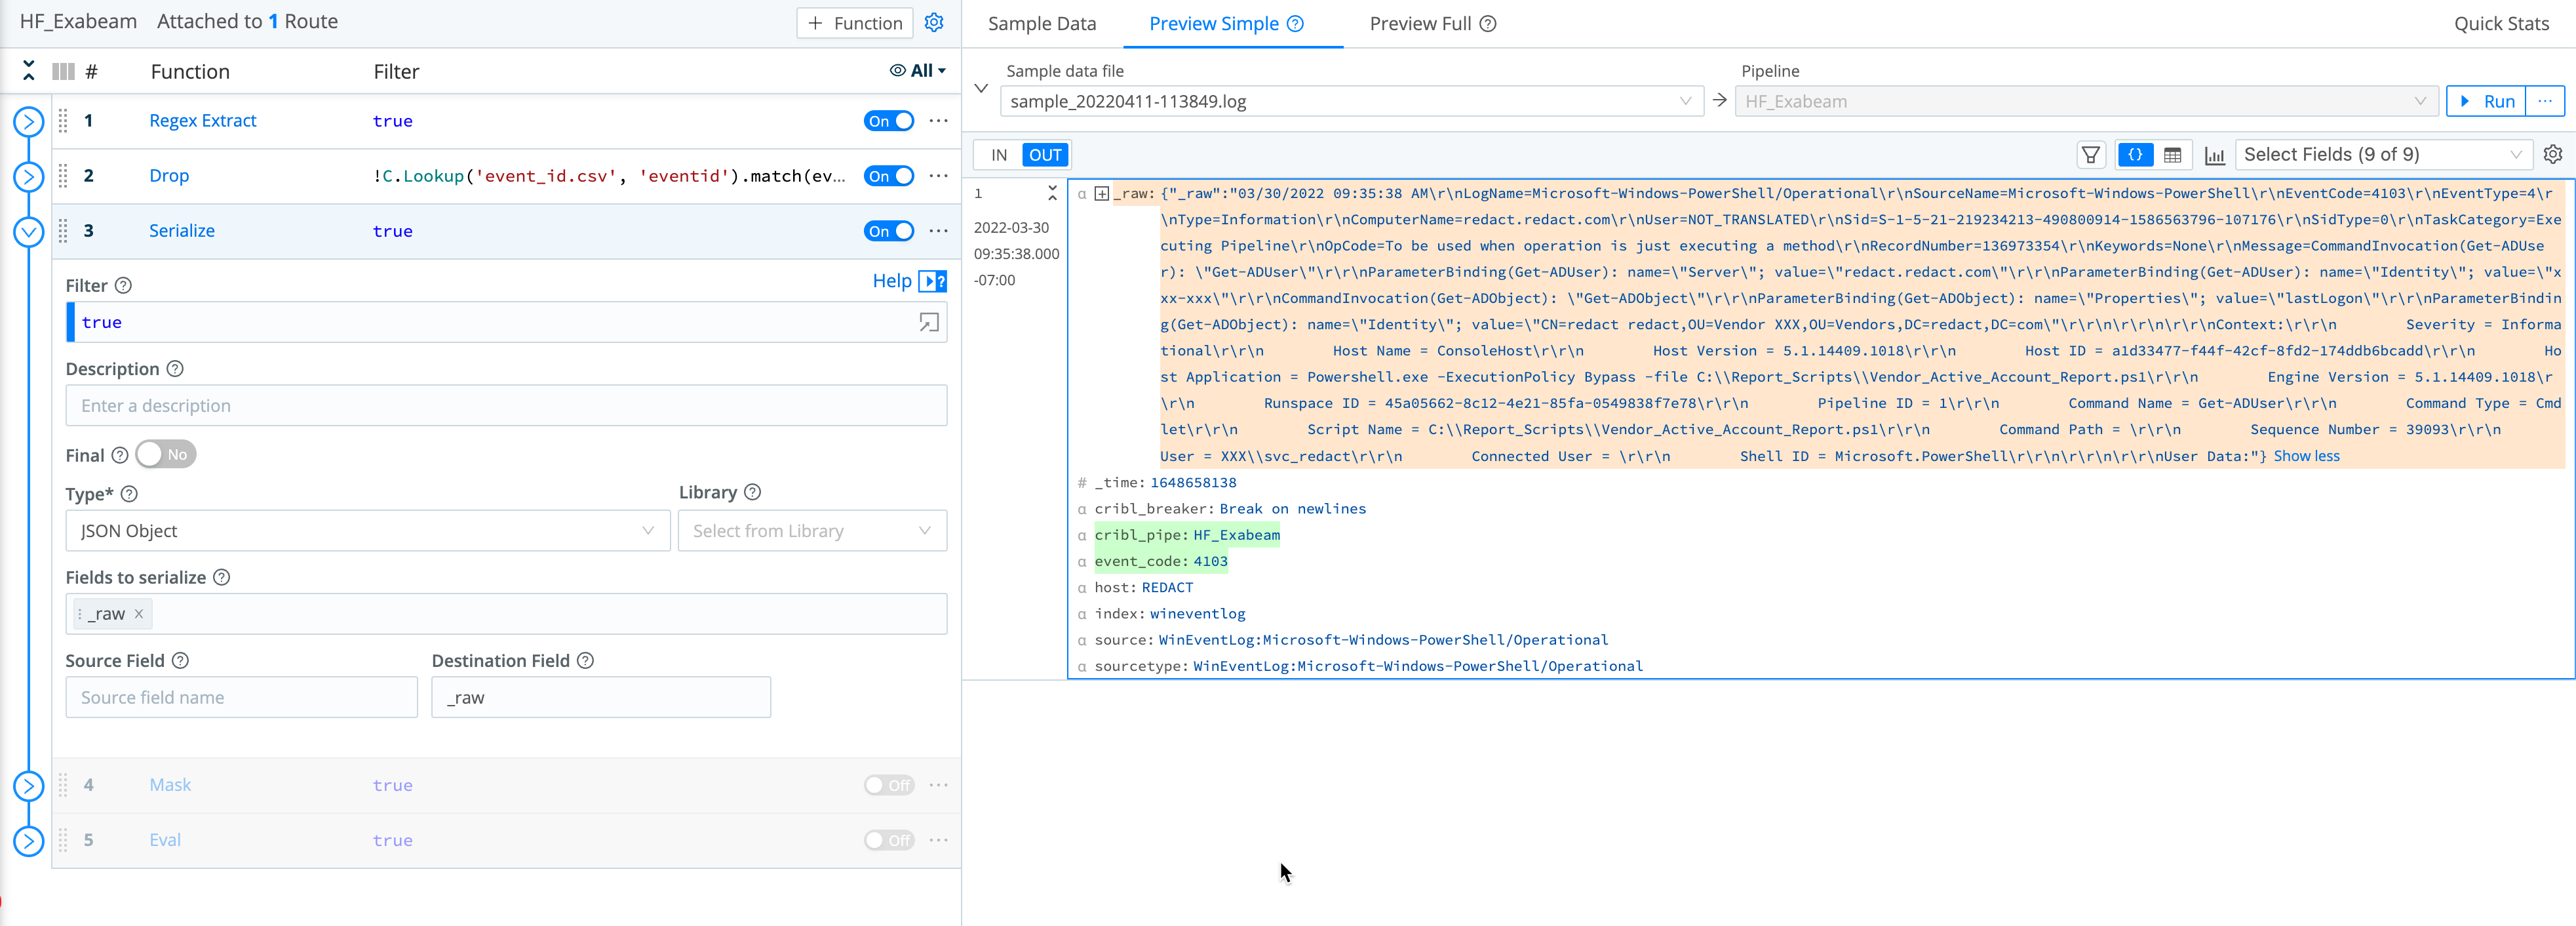
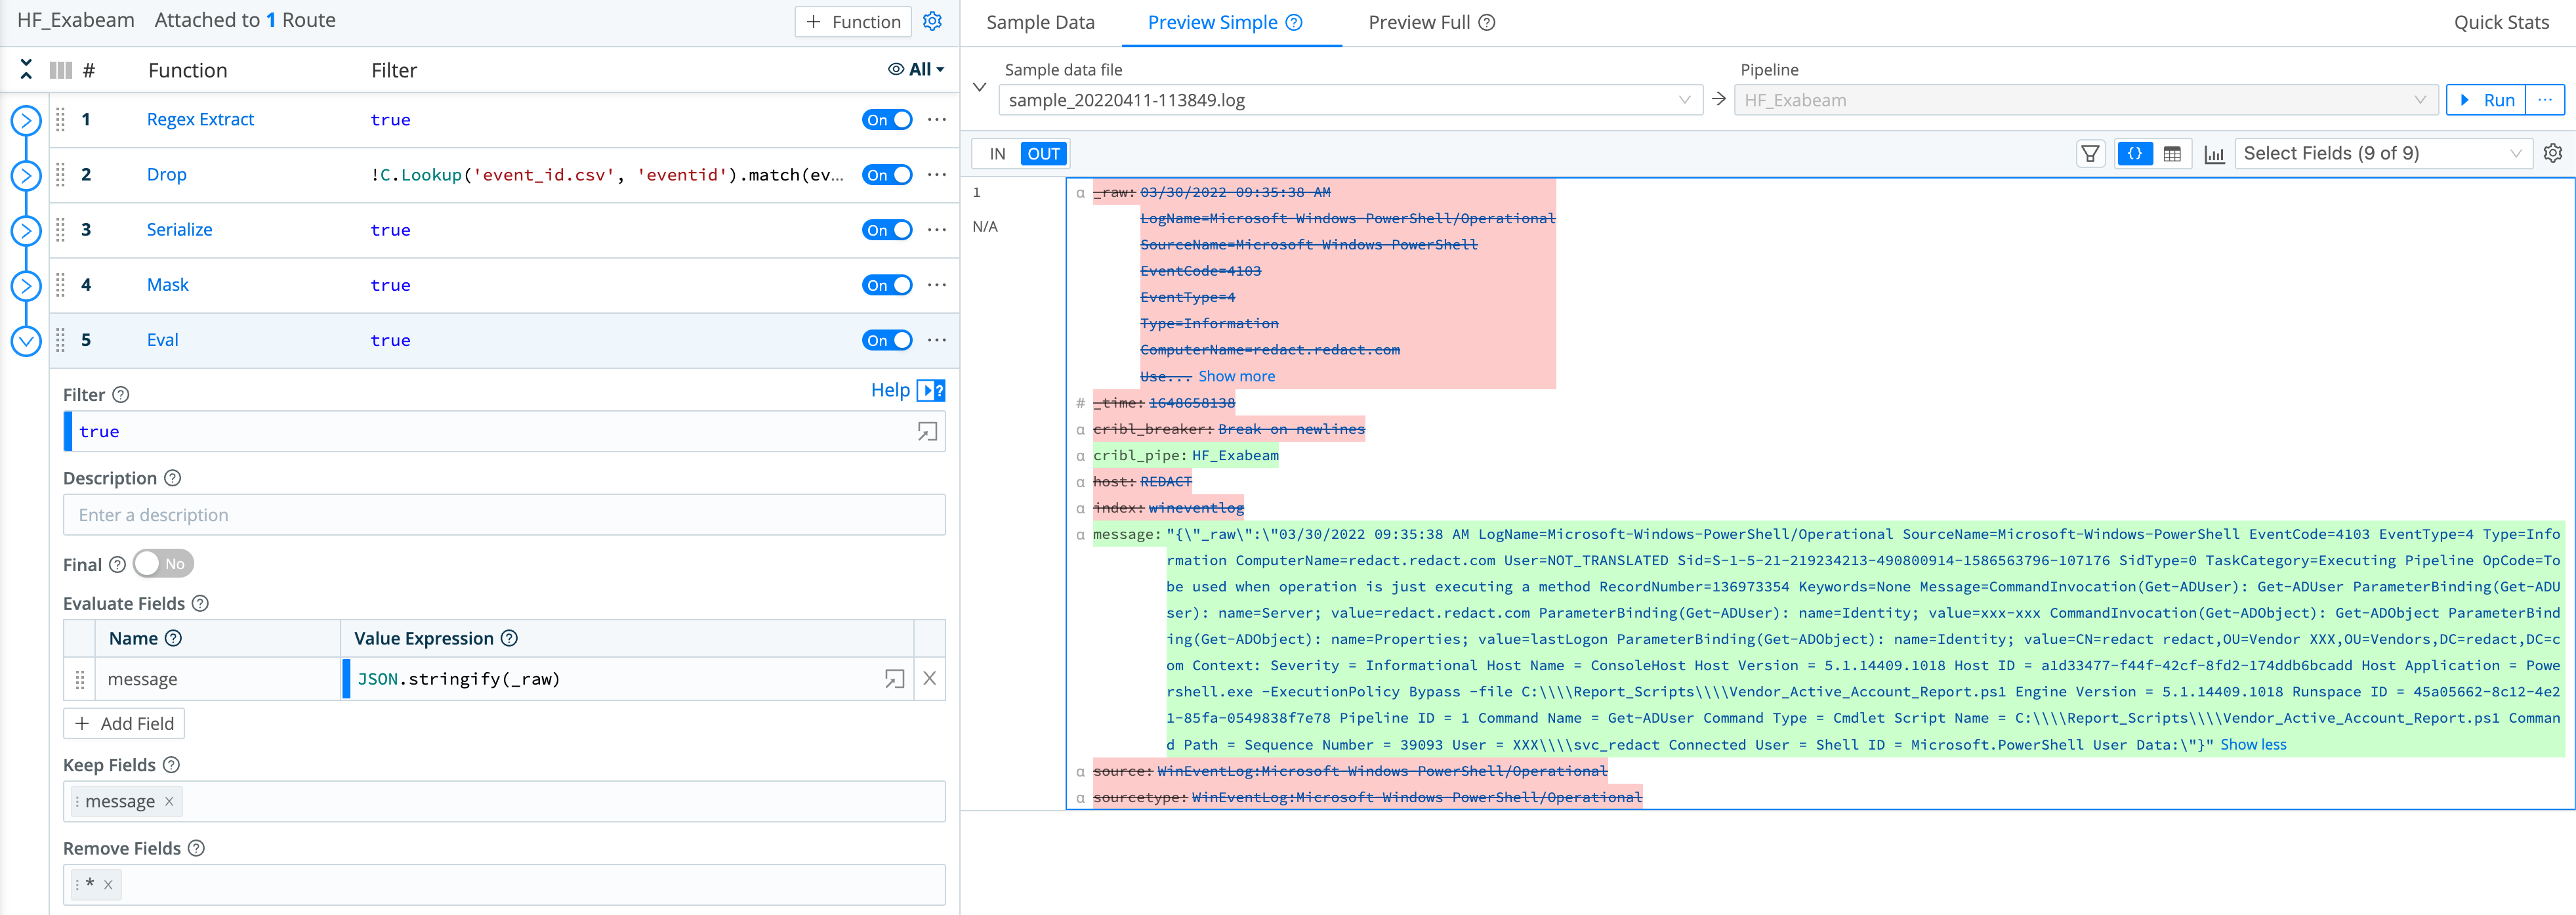
Serialize Function
First, use a Serialize Function to change the event’s format into JSON. Then, remove the extra lines and spaces, because Exabeam treats each newline as a separate event.
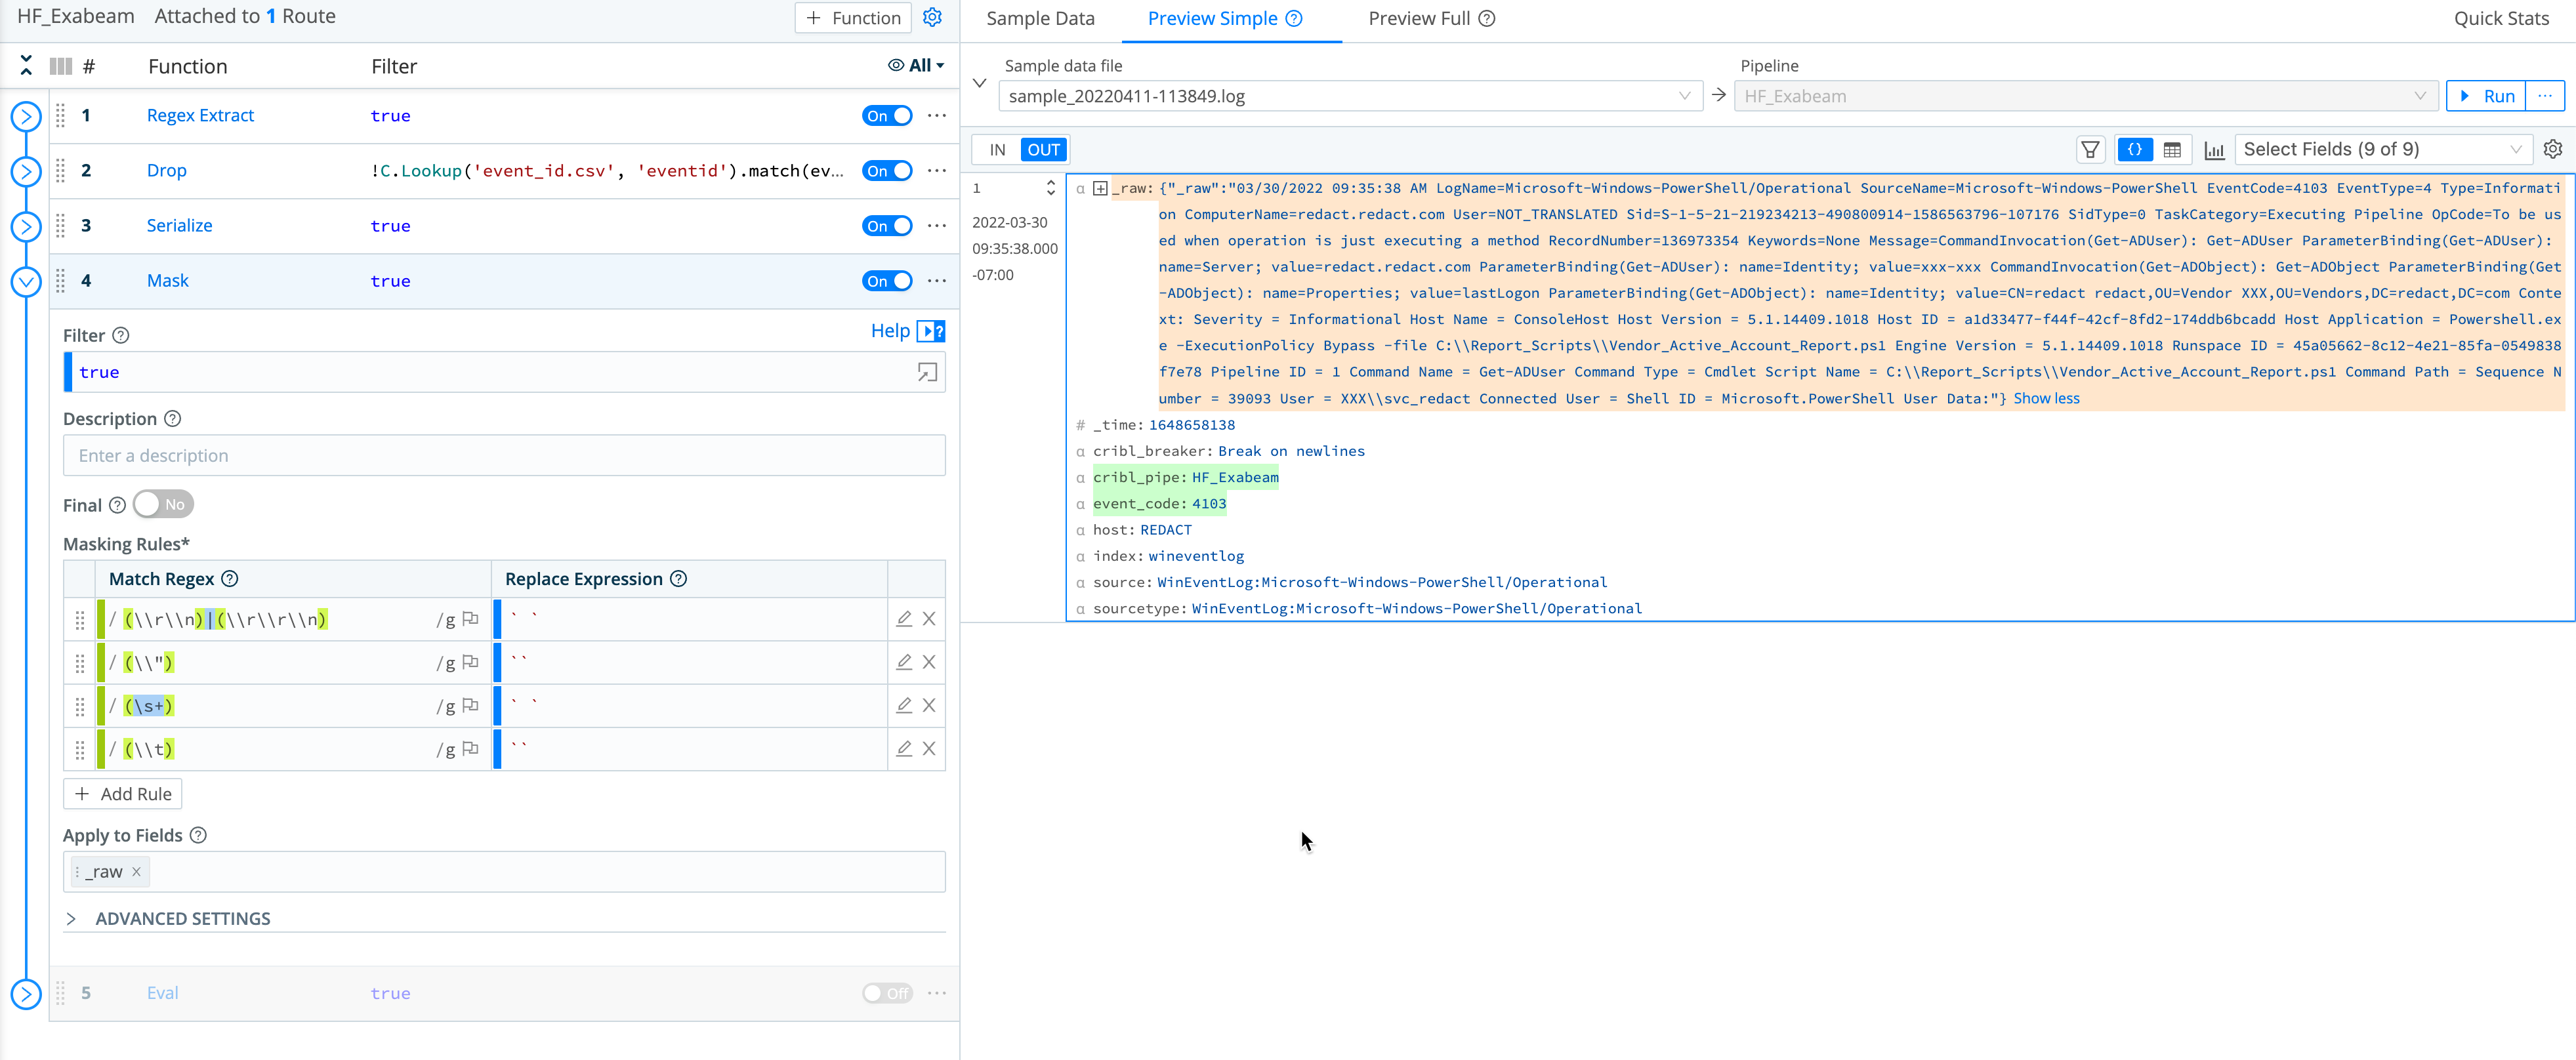
Mask Function
Next, use a Mask Function to remove extra \n and \r characters. (Otherwise, Exabeam’s regex filter would reject the characters and drop whole fields that need to be matched and extracted.)
In this example, we are using a Mask Function to remove these special characters and replace them with spaces.
Eval Function
As the last step in Cribl Stream, use an Eval Function to enrich the outbound events, by adding key-value pair that defines and populates a field conforming to the Exabeam schema. Name the new field Message. (The Message field will populate Raw Message in the Exabeam Data Lake.) Remove everything else using Remove Fields.
Goat the Fields?
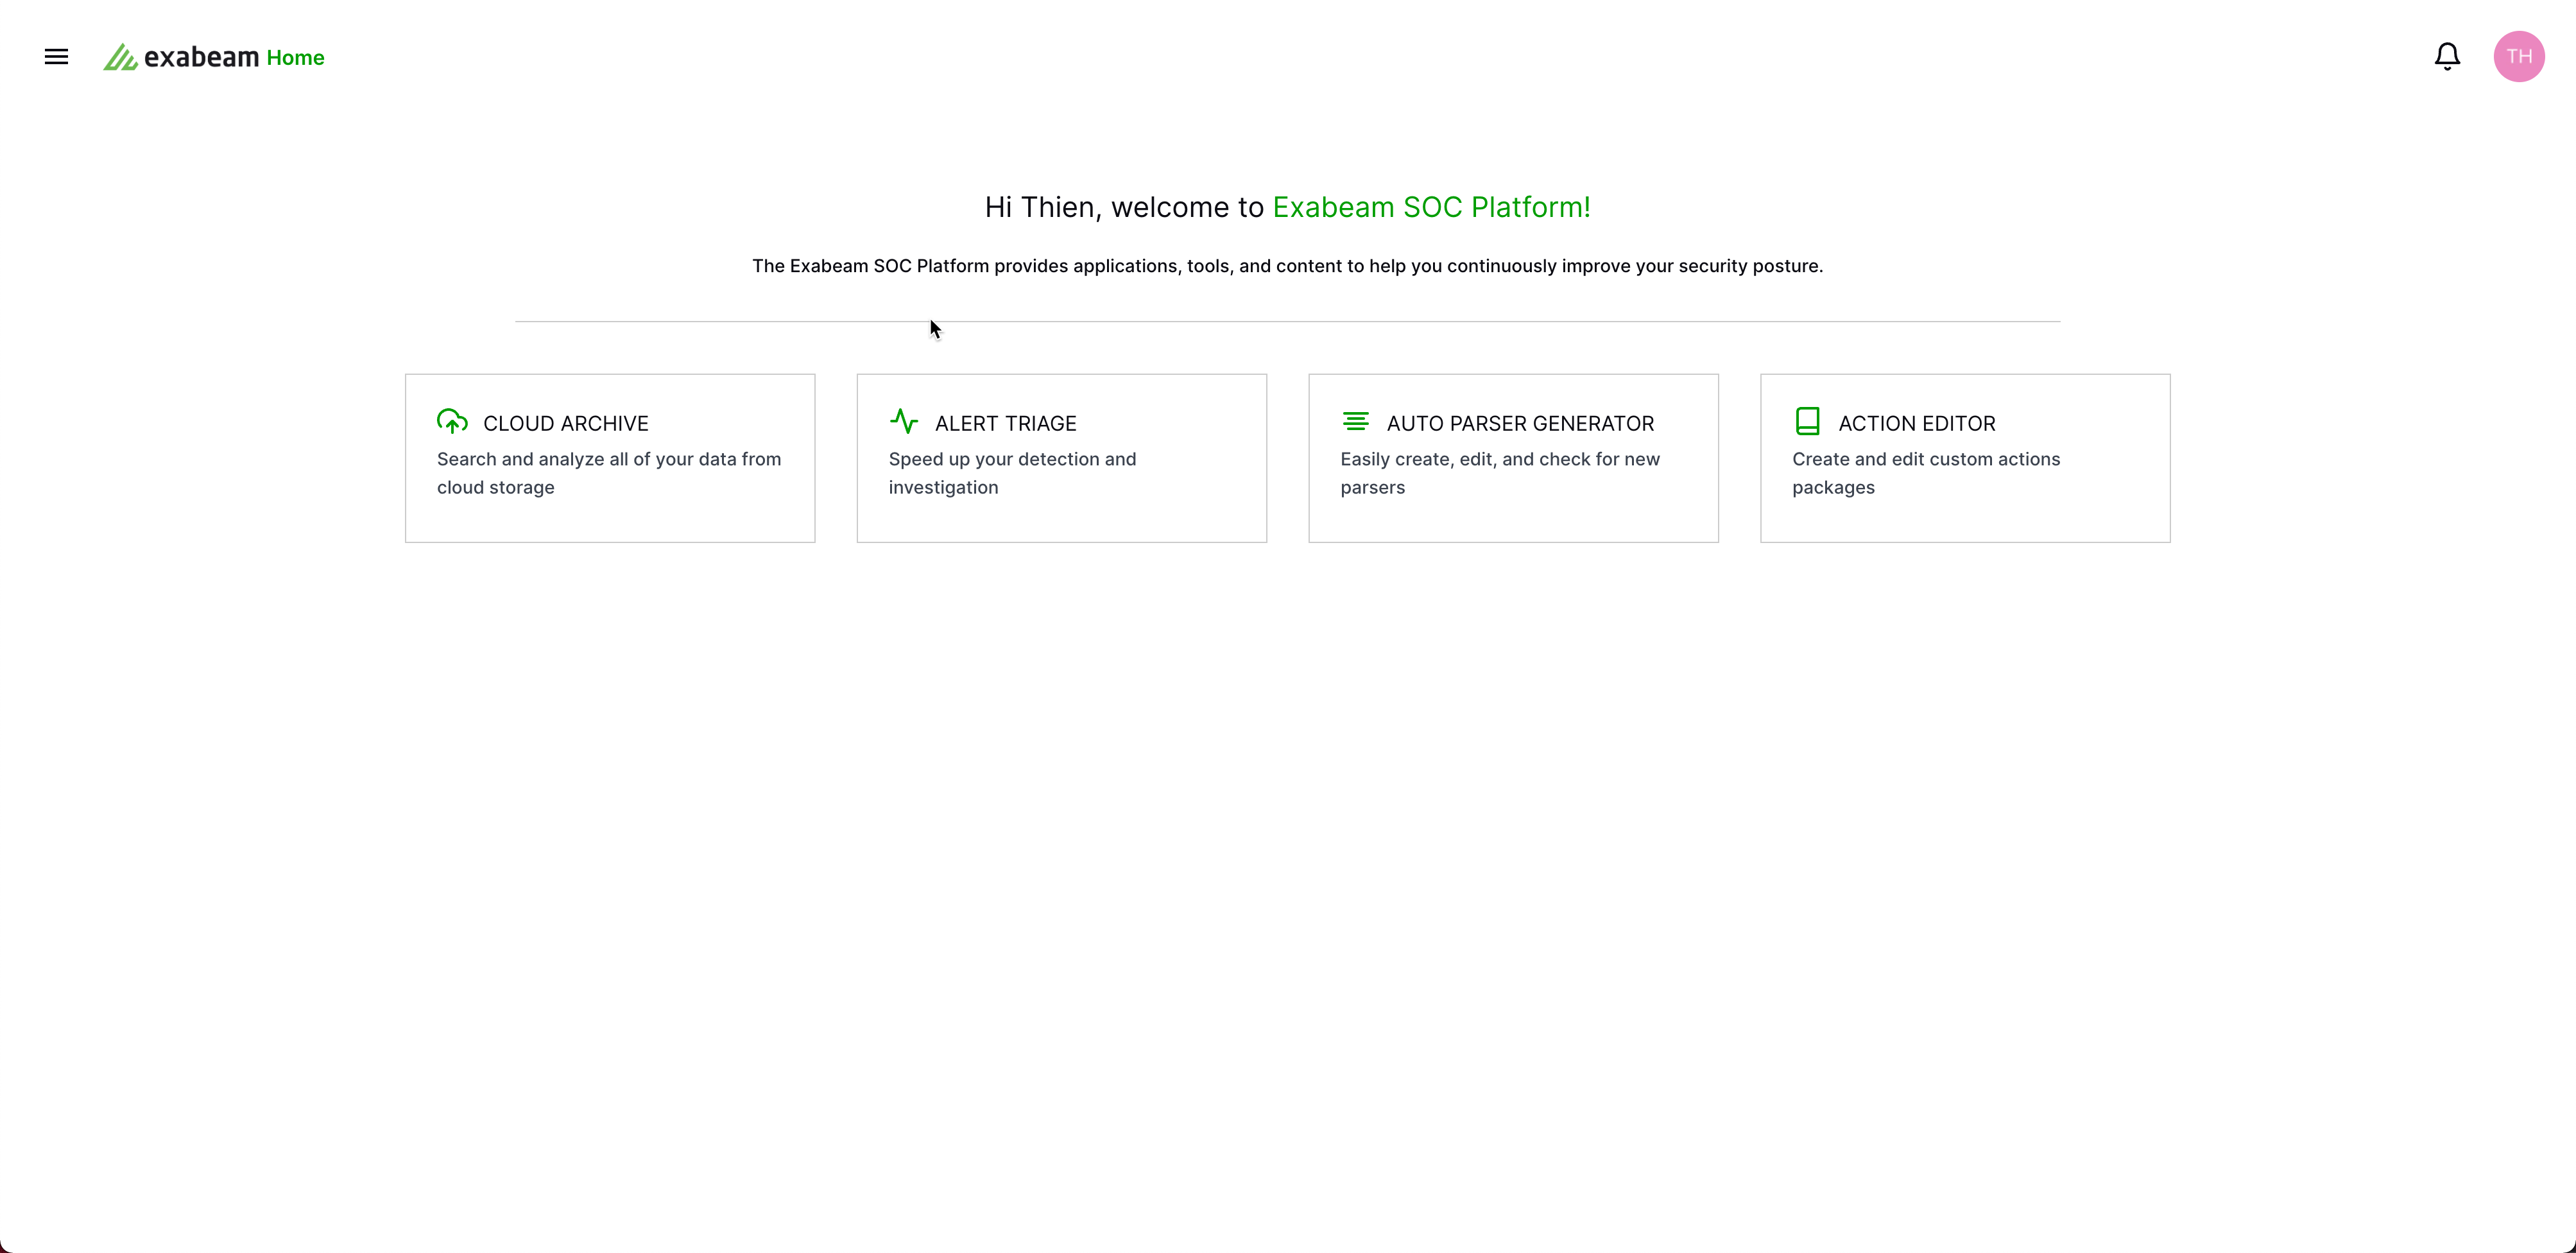
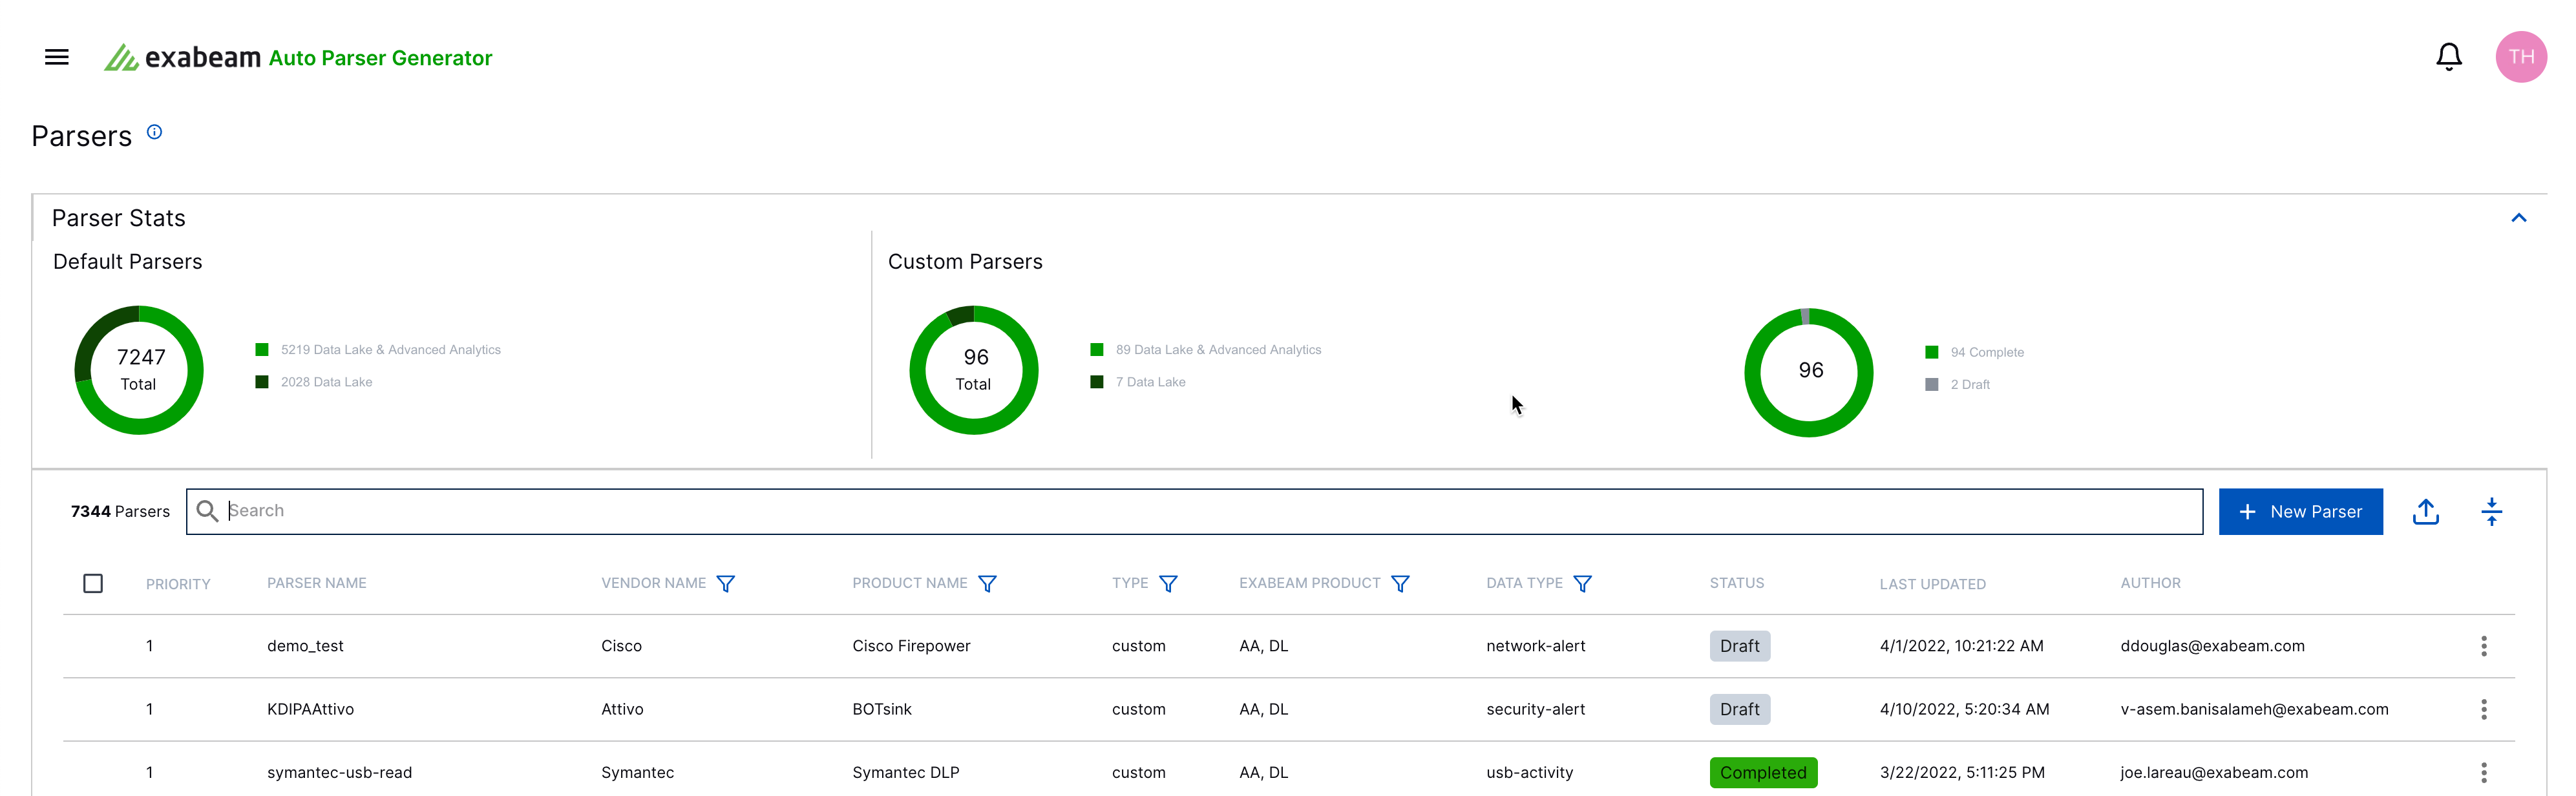
Use Exabeam’s Auto Parser Generator (APG) tool to validate your fields. If you don’t have the APG tool, contact Exabeam support to request access via your ECP account. This tool validates matching parsers based on your event.
In the APG tool, click New Parser.
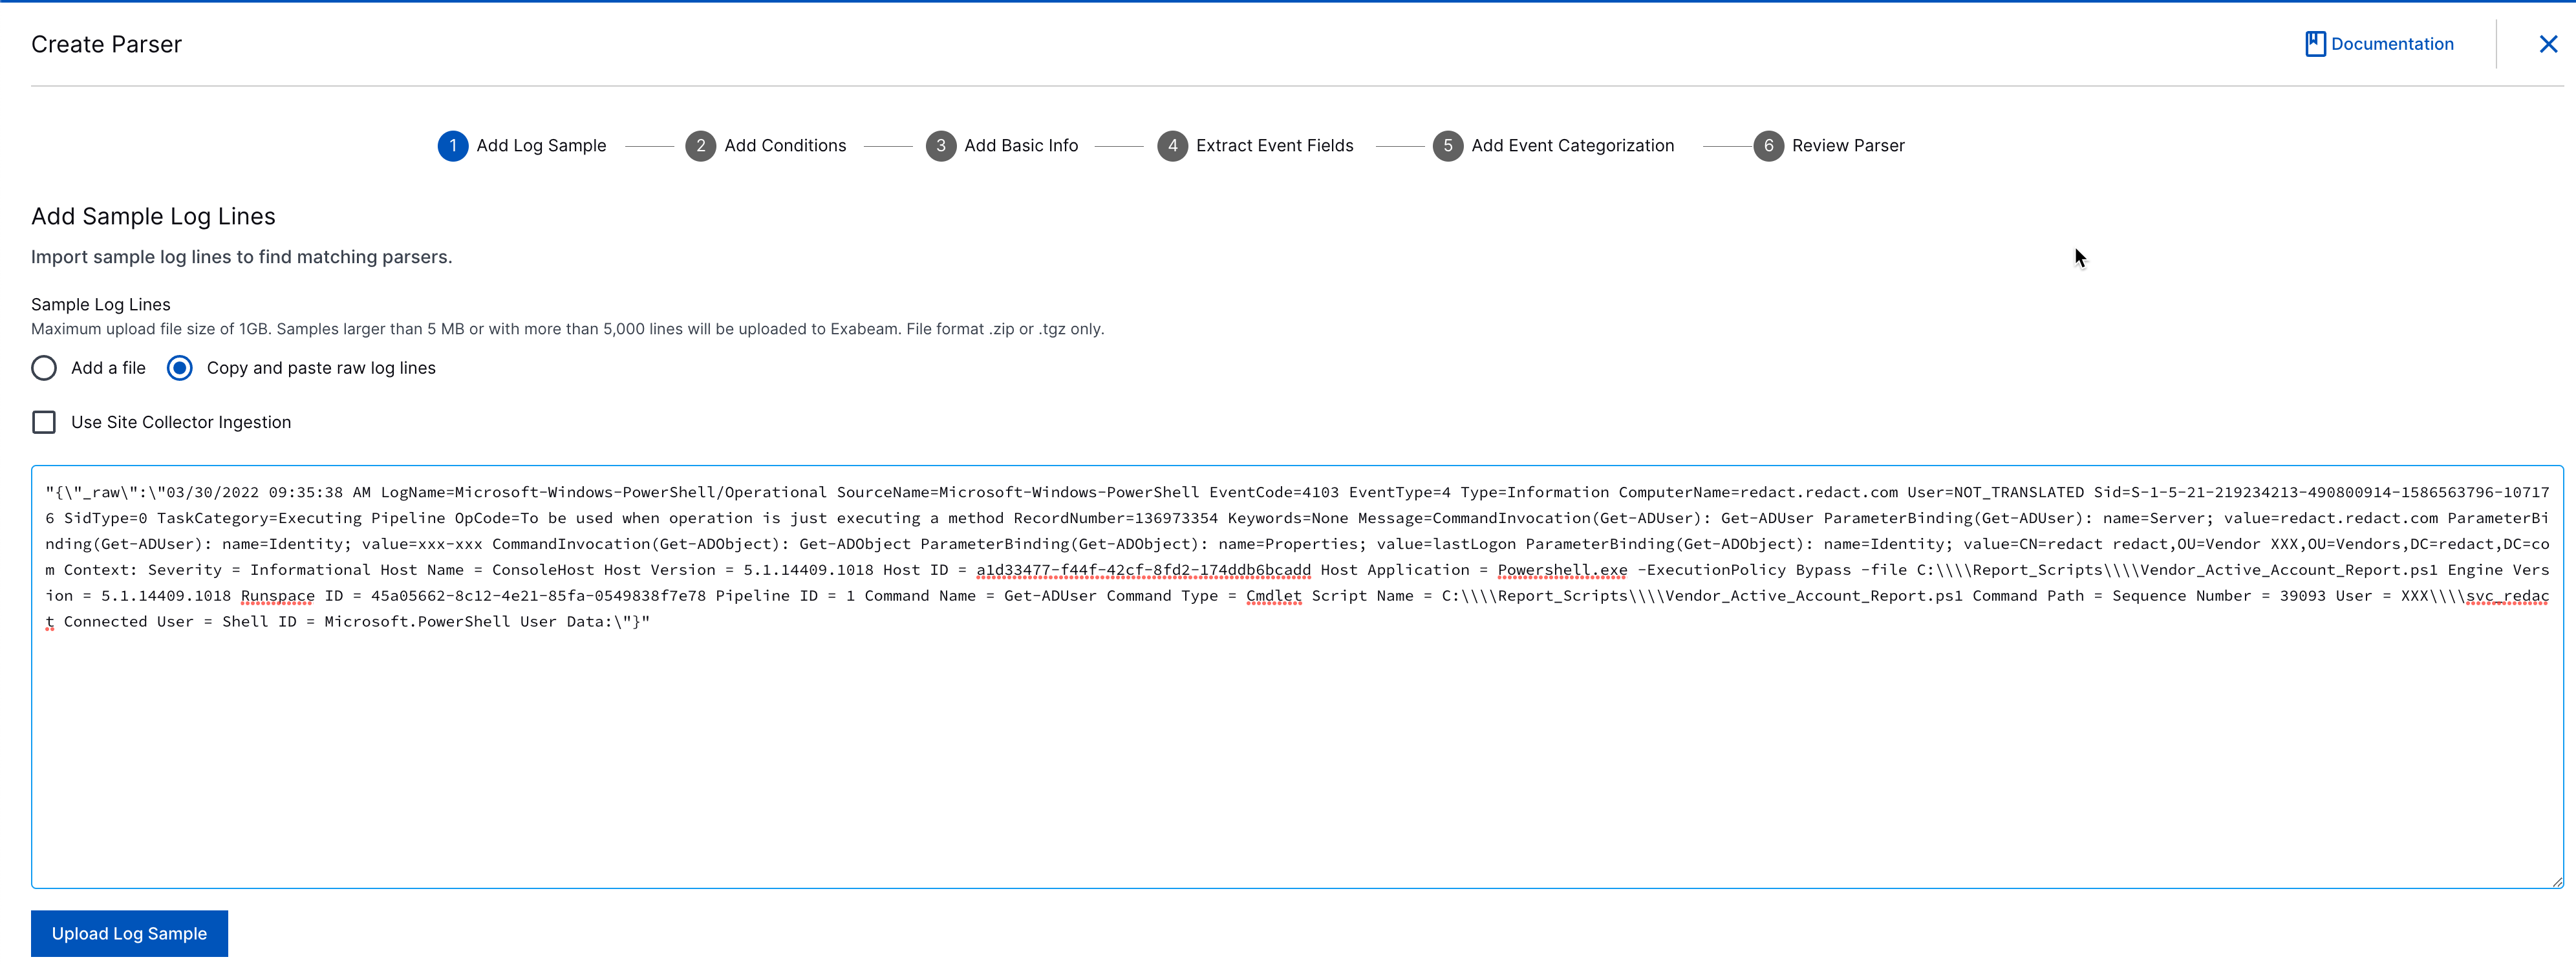
On the Create Parser page, click Copy and paste raw log lines.
In the text box, paste the Message field value from the your sample file and click Upload Log Sample.
Copy the Message* field value to your clipboard for a later step in Stream it to Exabeam.
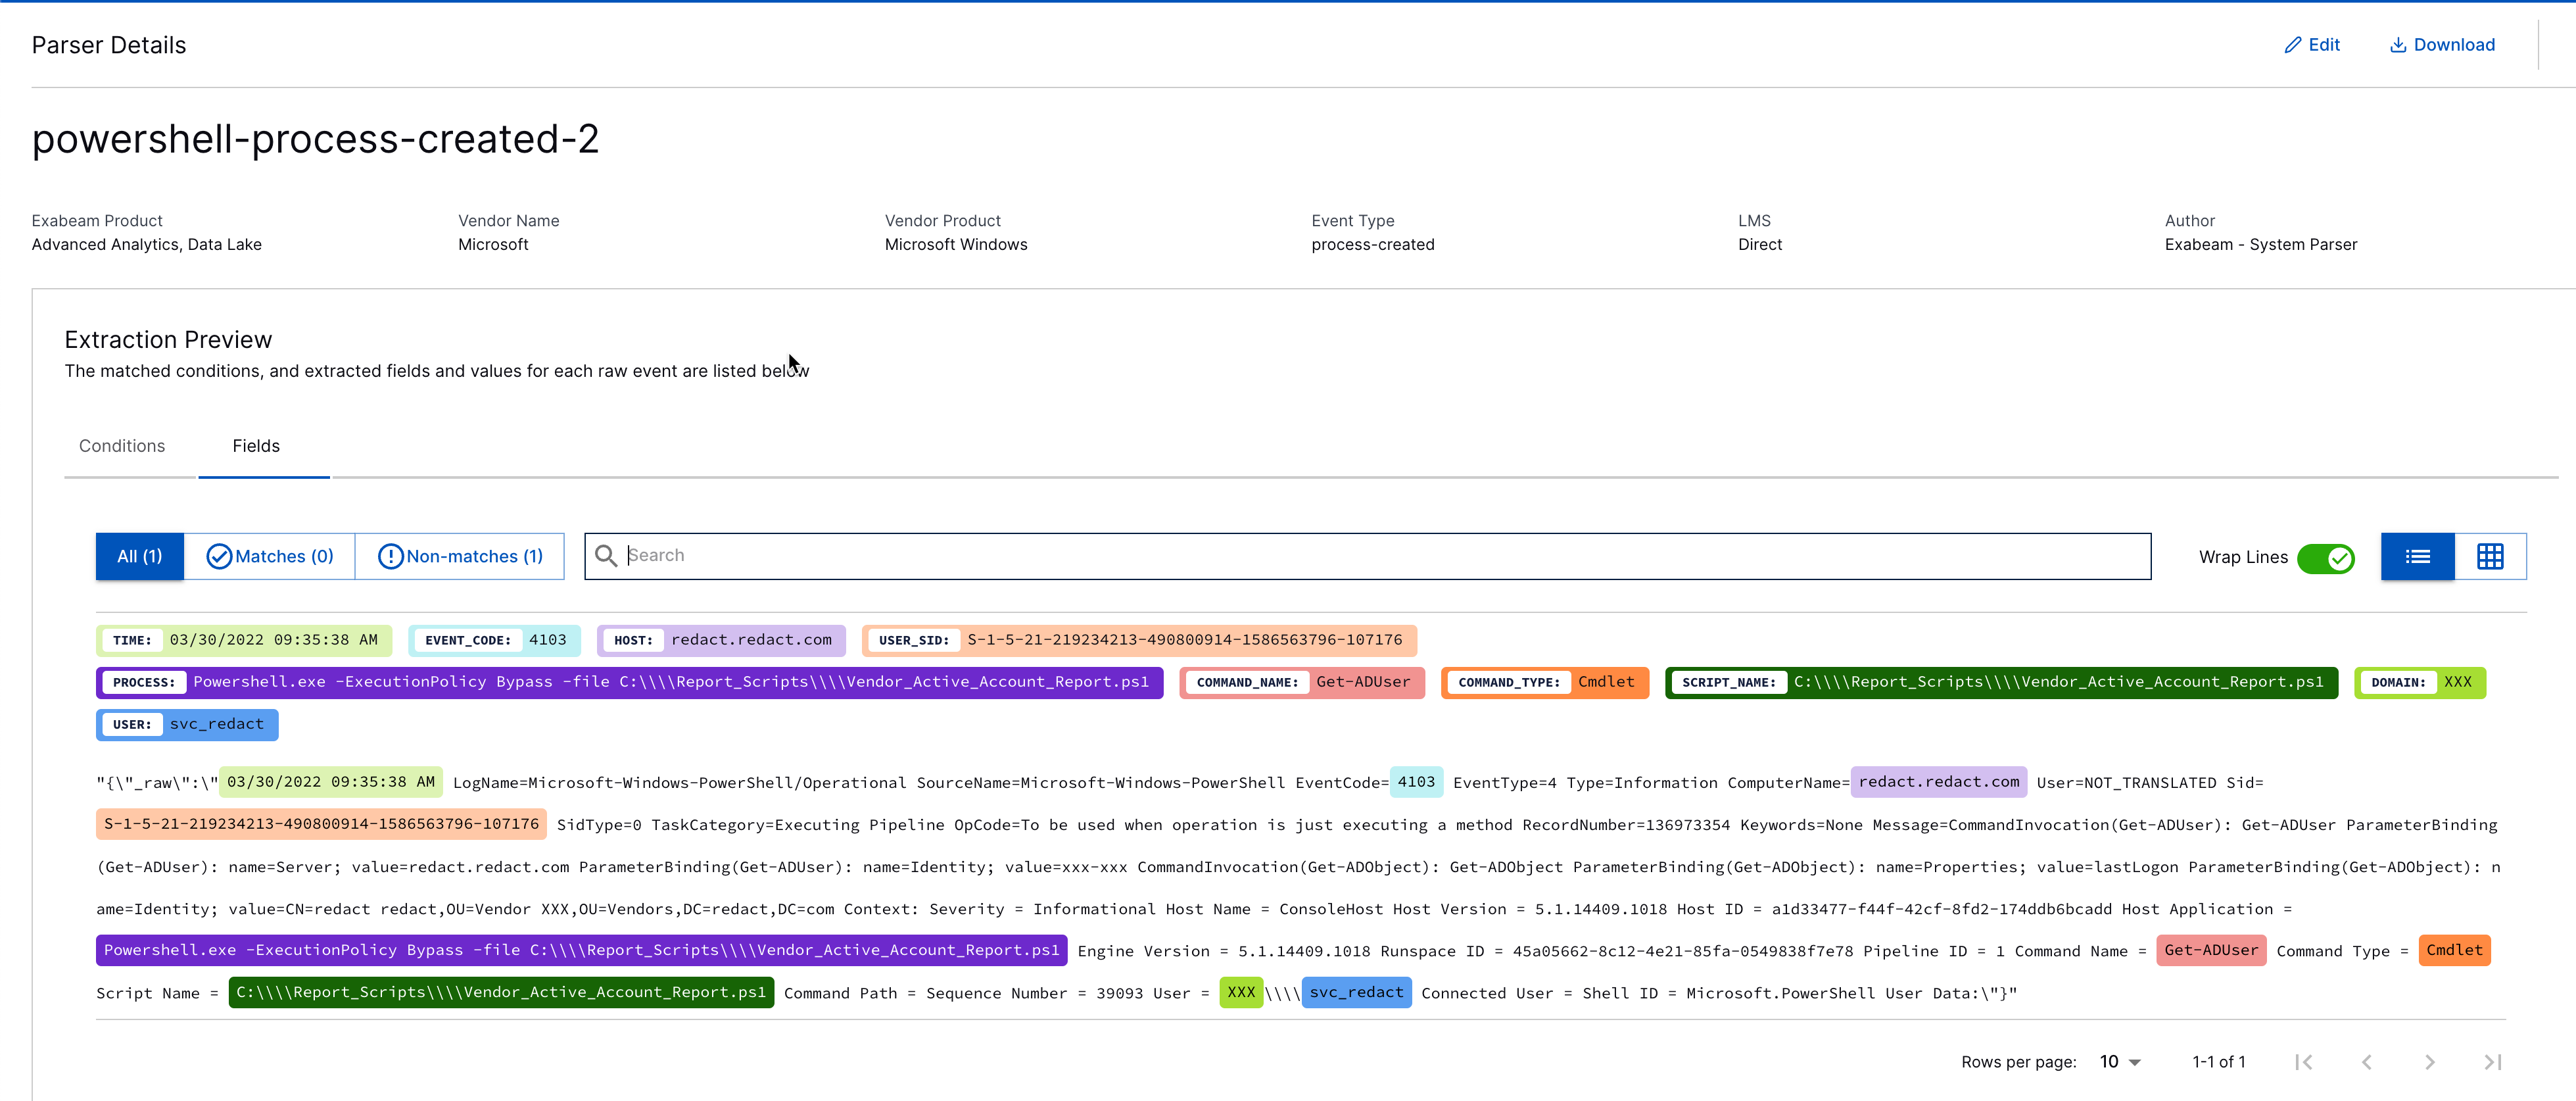
Click View Parsing Details to view parsers matching this event type.
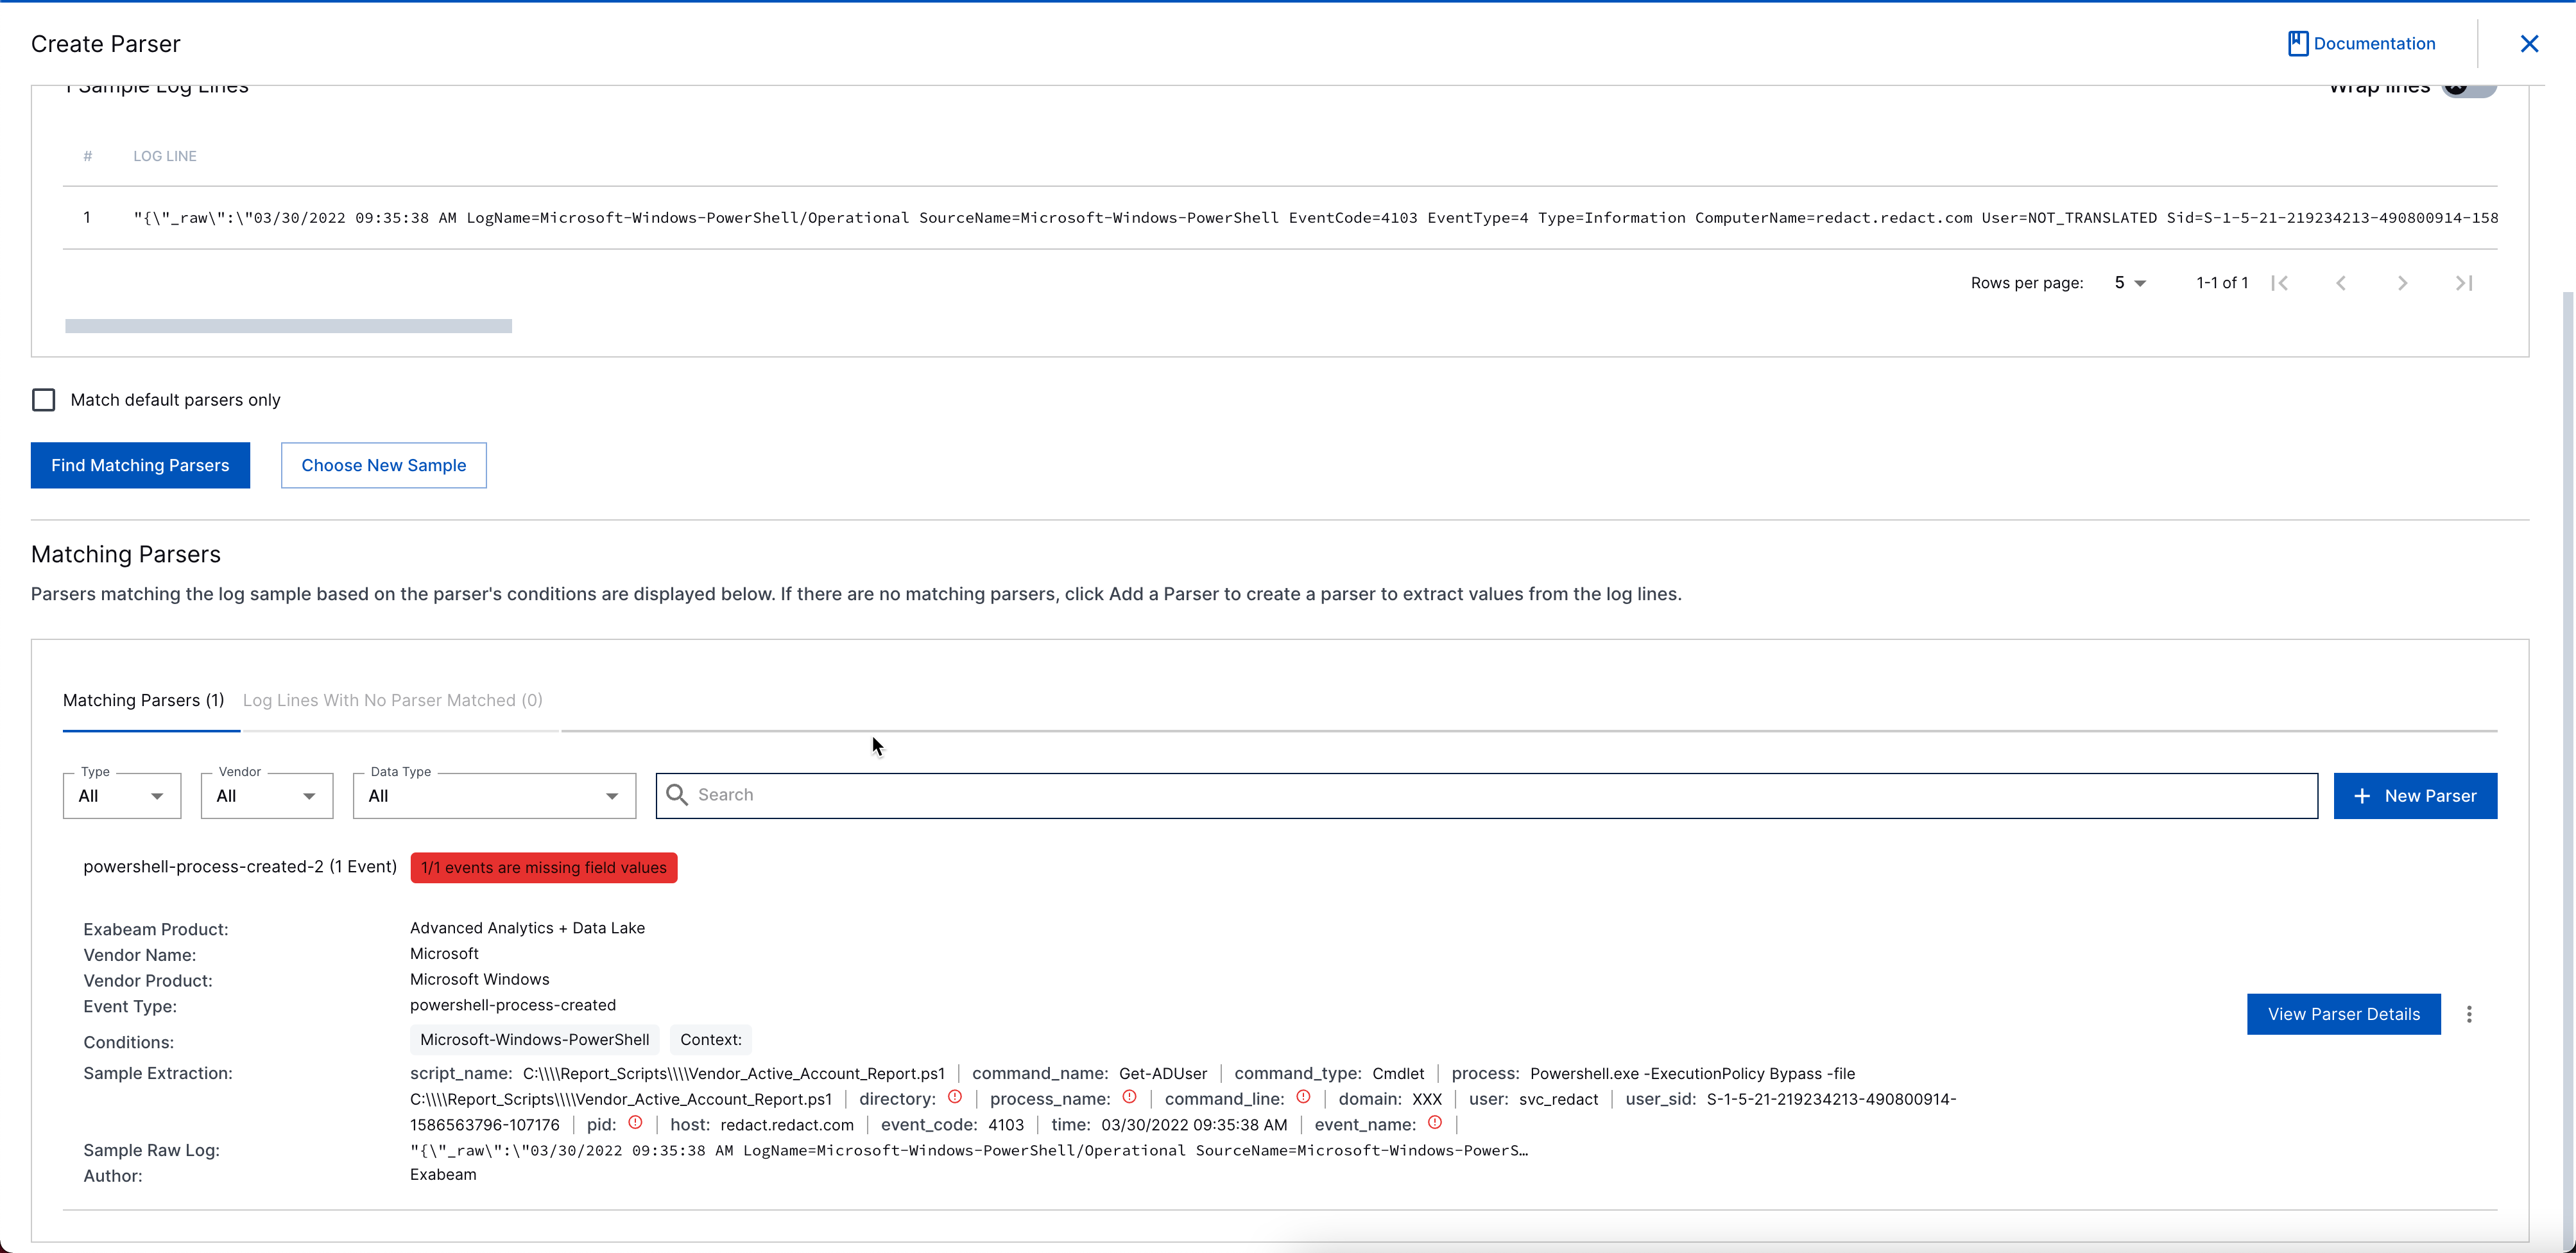
Validate that all the fields you need are populated: src_ip, dest_host, user, etc.
Do not change Field Names in Exabeam (e.g.,
src_iptosource_IP). Exabeam has its own Field Name format that matches its Advanced Analytics template.
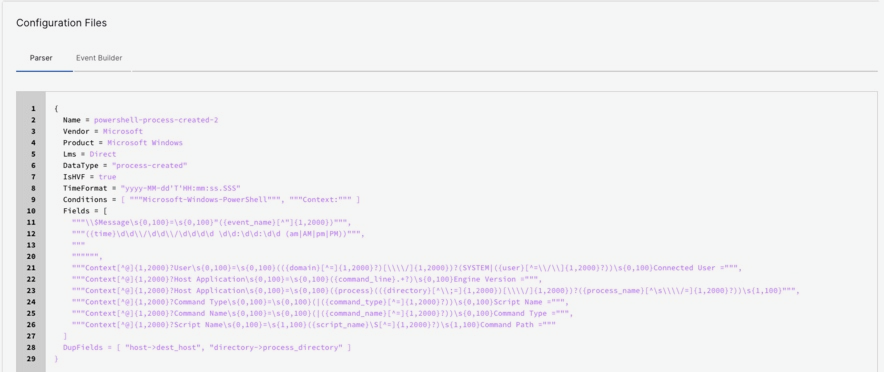
At the bottom of the Extraction Preview page, click Configuration Files to inspect the parsers. If required, you can download the parser to change the regex configurations.
Stream It to Exabeam
Our final test is to send a single event to Exabeam, and validate the results in Exabeam’s Data Lake or Advanced Analytics.
Before testing, configure your Exabeam implementation’s
Asset NameandUsernameto a dummy account. Exabeam’s Advanced Analytics has hundreds of models out of the box, and you do not want to ruin these models while testing out your data.
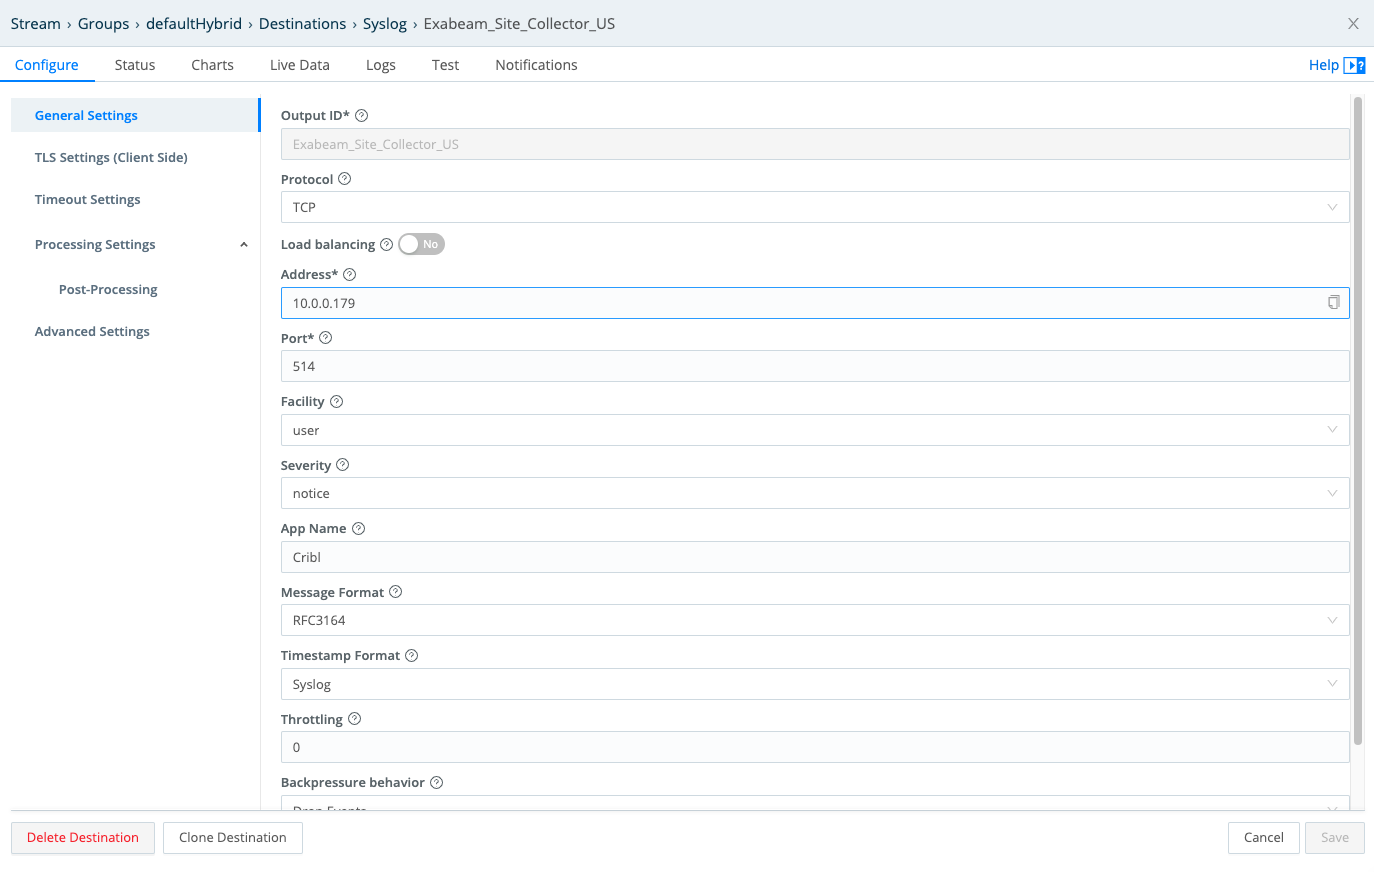
From Cribl Stream’s Manage submenu, select Data > Destinations > Syslog.
Click Add Destination to configure and save a new Syslog Destination to export data to Exabeam.
Configure the Address, Port, Message format, Timestamp format, and other options to match your Exabeam implementation.
- Reopen the Syslog Destination. On its Test tab, copy and paste the Message field’s value you copied onto your clipboard above.
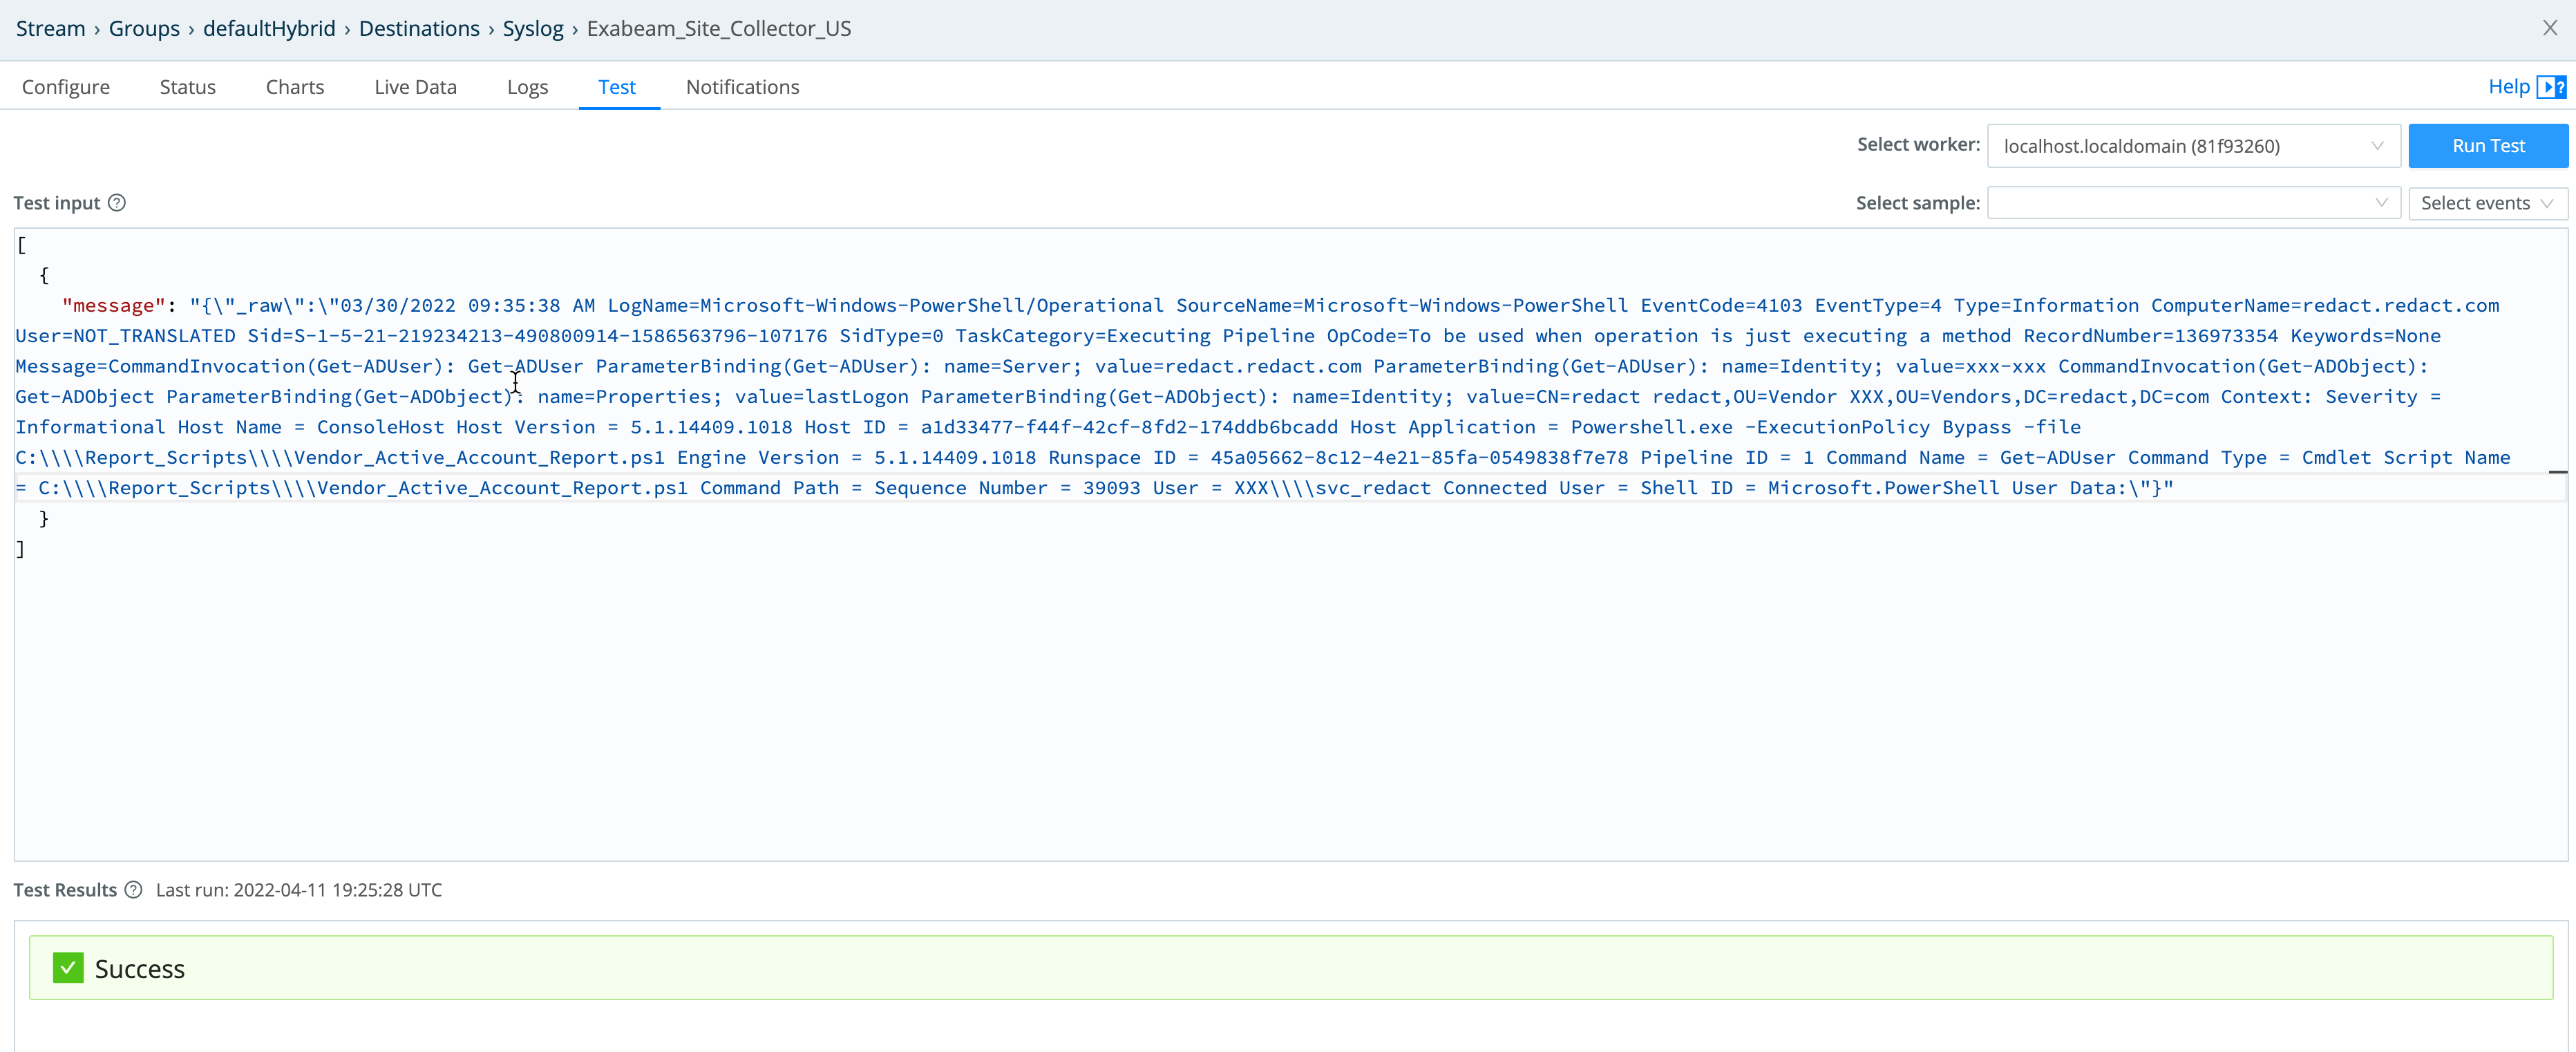
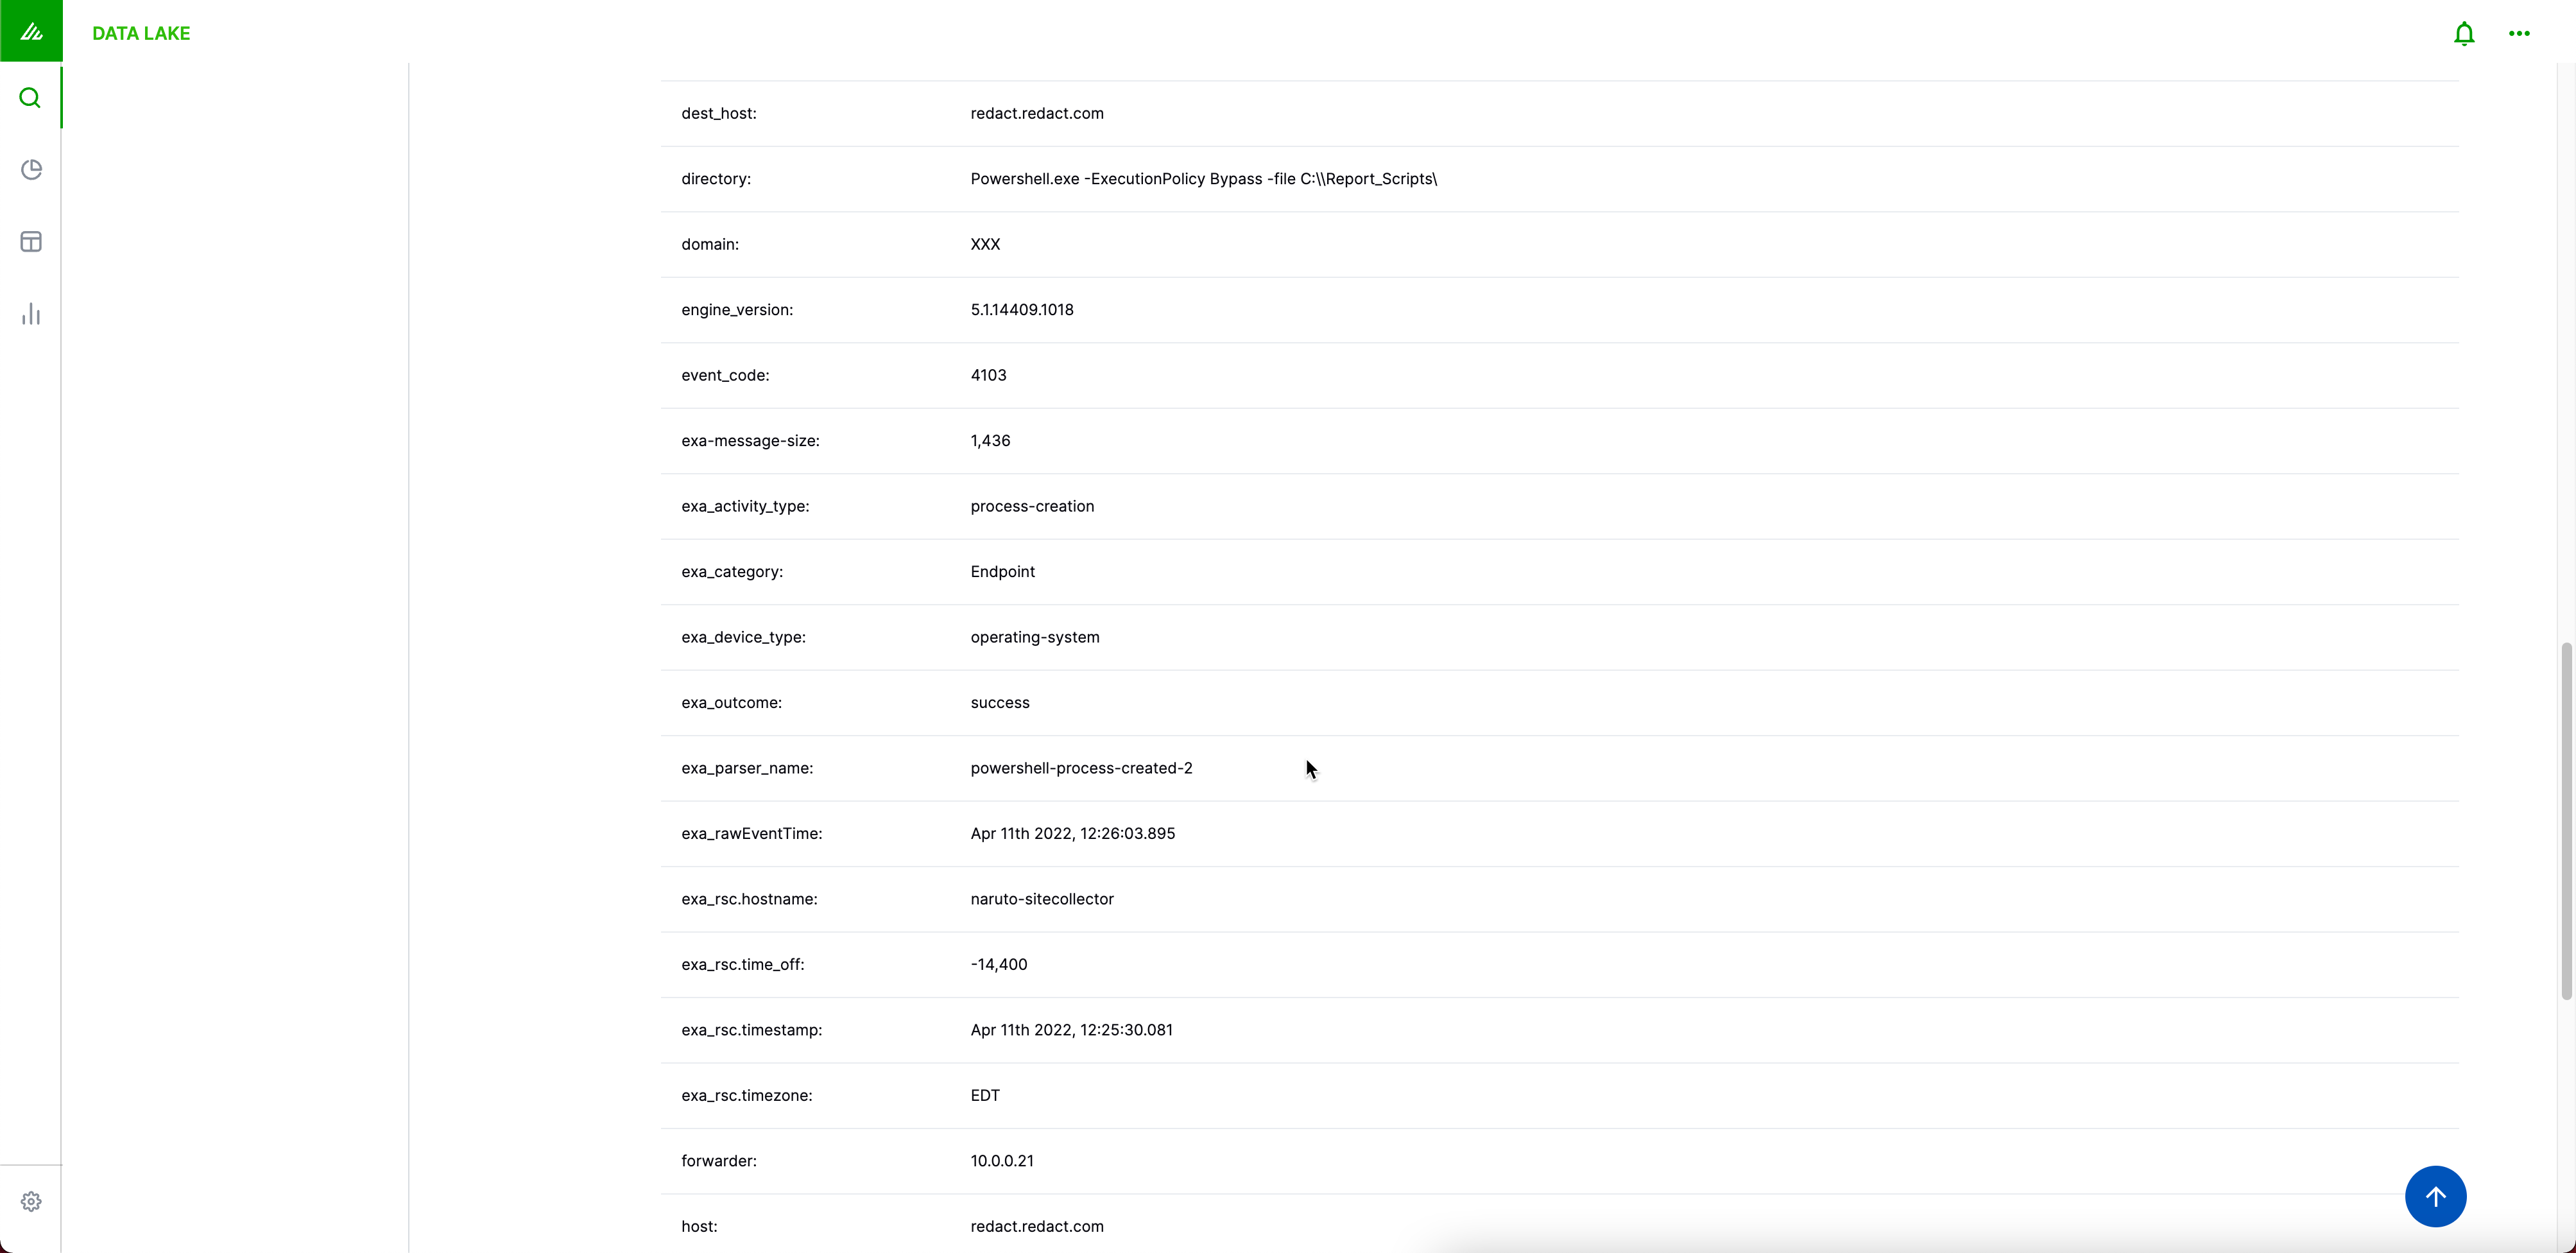
- Within a few seconds, you should see your event display in the Exabeam Data Lake. Search for your forwarder IP/Host (Example syntax:
Forwarder:"IP/host).
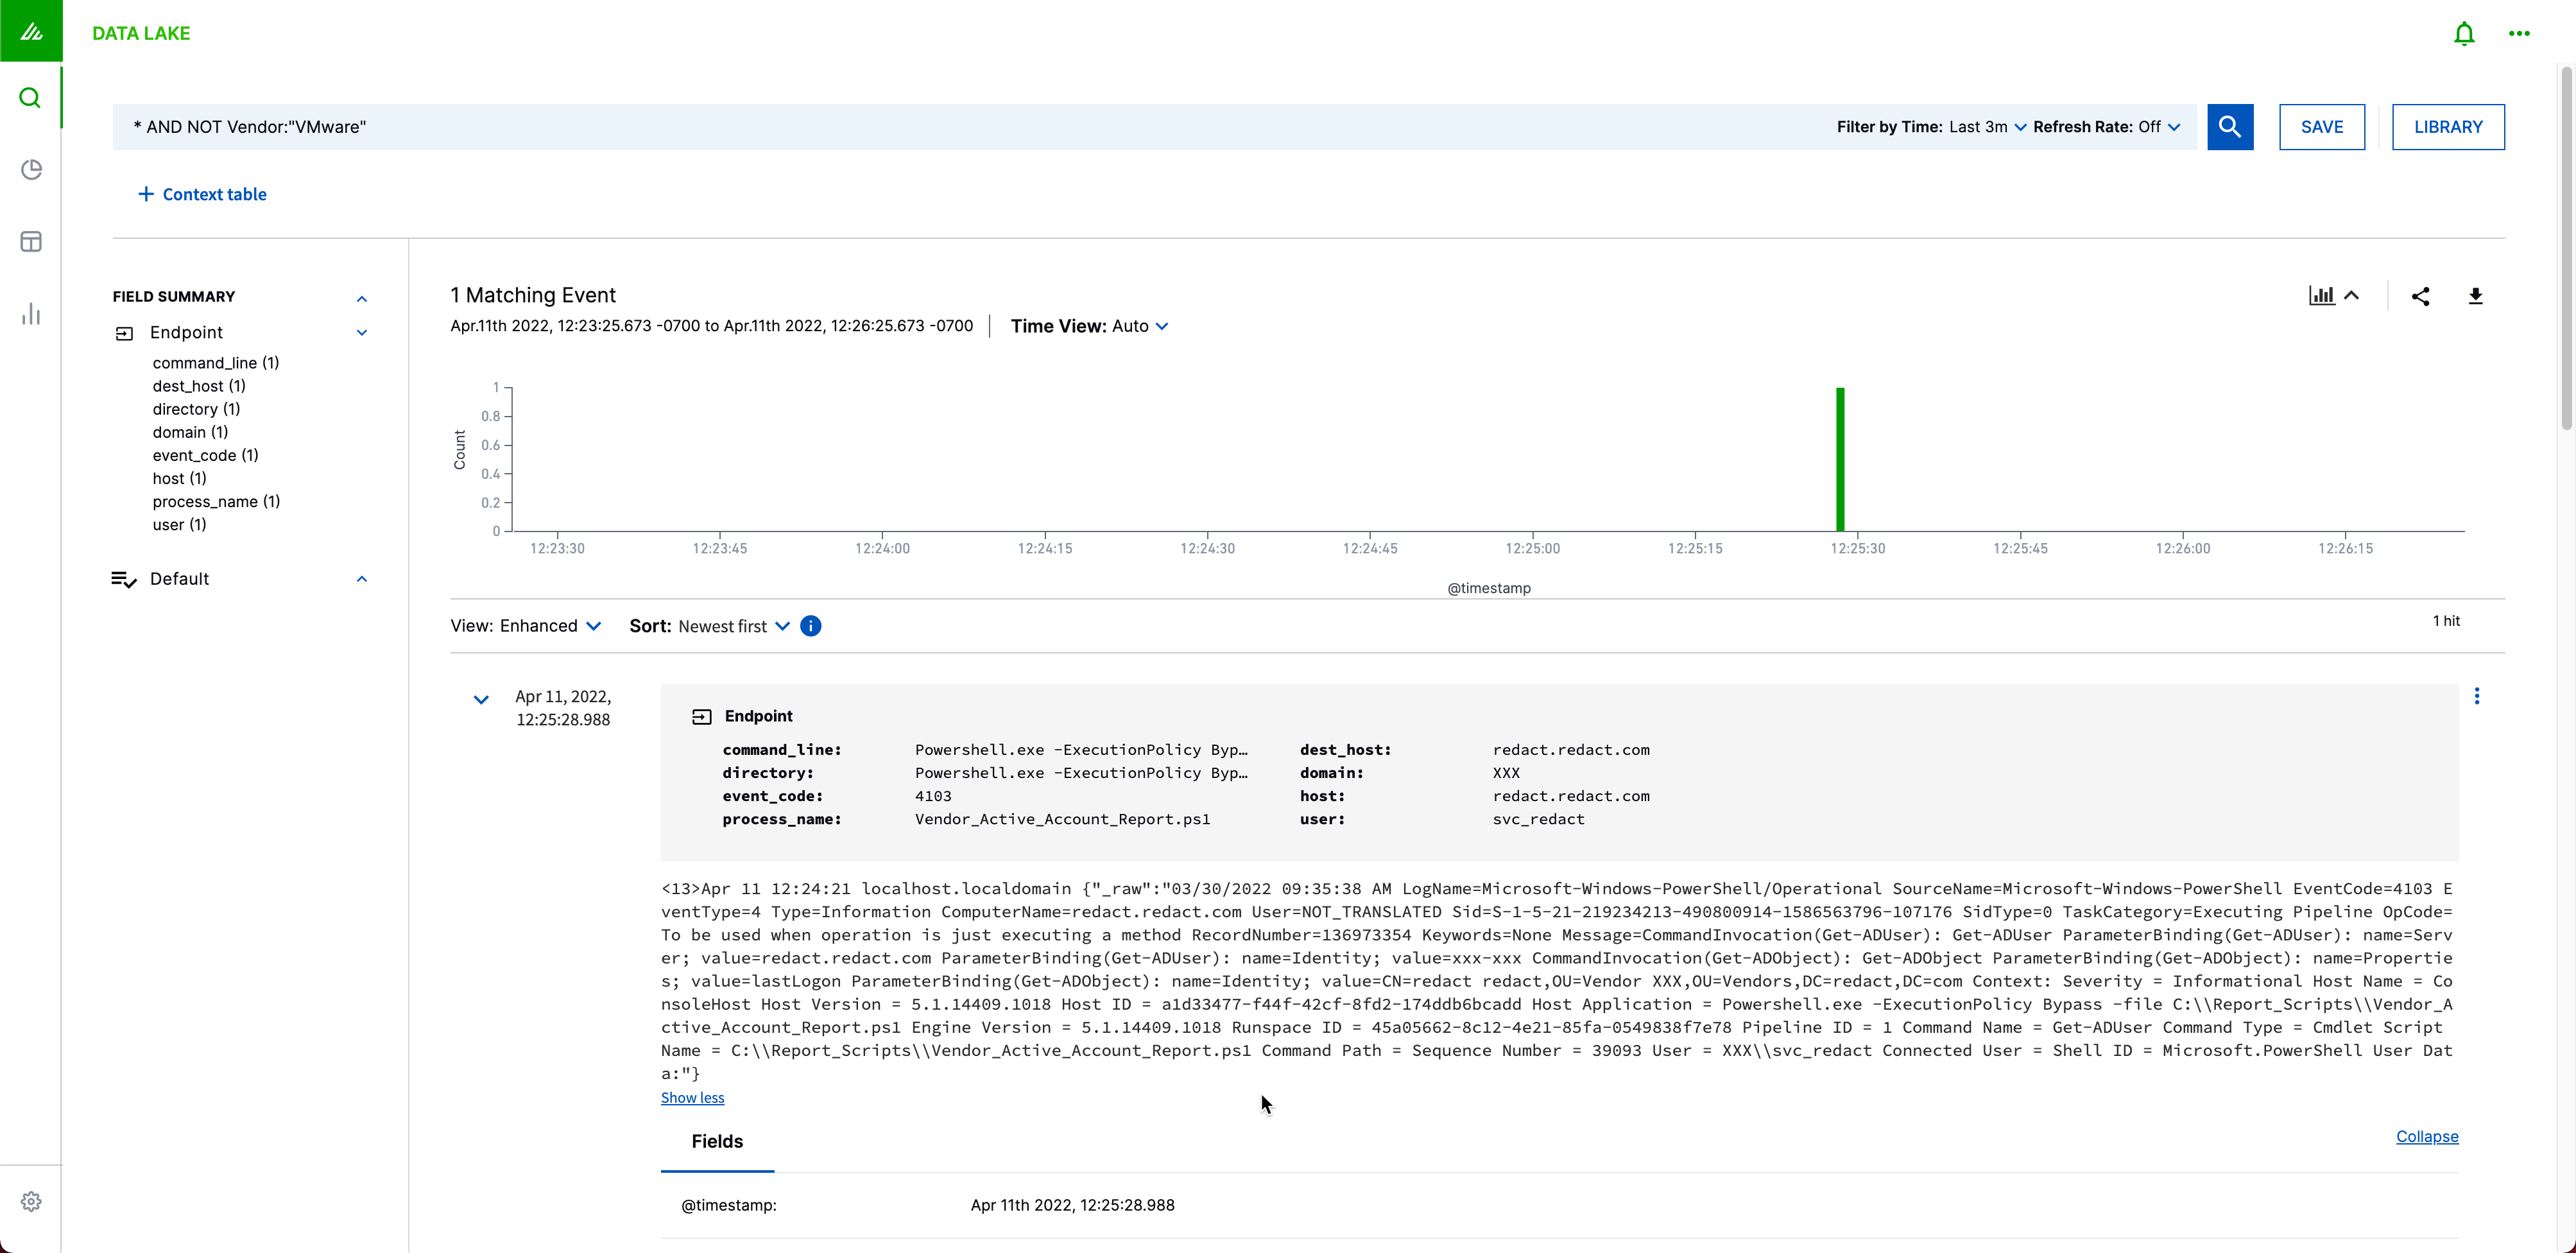
- You can validate that you have the right parser by matching the
exa_parser_namewith the parser in the Auto Parser Generator.