


These docs are for Cribl Stream 4.1 and are no longer actively maintained.
See the latest version (4.17).
Splunk to Elasticsearch
To route data from existing Splunk infrastructure to Elasticsearch services, you might face a daunting task: re-architecting your entire forwarding tier. This could require retooling lots of servers - up to hundreds, or thousands - to uninstall their Splunk forwarders, and swap in Elastic-compatible agents.
Cribl Stream can reduce this effort to just a few hours: Configure one Splunk outputs.conf stanza to output to Cribl Stream, and propagate that across all your Splunk servers. Done!
Next, you can easily configure Cribl Stream to listen for Splunk data on one port, and to route that data to all the Elasticsearch destinations you want to feed.
Transforming Data from Splunk to Elastic Format
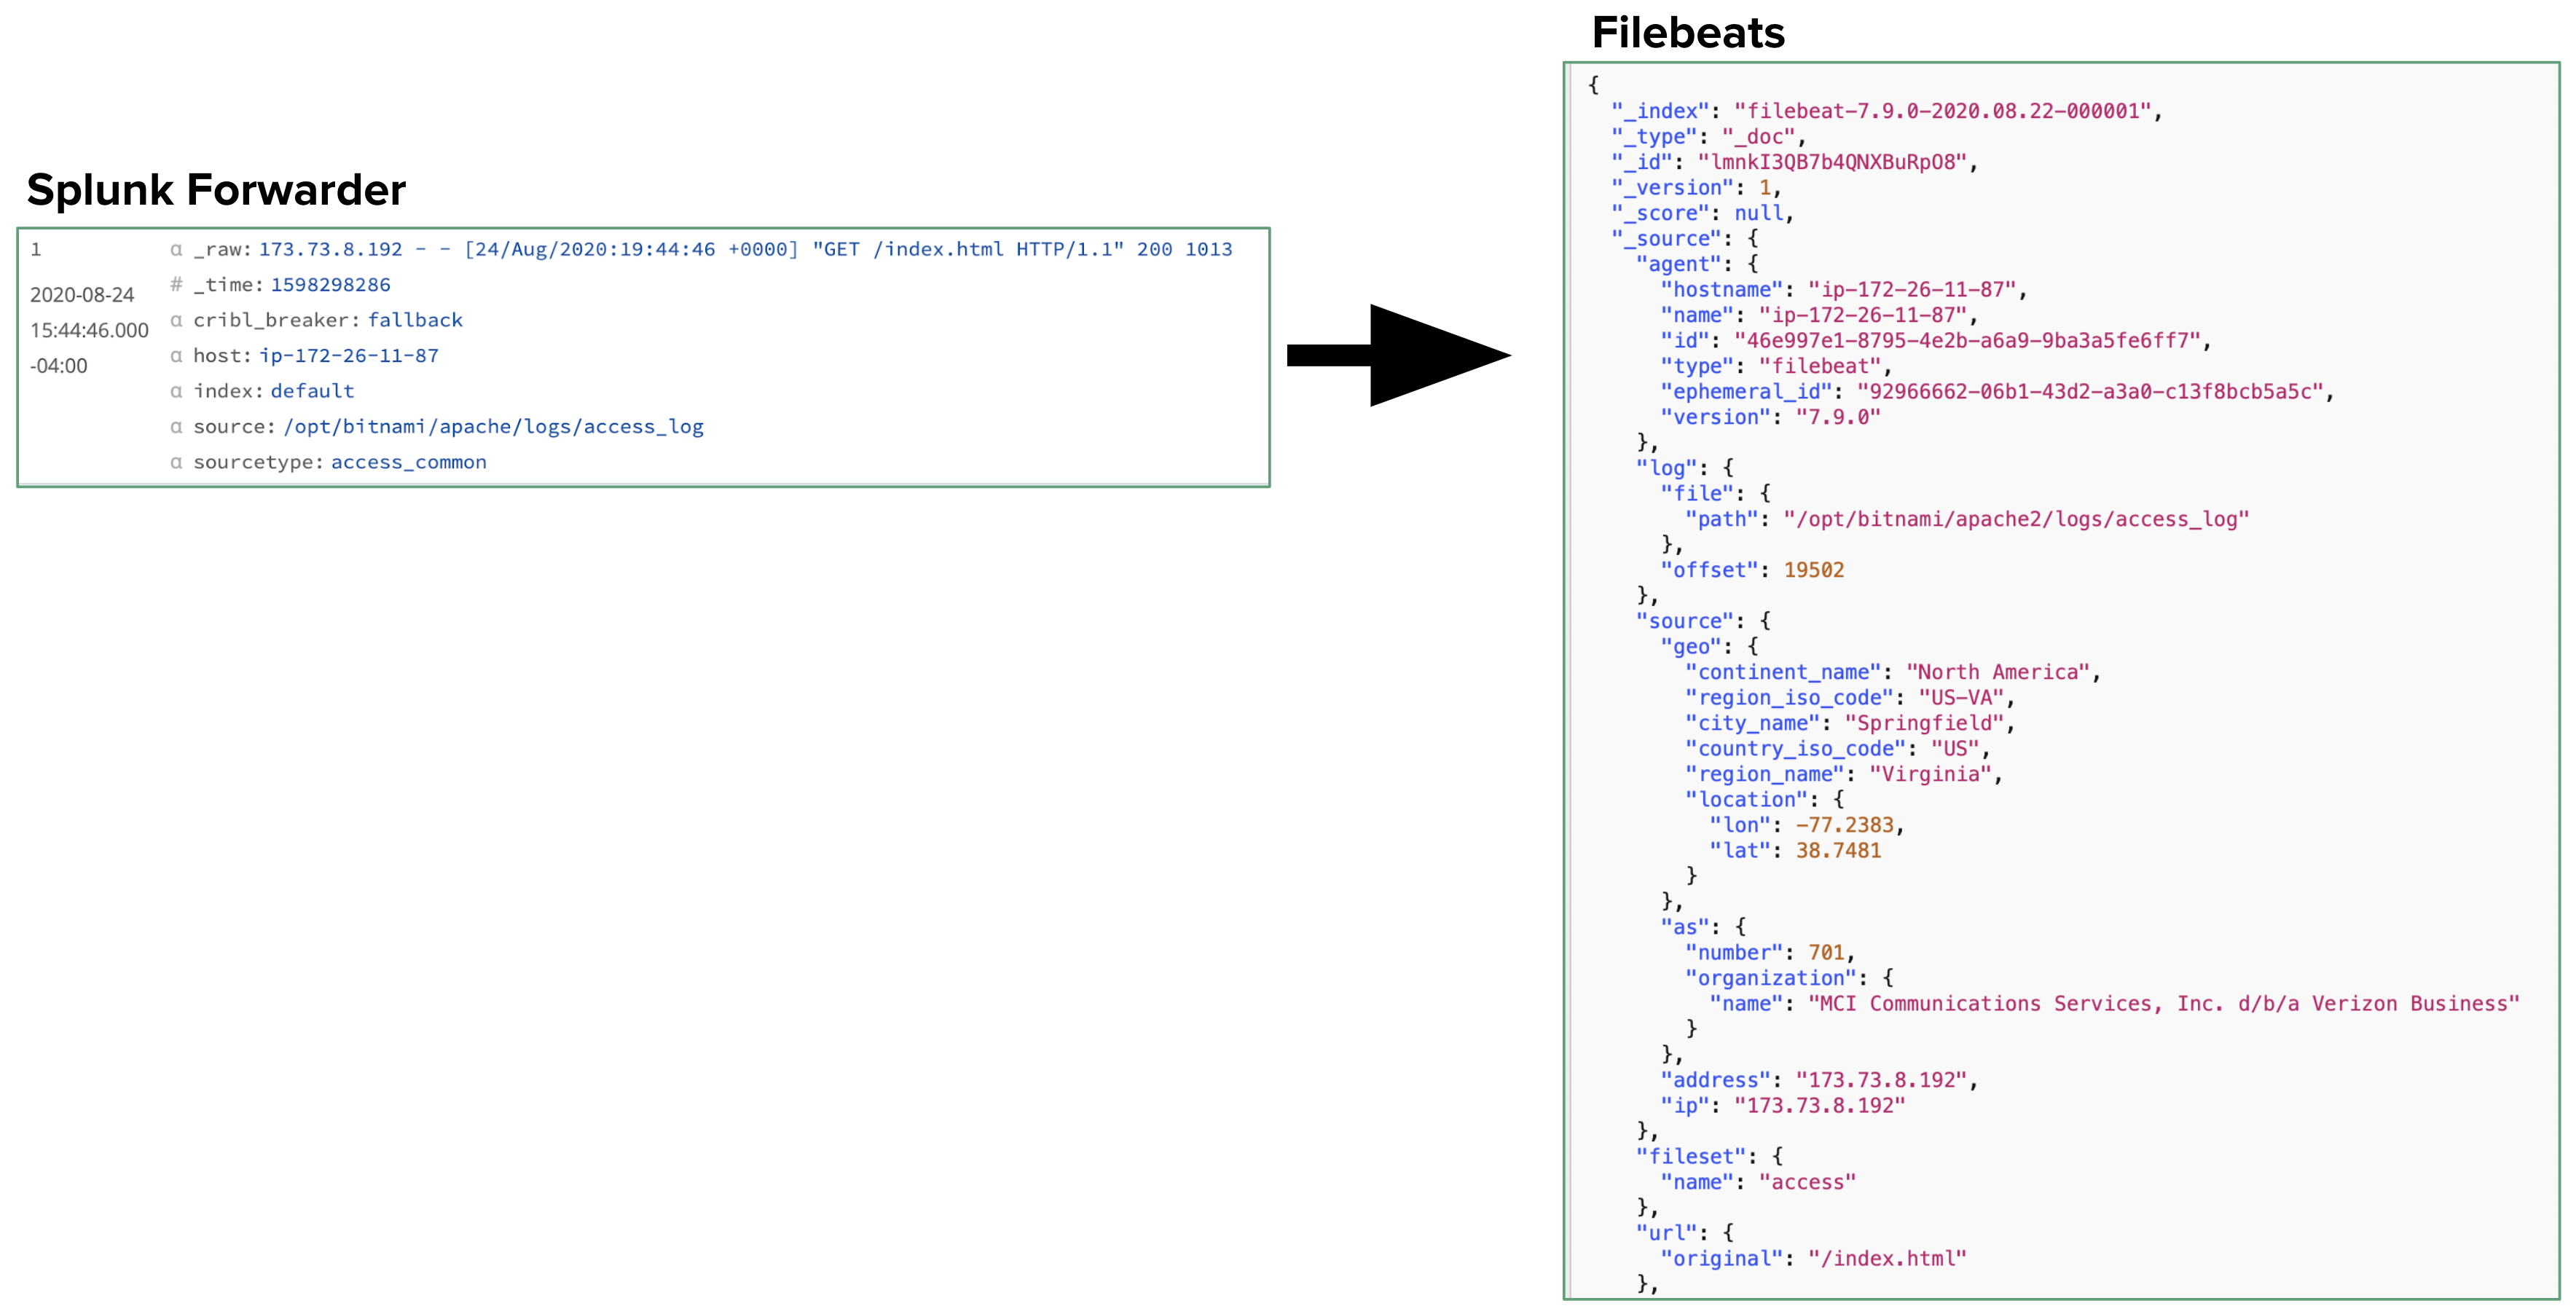
Also, in Cribl Stream’s core, you can easily design a Pipeline that modifies the original Splunk event into Elastic’s Common Schema - making it look exactly like an event generated by an Elastic agent. These transformations help you make the most of Elastic’s offerings, like Filebeats, etc.
Some of the Cribl Stream Functions useful in transforming Splunk-generated events into Elastic’s format are:
- Regex Extract: Extract a portion of the raw event, and place it into a specified field.
- Lookup: key off the host IP to add fields like
hostname,name,id, andtype. - Eval: Turn key-value pairs into nested JSON objects.
- GeoIP: Correlate source IP to a geographic database.
We’ll show all four in our example Pipeline below, although you might need only a subset.
Goat Rid of Some Guesswork
Cribl Stream will offer you further time savings as you configure the internal data transformation. Cribl Stream’s Data Preview features enable you to test transformations’ results as you build your Pipeline, before you commit or run it.
This eliminates blind guesswork in Splunk configuration files to specify source -> index transformations, check the results, and then start all over again. In particular, Cribl Stream’s Regex Extract Function provides a regex101-like UI, to facilitate precisely designing and debugging your regex expressions.
Let’s goat started on the example.
Configure Splunk Forwarder
First, in a Splunk App, configure a Splunk forwarder (UF or HF) to specify your Cribl Workers as destinations. Use outputs.conf stanzas of this form:
[tcpout]
disabled = false
defaultGroup = cribl, <optional_clone_target_group>, ...

[tcpout:cribl]
server = [<cribl_ip>|<cribl_host>]:<port>, [<cribl_ip>|<cribl_host>]:<port>, ...
sendCookedData=truePush the app using the deployment server.
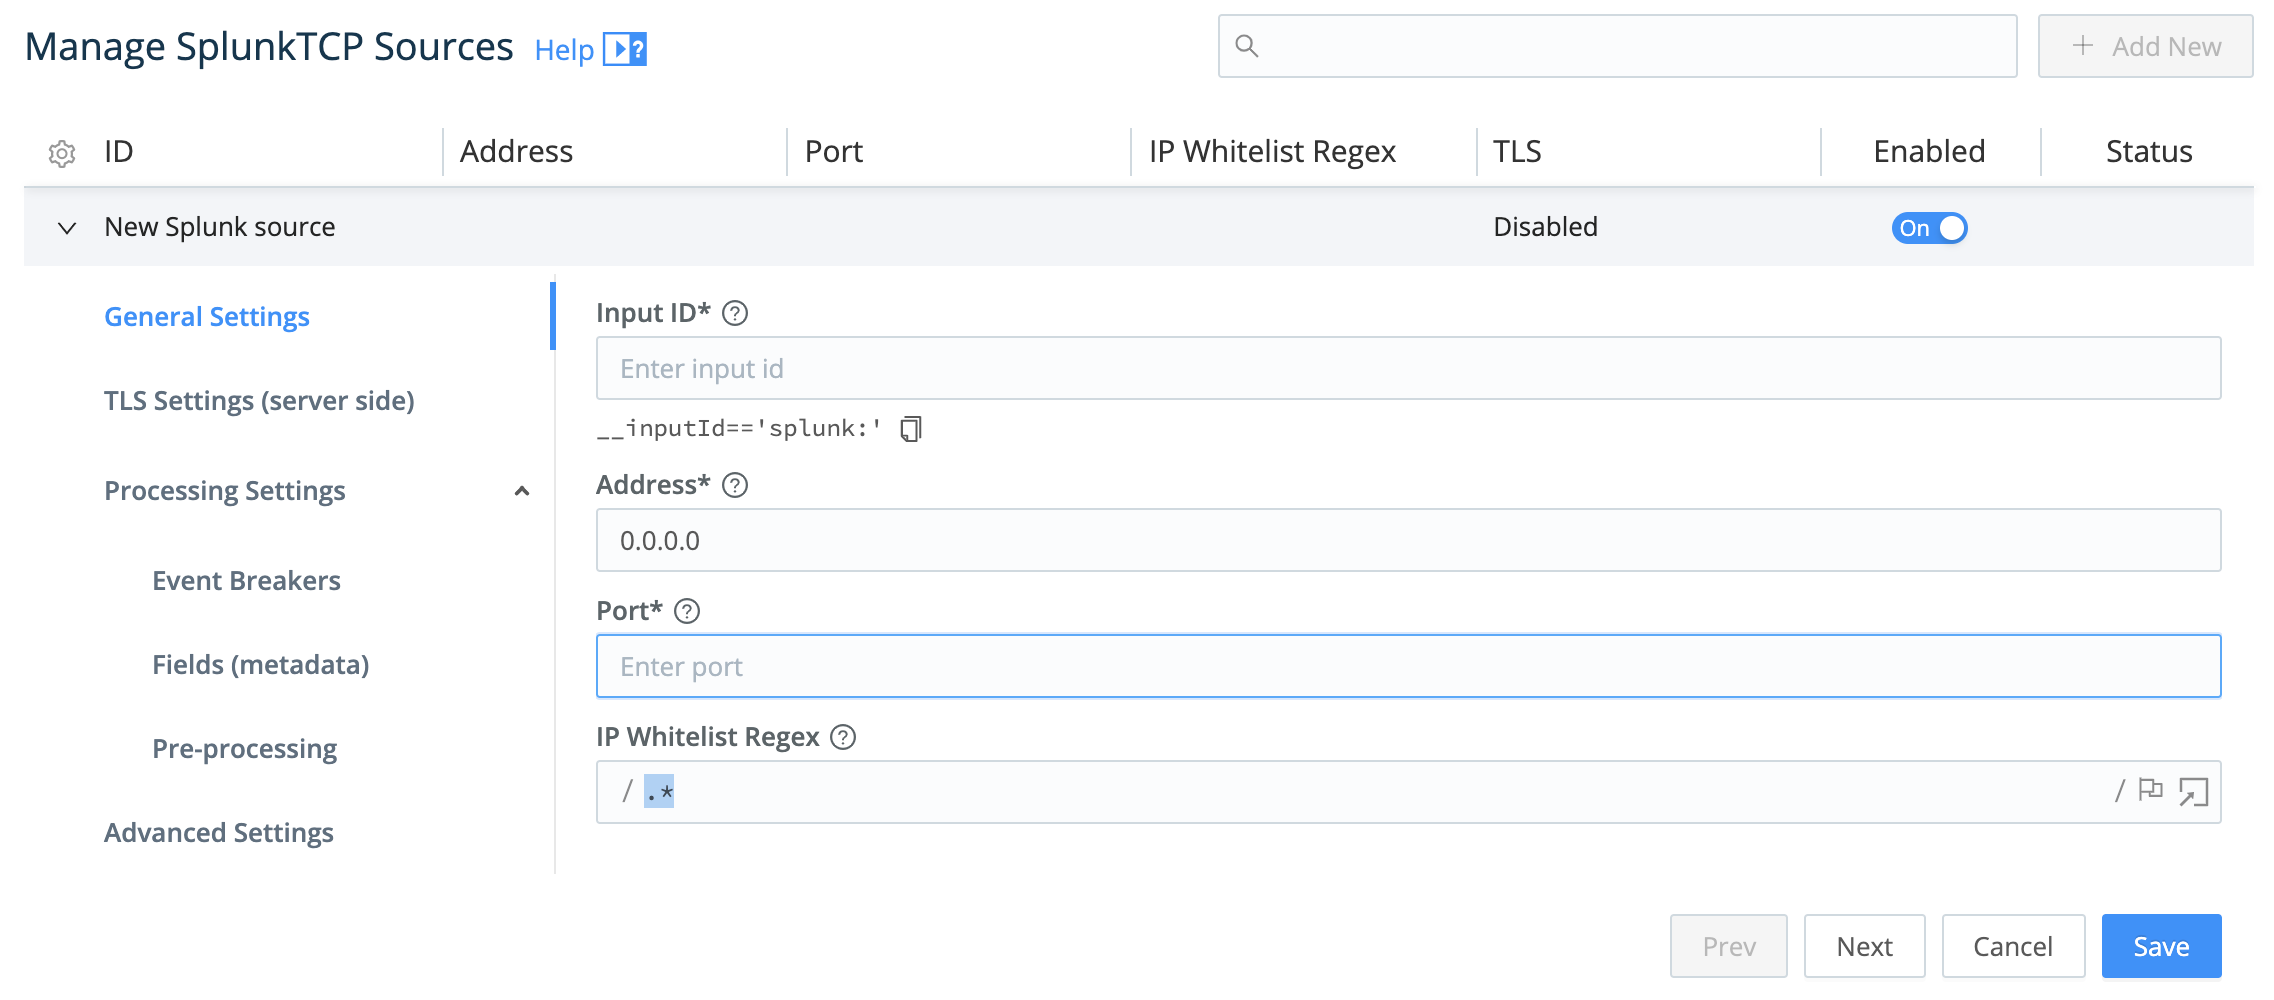
Configure Splunk Source in Cribl Stream
Next, in Cribl Stream, configure a Splunk Source. The key requirement here is to set the Port to listen on. (Optionally, you can also configure TLS, Event Breakers, metadata fields, and/or a pre-processing Pipeline.)
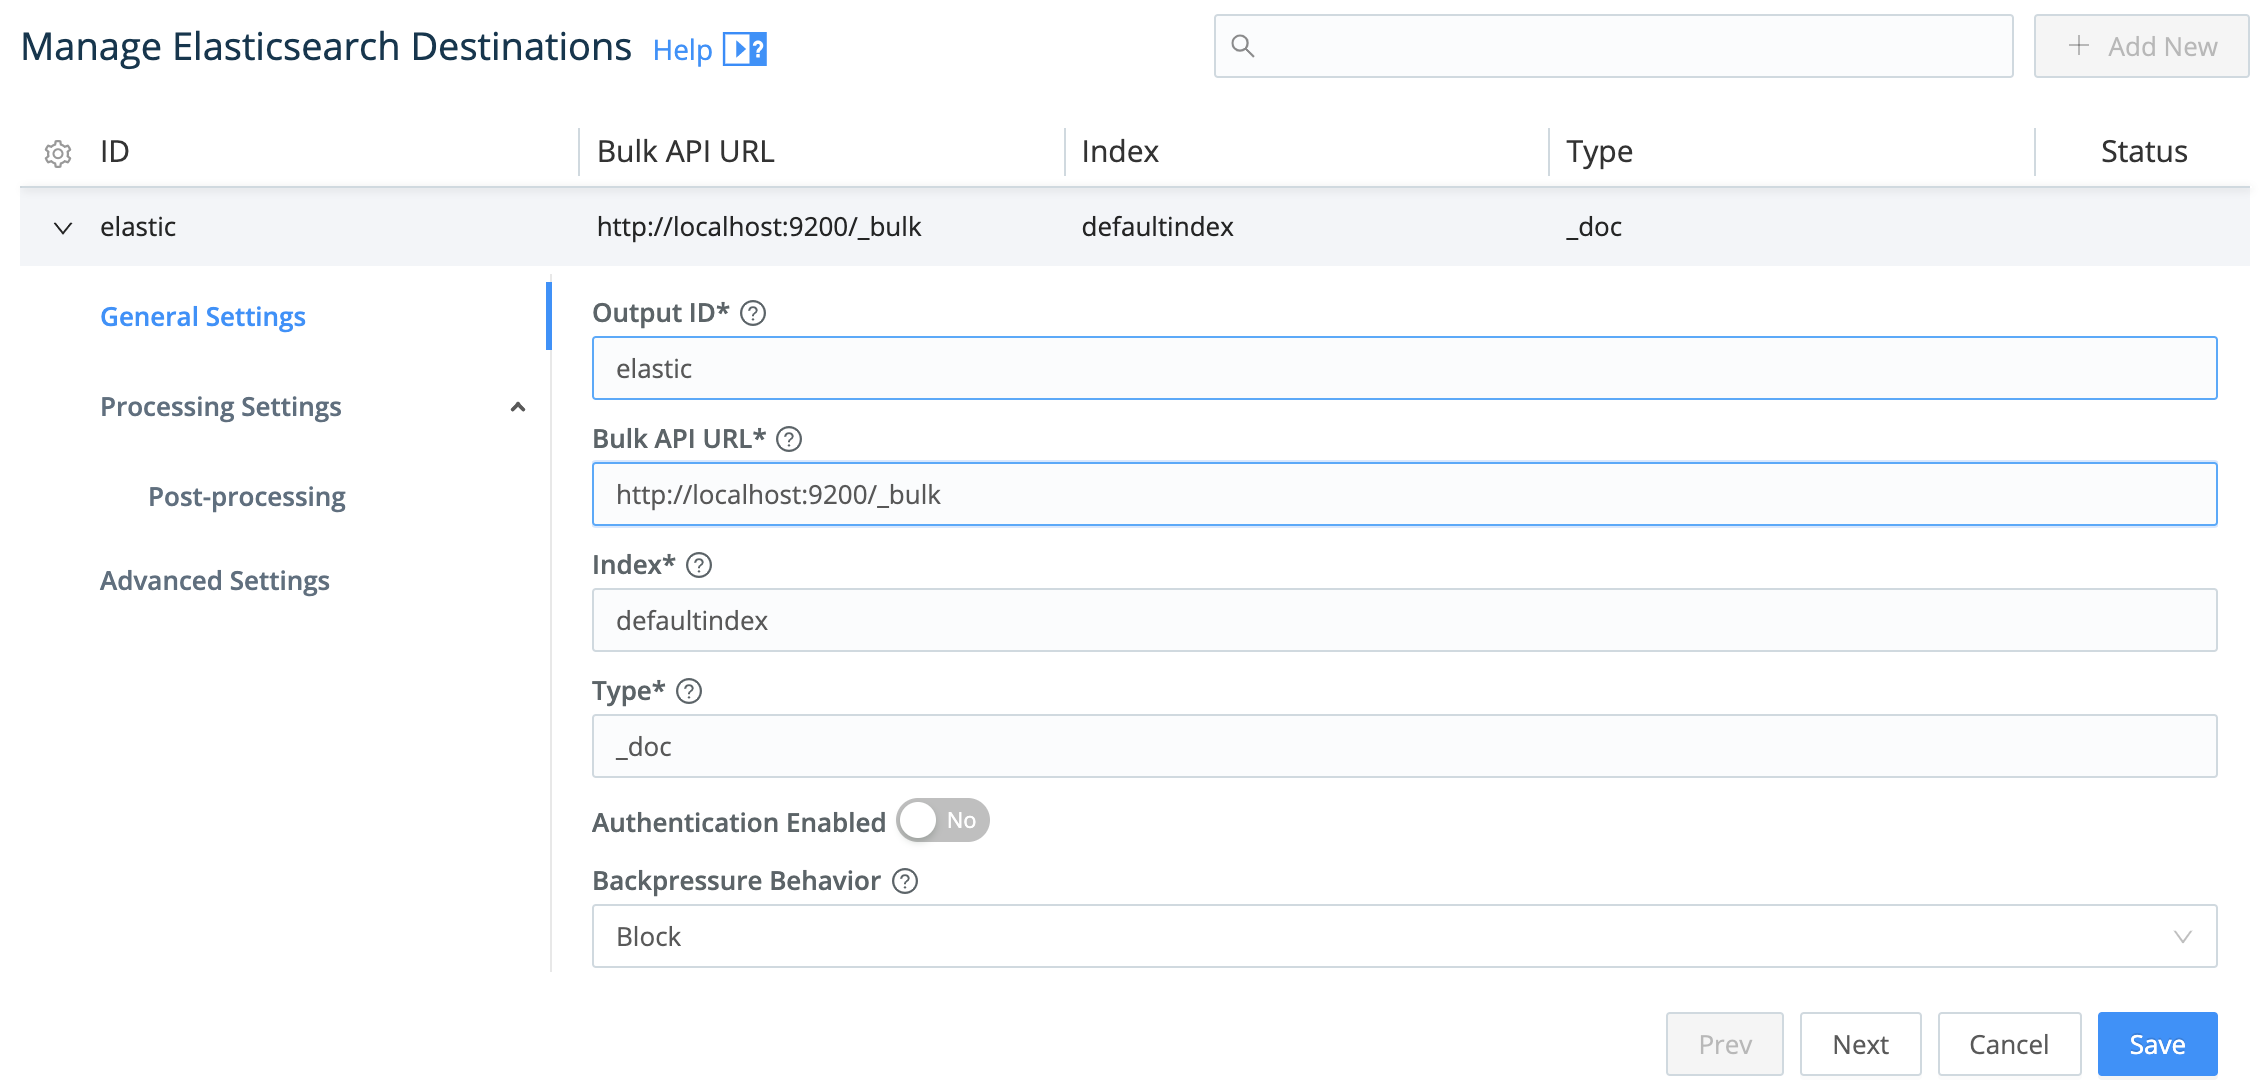
Configure Elasticsearch Destination
To configure Cribl Stream’s output, set up an Elasticsearch Destination by specifying the Bulk API URL and Index.
Configure Pipeline
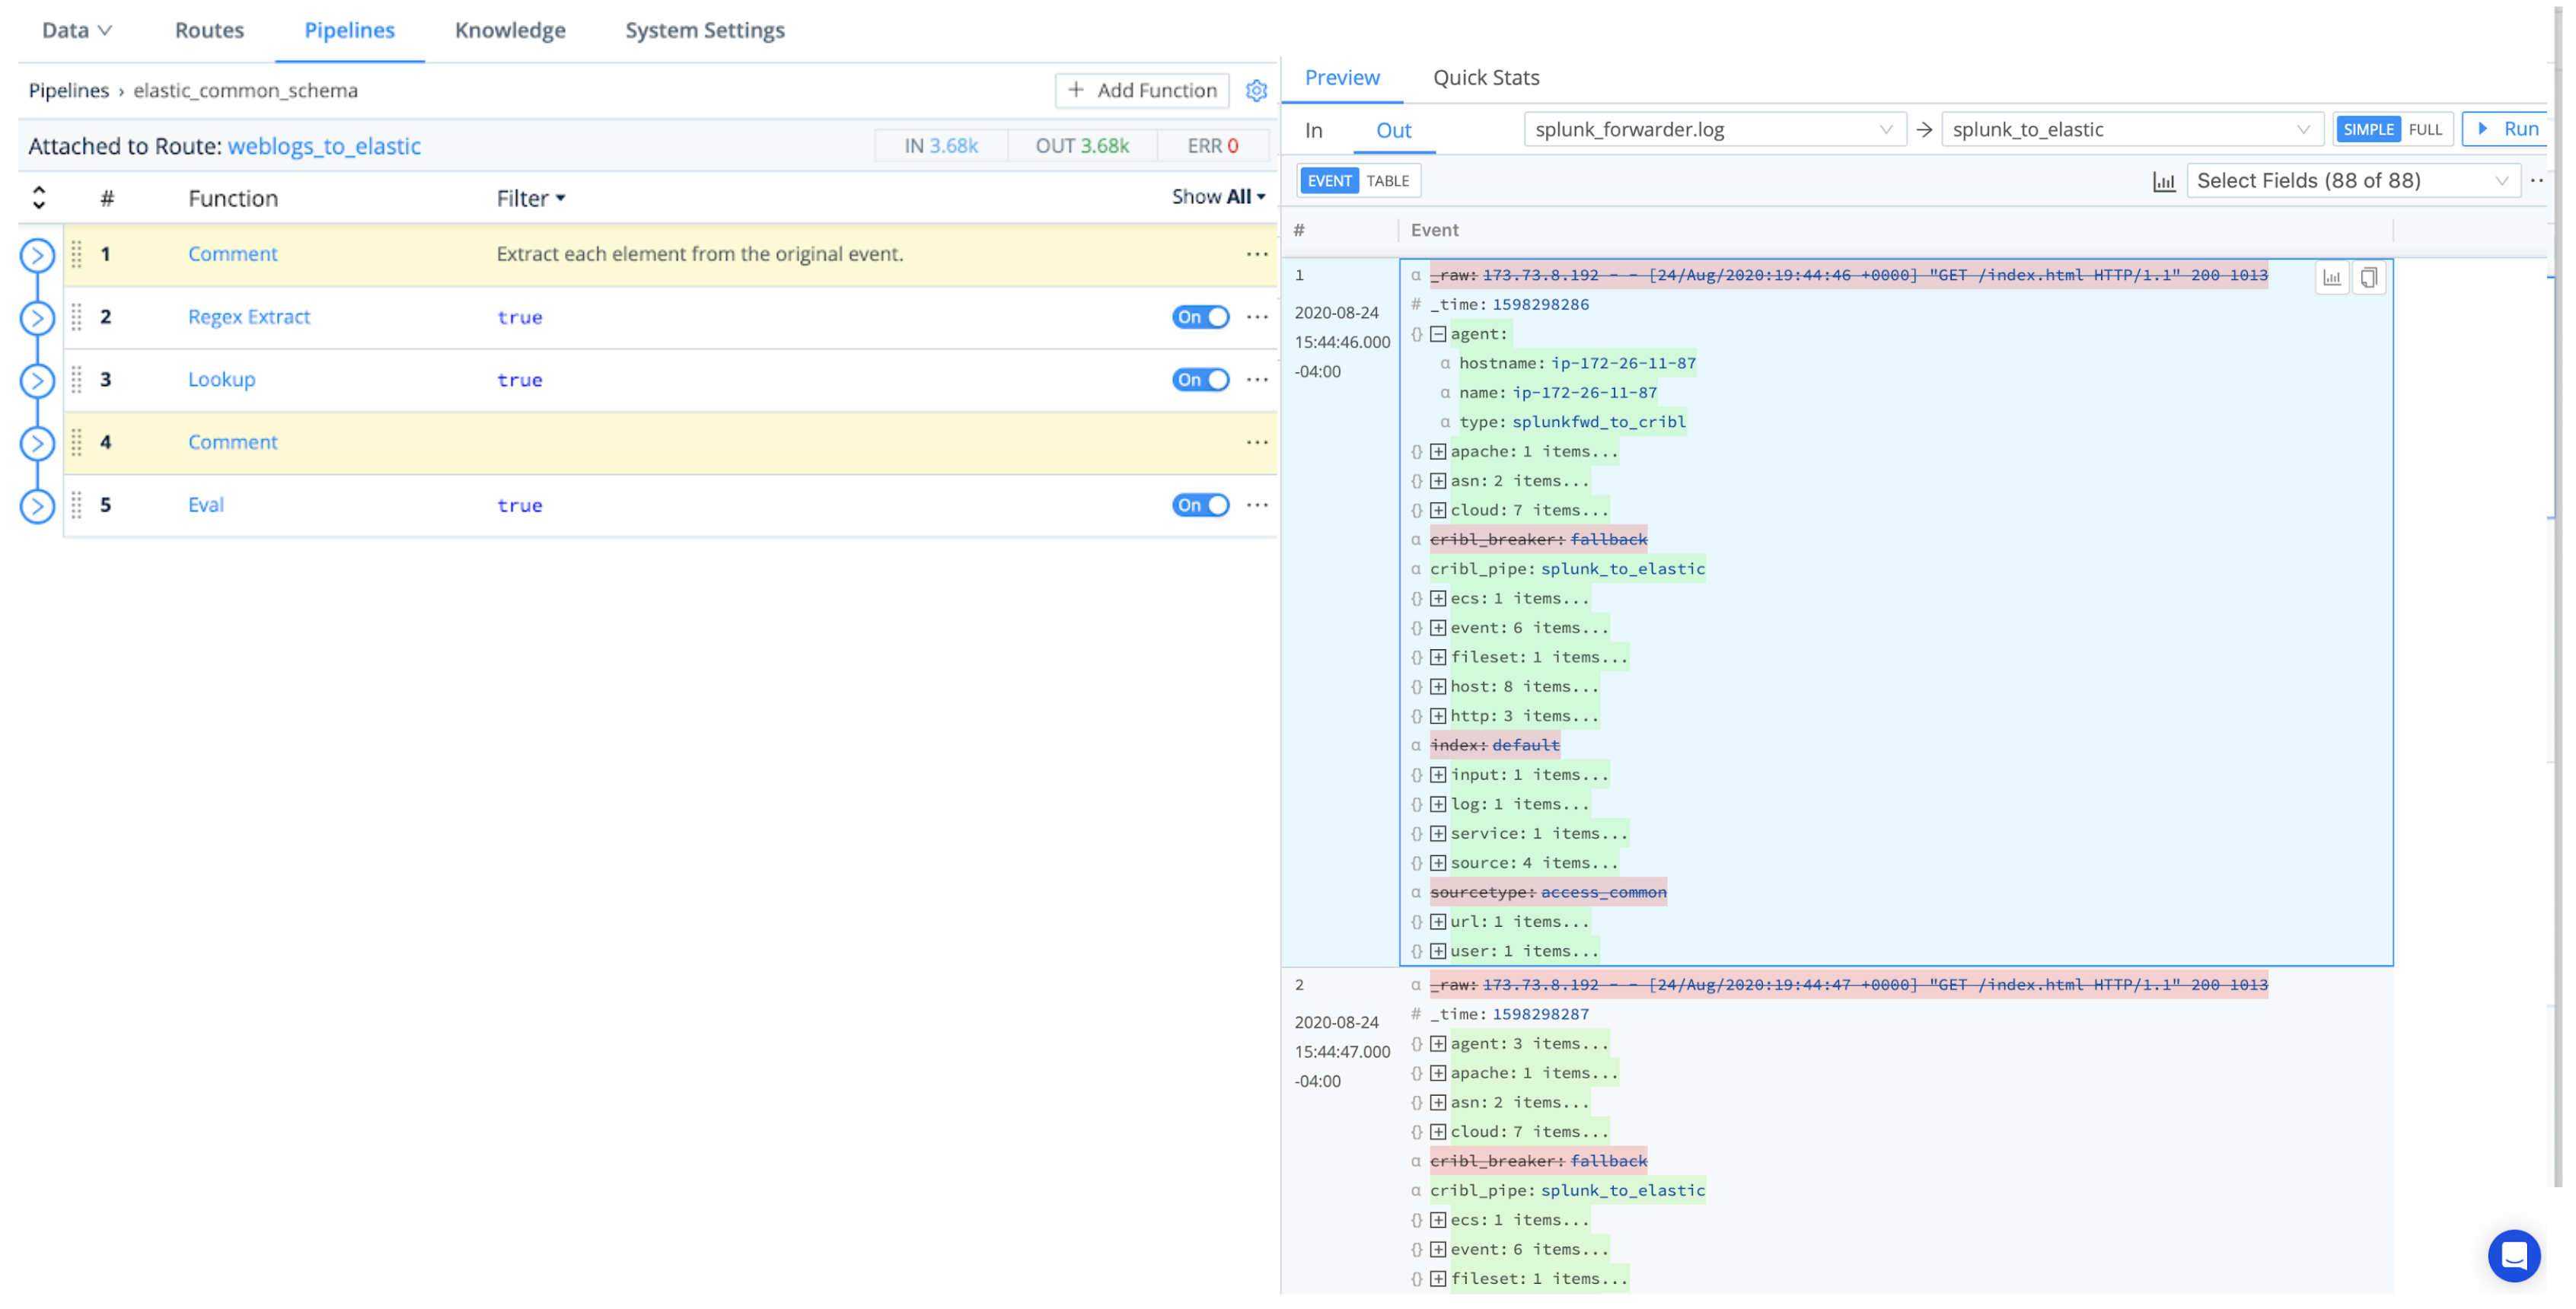
Next, this section shows several Functions that you can assemble into a Pipeline to transform incoming Splunk events to match the Elastic Common Schema.
Regex Extract Function
First, use a Regex Extract Function to break the Splunk events into fields. Try the sample configuration shown below:
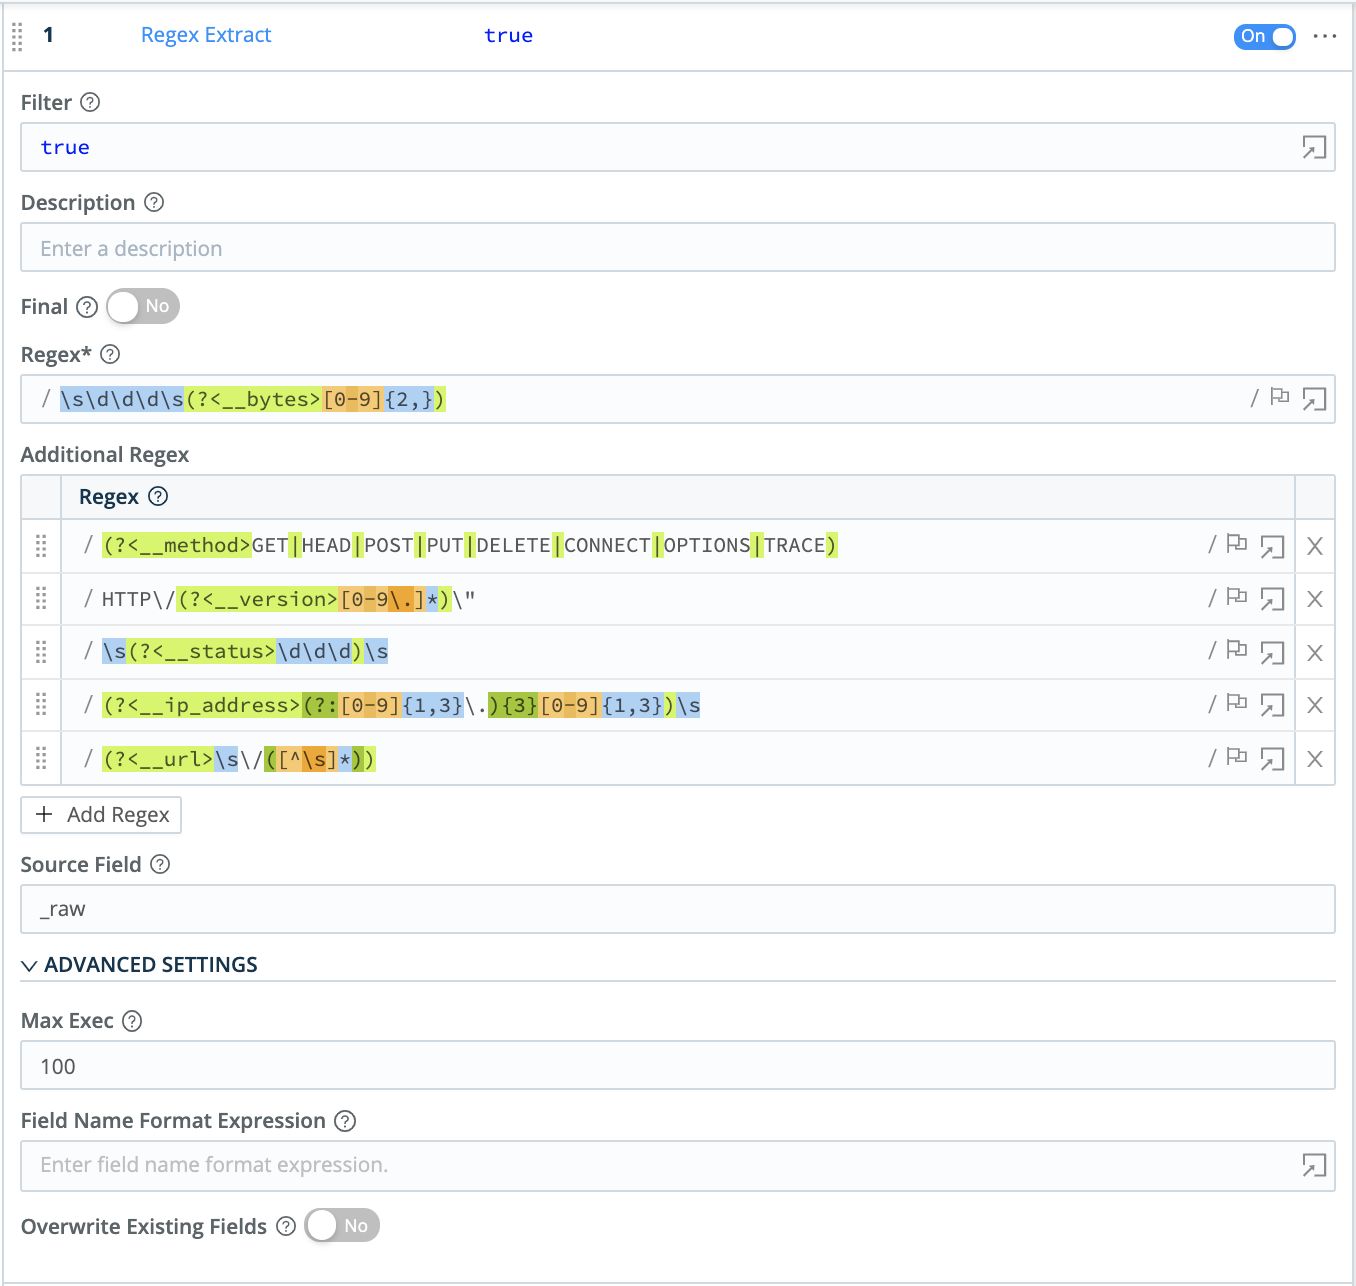
Here are the six rows of regex in this example:
/\s\d\d\d\s(?<__bytes>[0-9]{2,})/
/(?<__method>GET|HEAD|POST|PUT|DELETE|CONNECT|OPTIONS|TRACE)/
/HTTP\/(?<__version>[0-9\.]*)\"/
/\s(?<__status>\d\d\d)\s/
/(?<__ip_address>(?:[0-9]{1,3}\.){3}[0-9]{1,3})\s/
/(?<__url>\s\/([^\s]*))/As you refine your expression, capture a sample of incoming Splunk data to test your regex’s results in Cribl Stream’s right Preview pane.
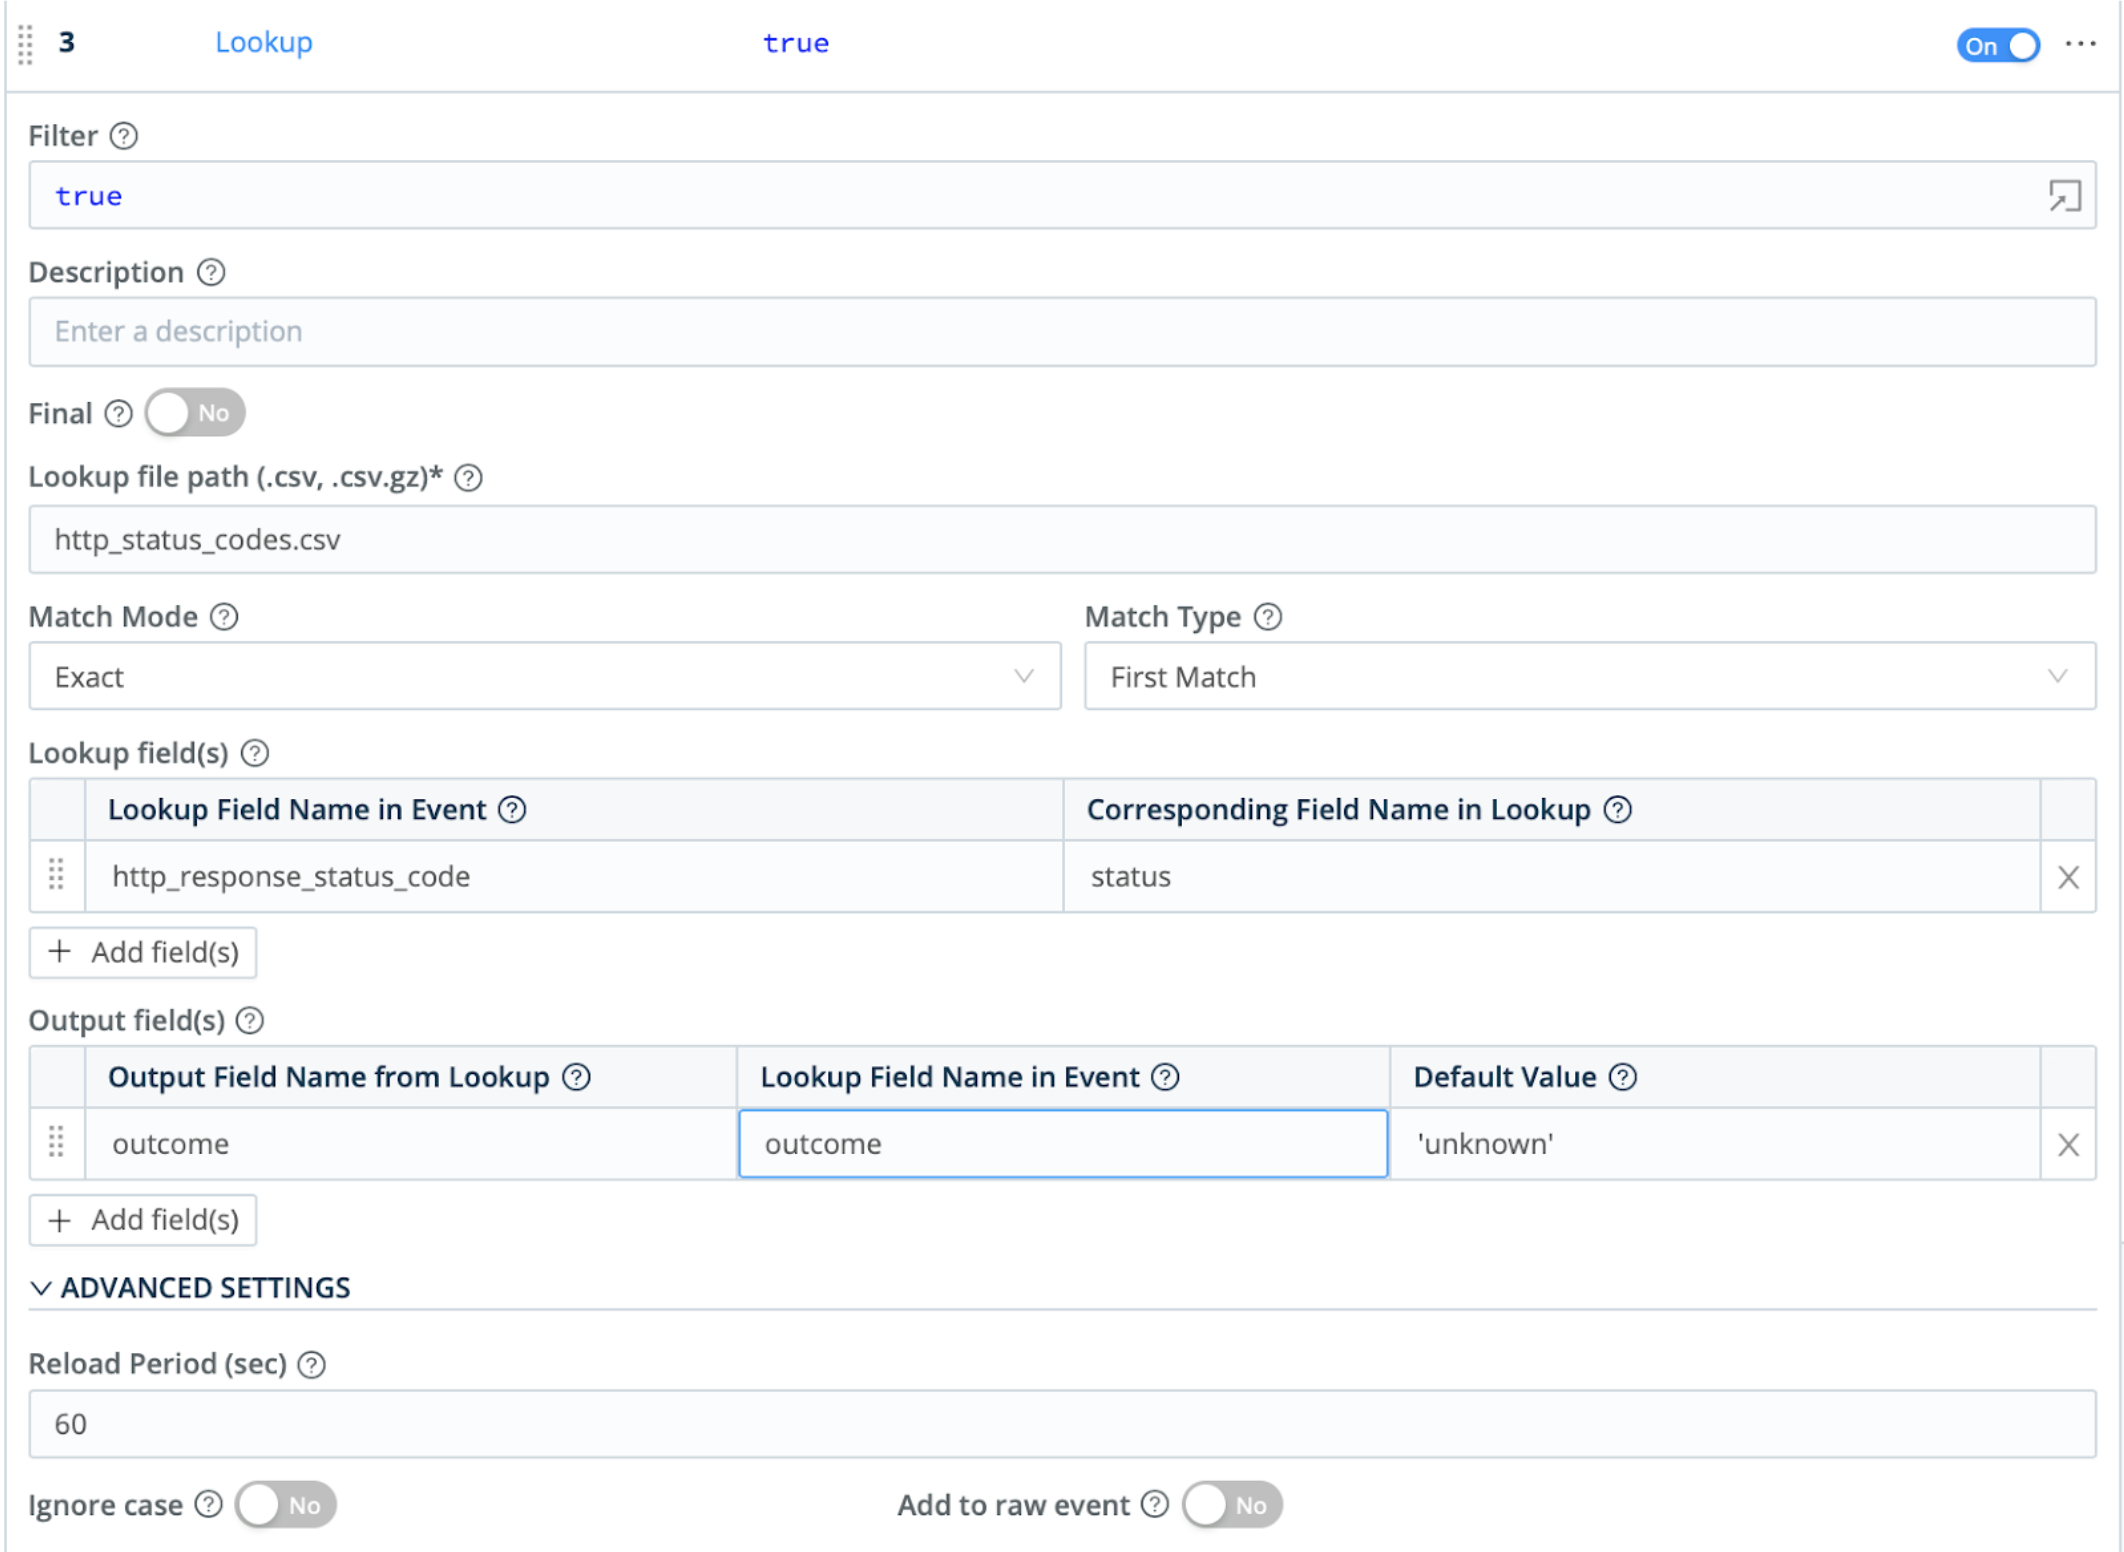
Lookup Function
In this example, we next add a Lookup Function, to translate HTTP error codes to readable text. Note this Function’s optional Reload Period field, in which you can define a reload interval for a lookup file whose contents refresh frequently.
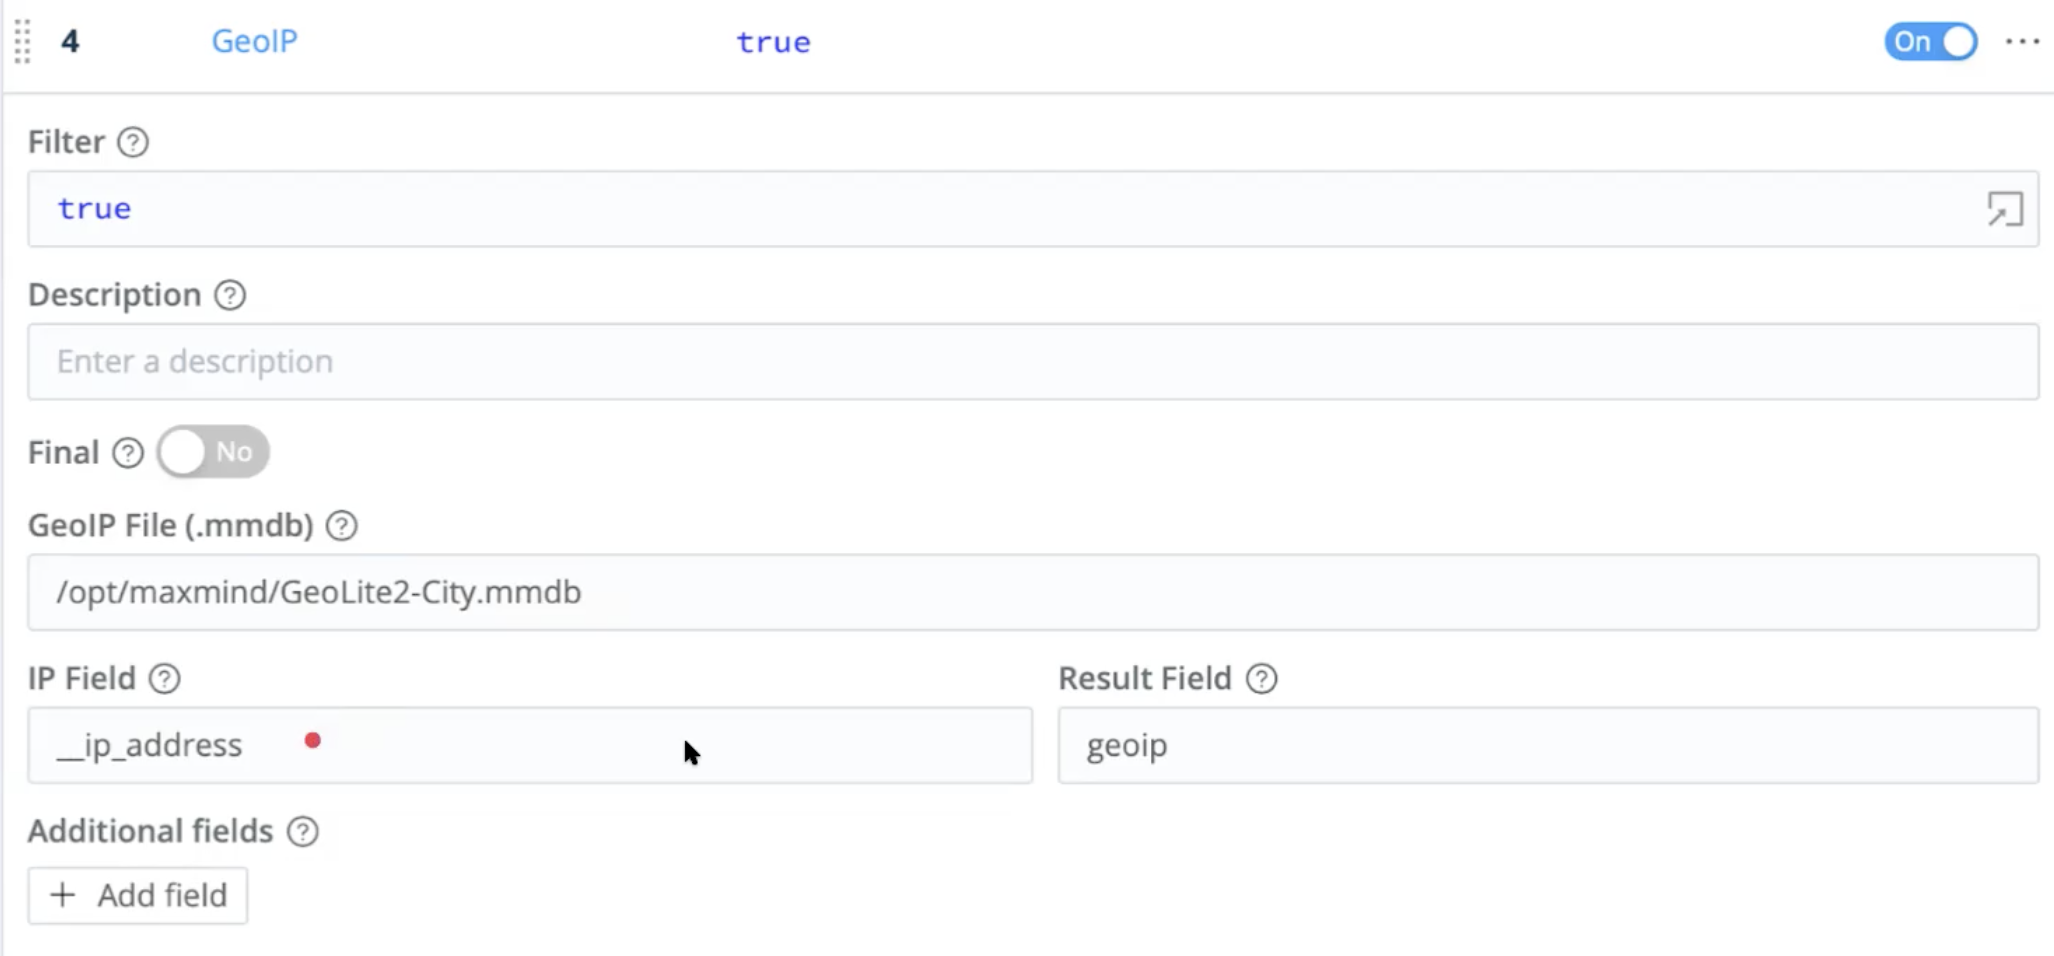
GeoIP Function
To enrich the Splunk data, we next use a GeoIP Function. This a specialized lookup against a database of IP addresses by geographic location. This Function’s output can provide Elasticsearch with location fields like lat and long.
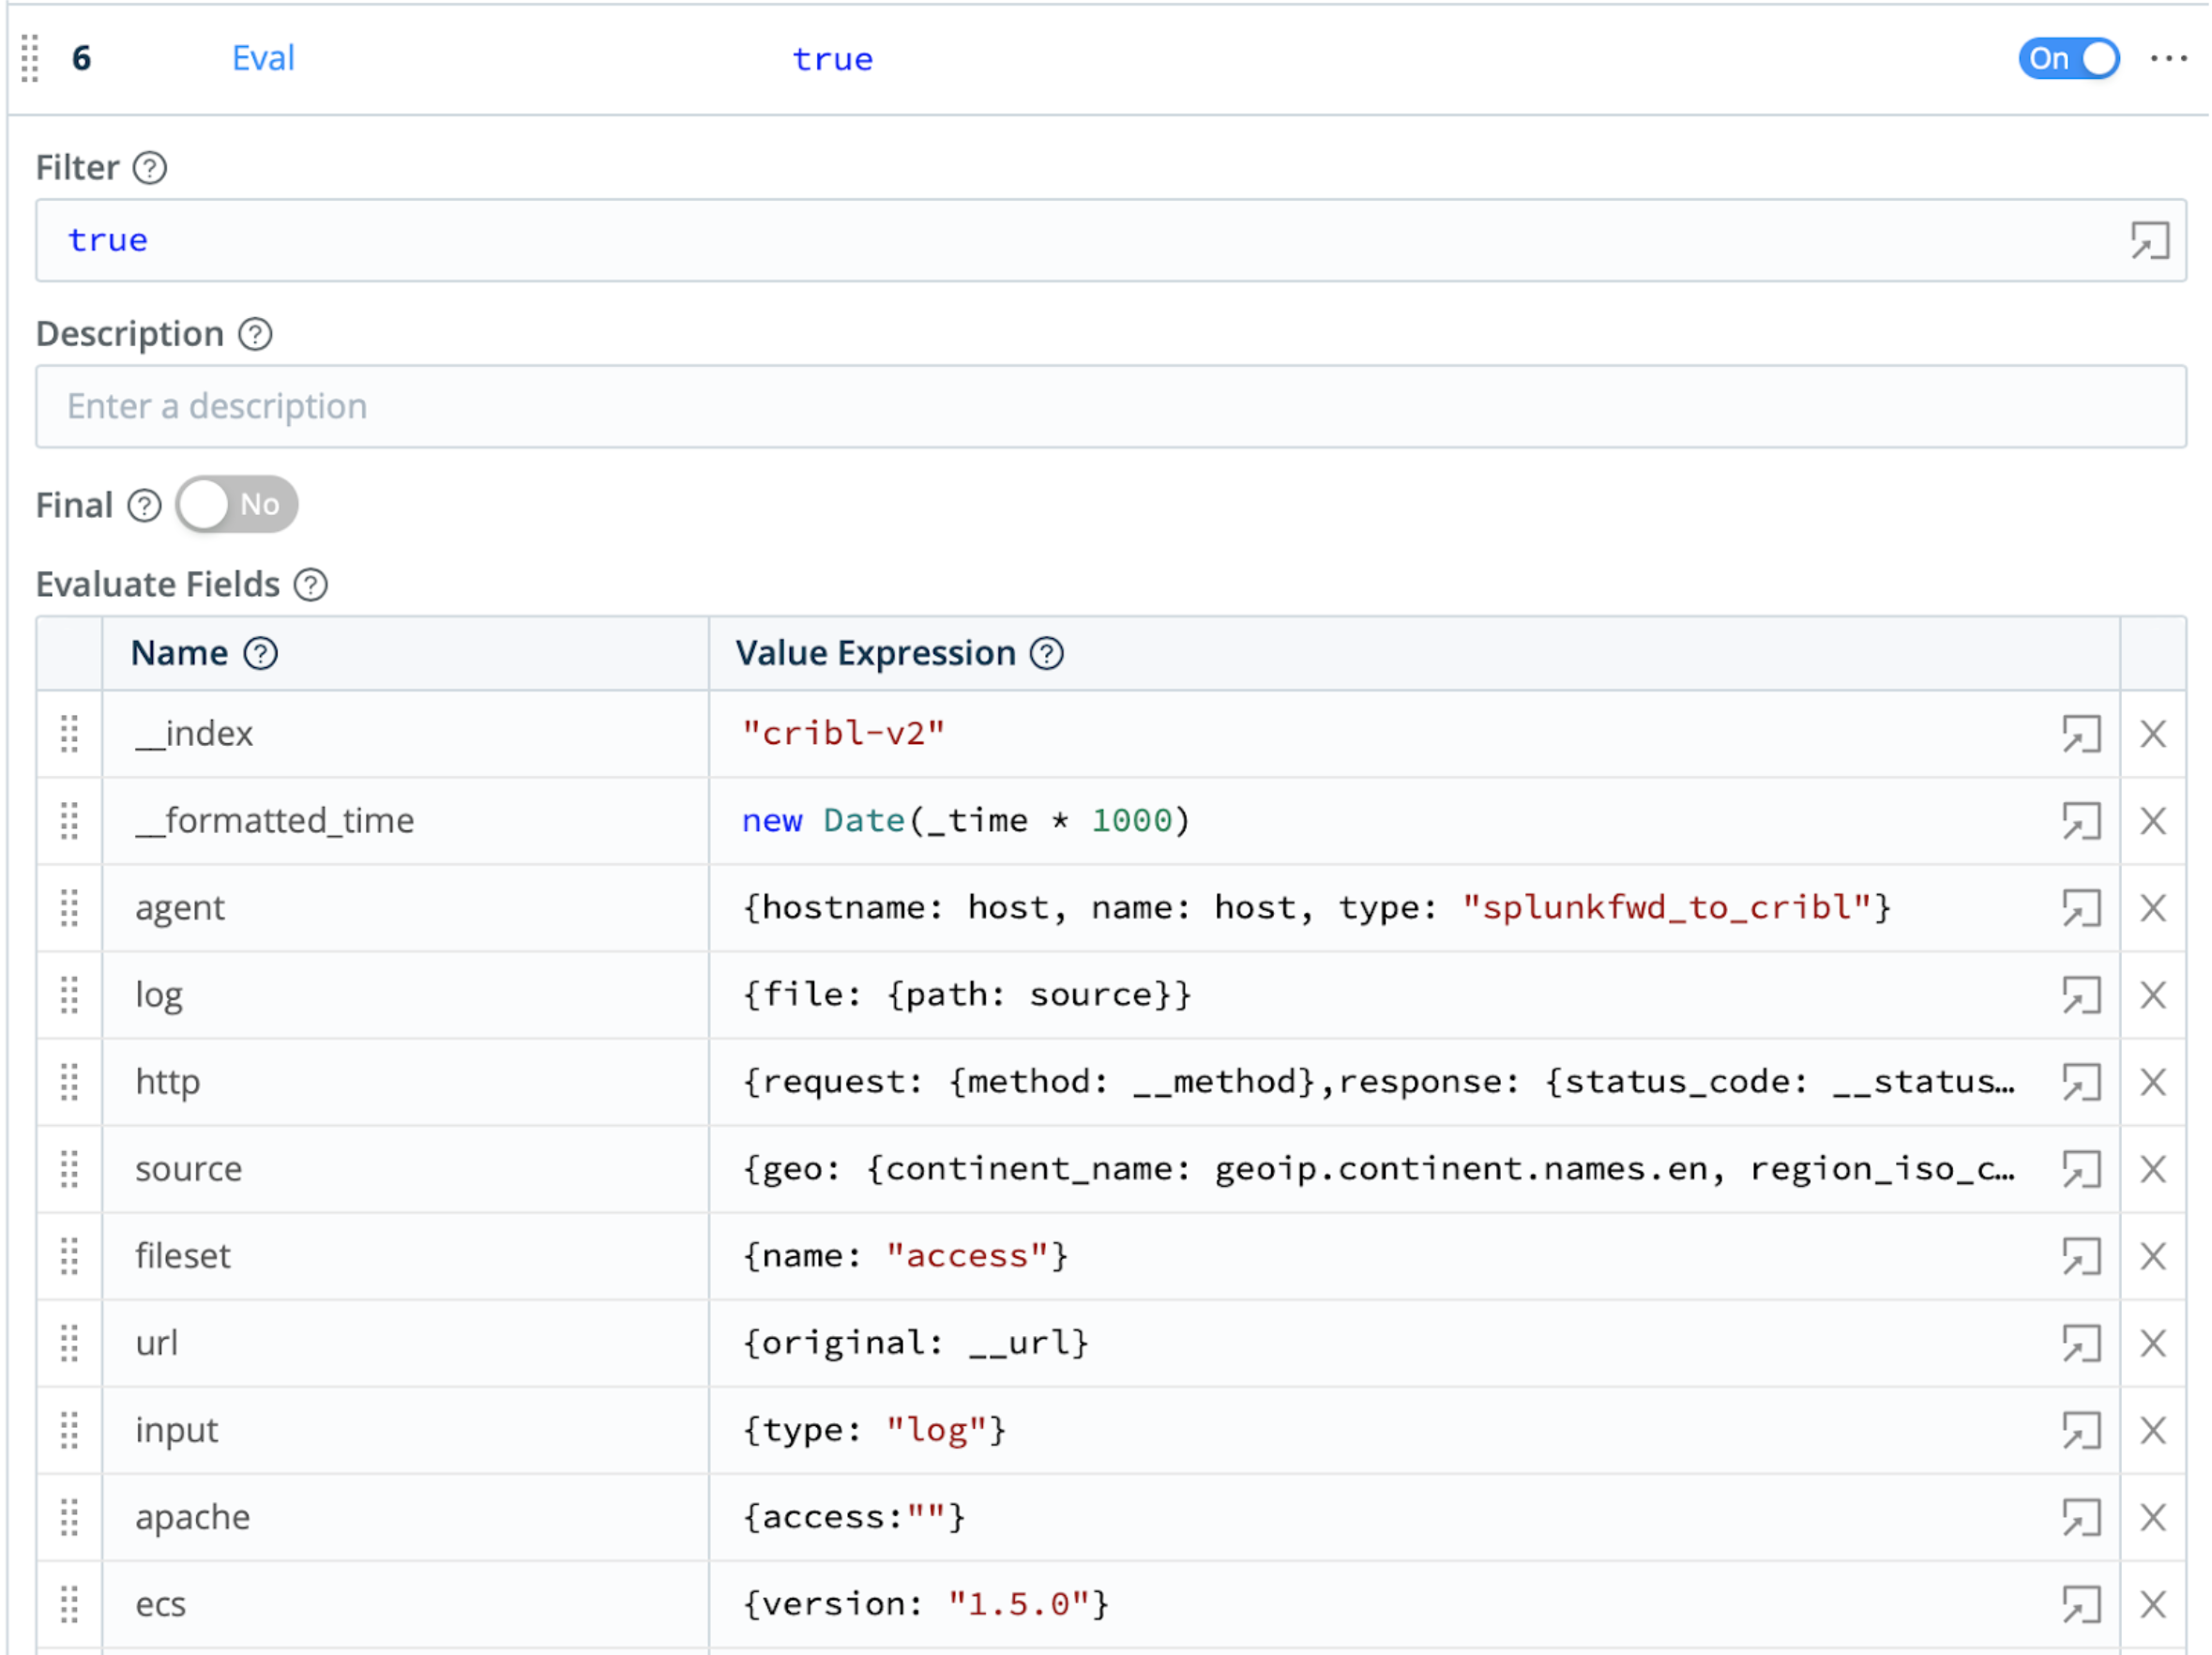
Eval Function
Finally, to further enrich the outbound events, the Pipeline uses an Eval Function. This adds multiple key-value pairs that define and populate fields conforming to the Elastic Common Schema.
Results
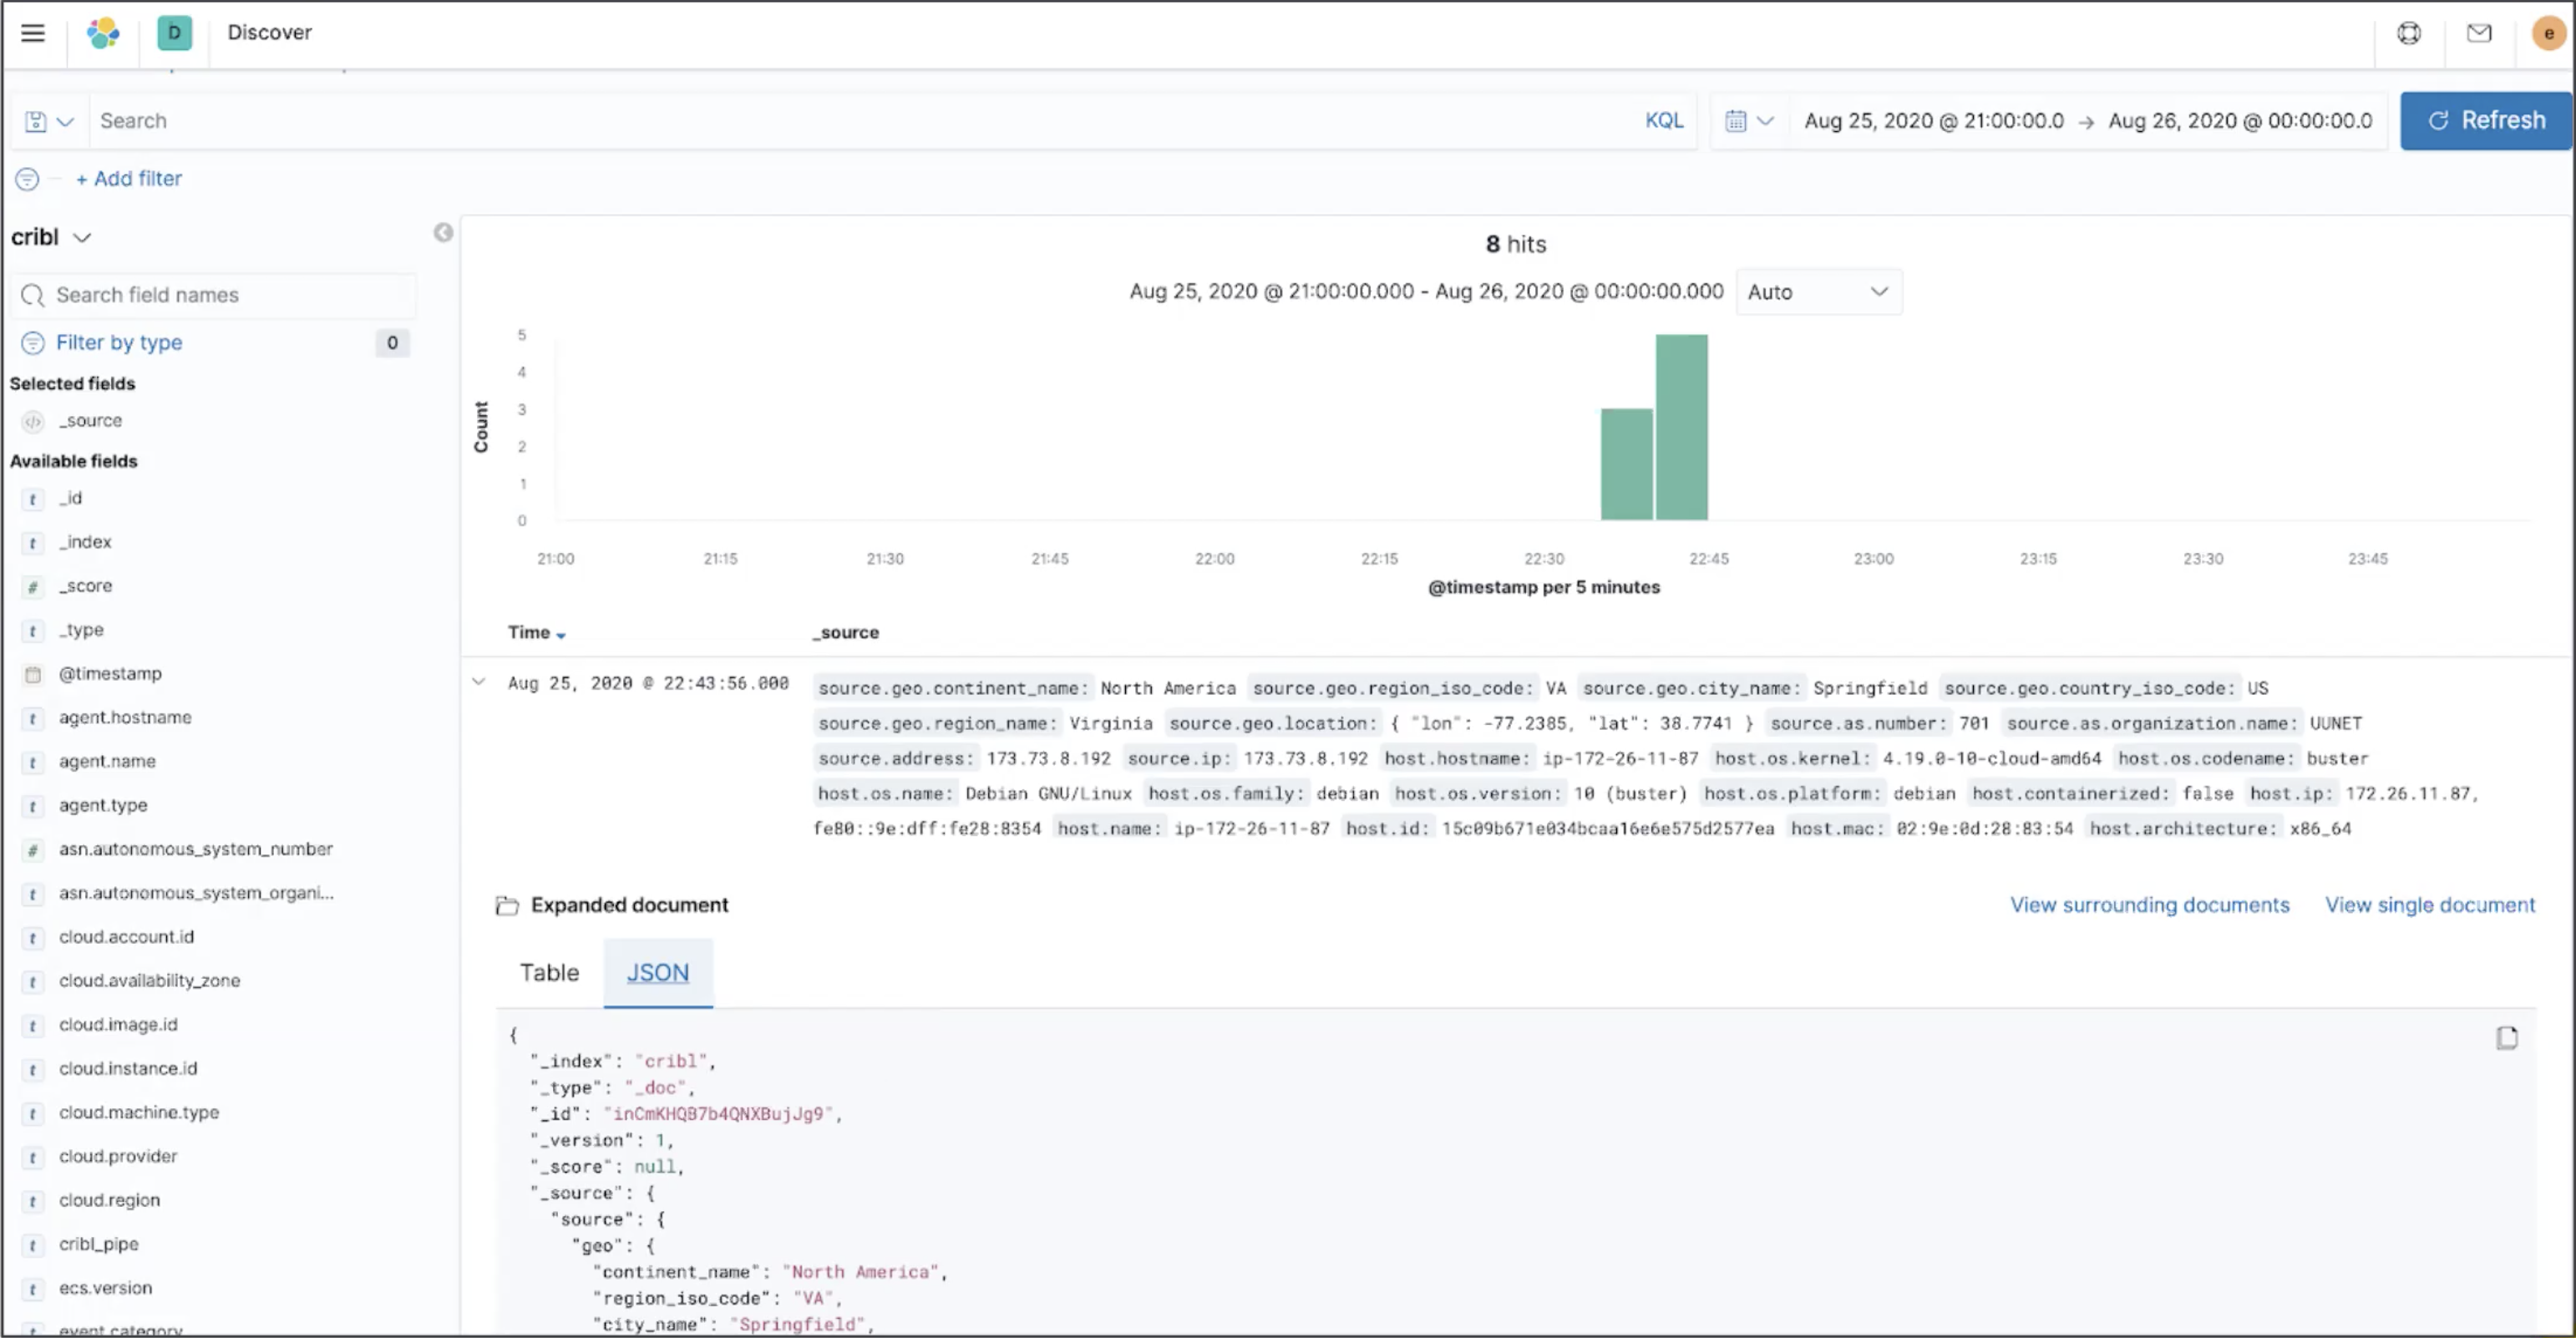
After attaching your Pipeline to a Route, here’s an an exported event, all happy in Elasticsearch with nested JSON.
For More Info
For additional details on configuring Splunk forwarders for Cribl Stream, see this related documentation: