These docs are for Cribl Stream 4.10 and are no longer actively maintained.
See the latest version (4.17).
System Metrics to Grafana
Cribl Stream can collect metrics from the host on which it is running, and can populate some standard metrics dashboards right out of the box. For metrics details, see Linux System Metrics Details. While, Grafana is a multi-platform open source analytics and interactive visualization web application. It provides charts, graphs, and alerts for the web when connected to supported data sources.
Cribl has configured a Prometheus dashboard to display Cribl Stream System Metrics, and shared the dashboard in the Grafana library, which is public. This is a relatively simple dashboard suitable for showing aggregate metrics.
Another useful dashboard is the one that’s commonly used with Prometheus and their Node Exporter agent, found here. This dashboard can handle the highly detailed metrics.
In this guide, we will show you how to route system metrics to a Grafana dashboard for both basic and highly detailed metrics visualizations.
We will walk you through the following:
- Configure System Metrics Source on Cribl Stream to receive metrics from the host.
- Configure the Prometheus Destination to send data to Grafana Cloud.
- Access Grafana Cloud to see the metrics and visualizations.
Configure the System Metrics Source on Cribl Stream
In Cribl Stream, start by configuring and enabling a System Metrics Source. The key requirement here is to to decide on the level of details for the metrics you want to collect. In the Host Metrics and Container Metrics tabs:
- For the relatively simple dashboard showing aggregate metrics, choose the Basic mode for most of your metrics.
- For the highly detailed metrics visualizations dashboard, choose the All mode for all of your metrics.
In the Pre-Processing tab, select the prometheus_metrics Pipeline.
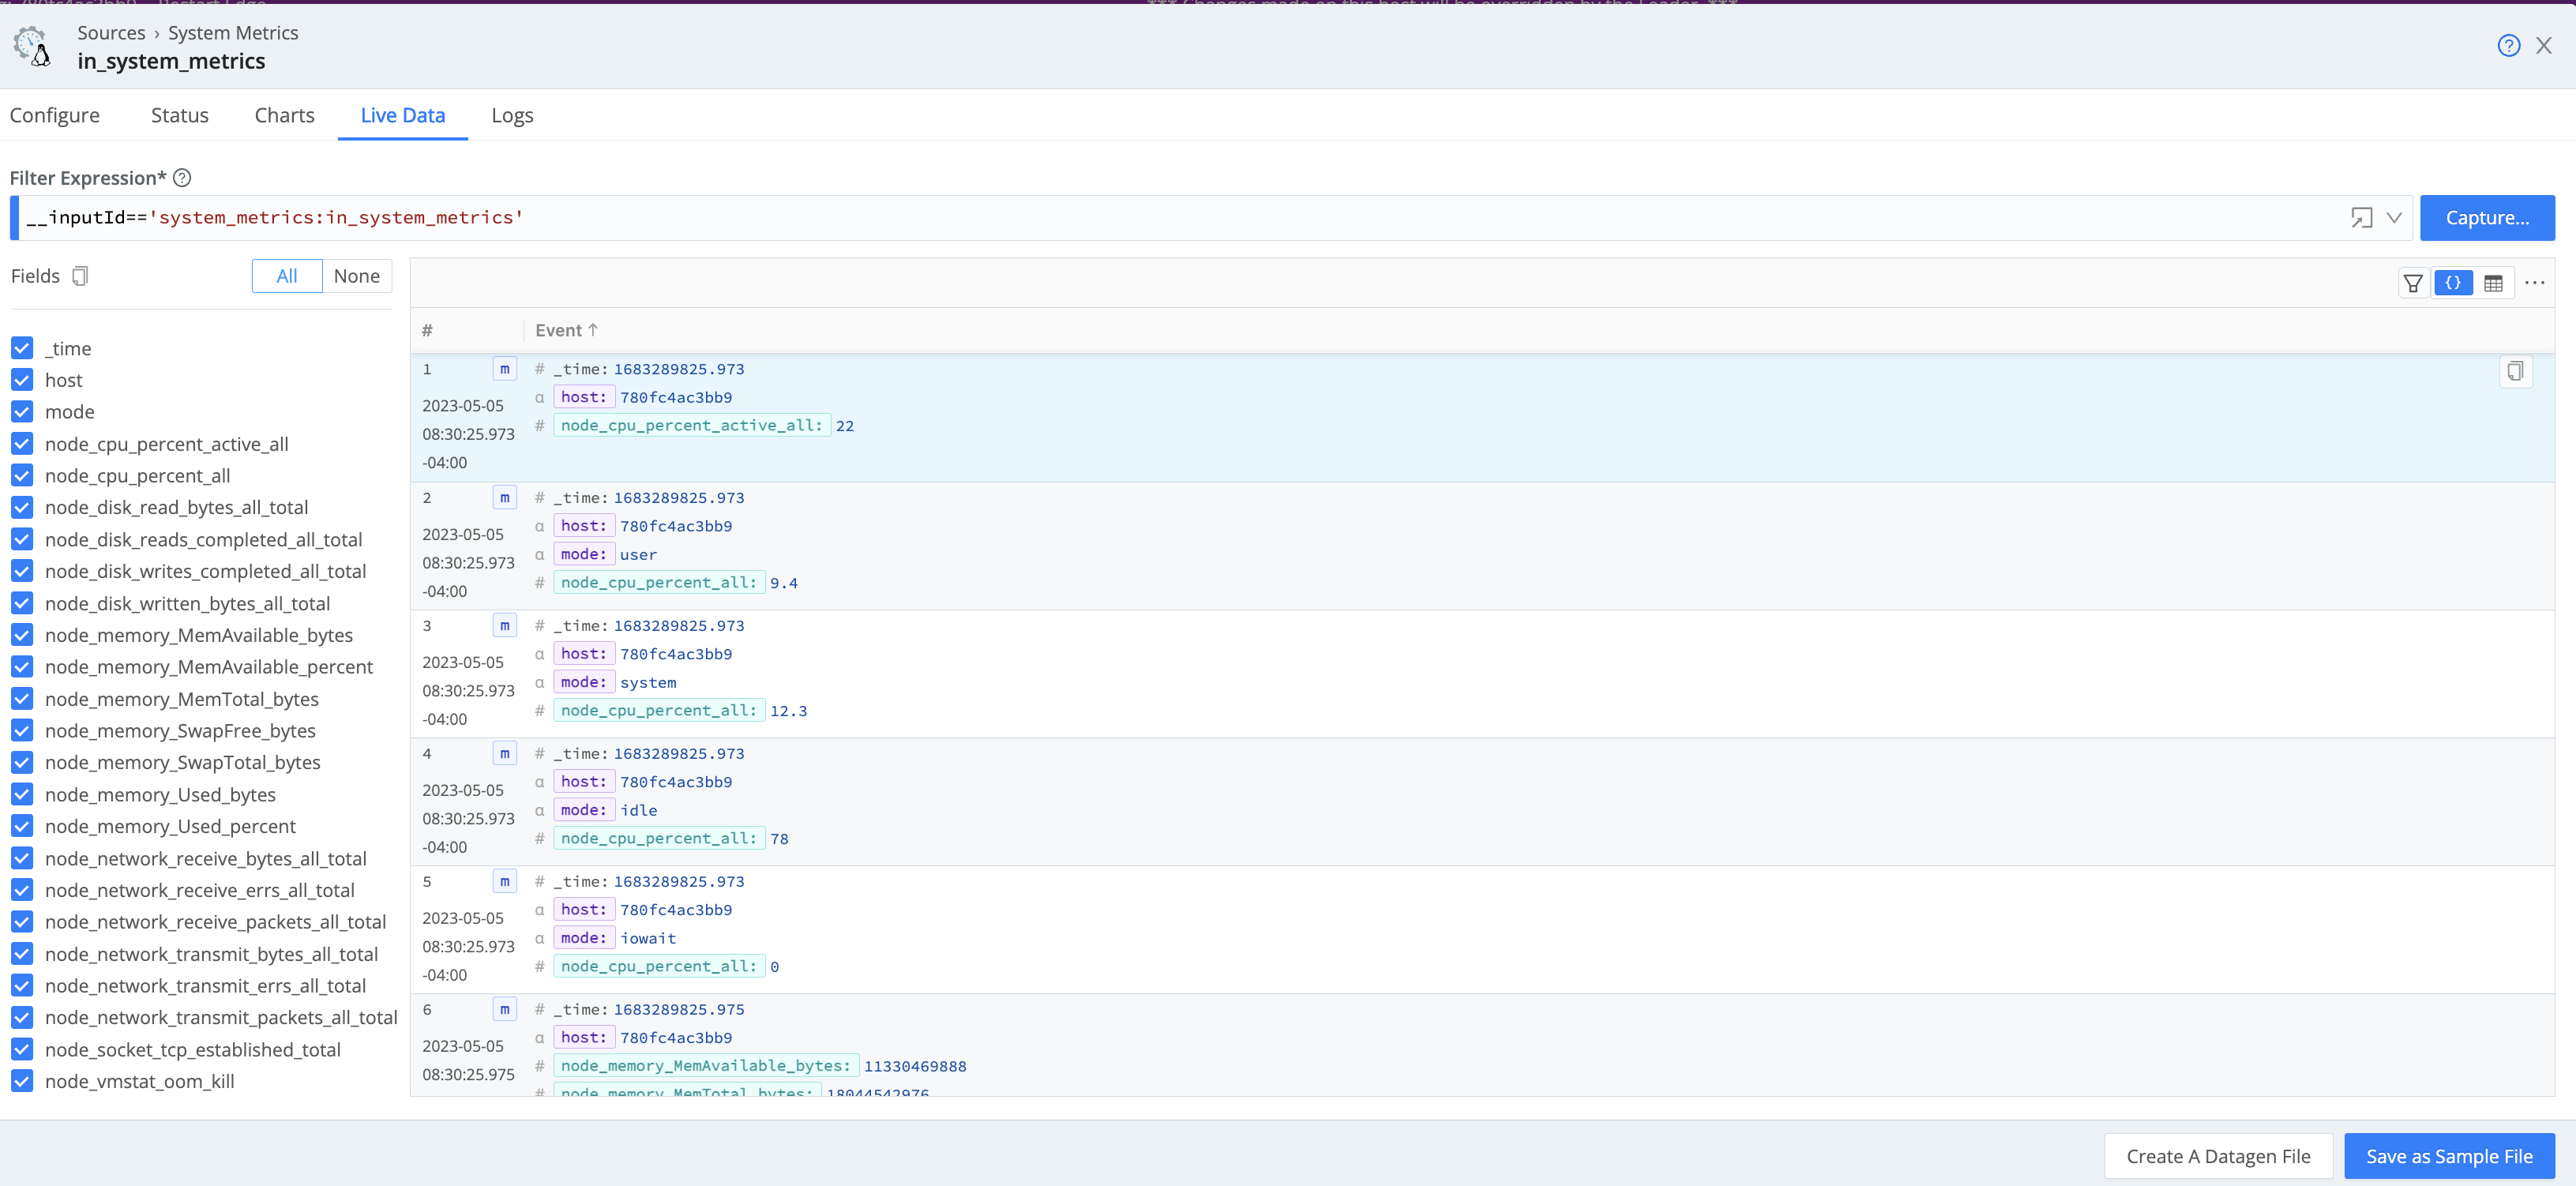
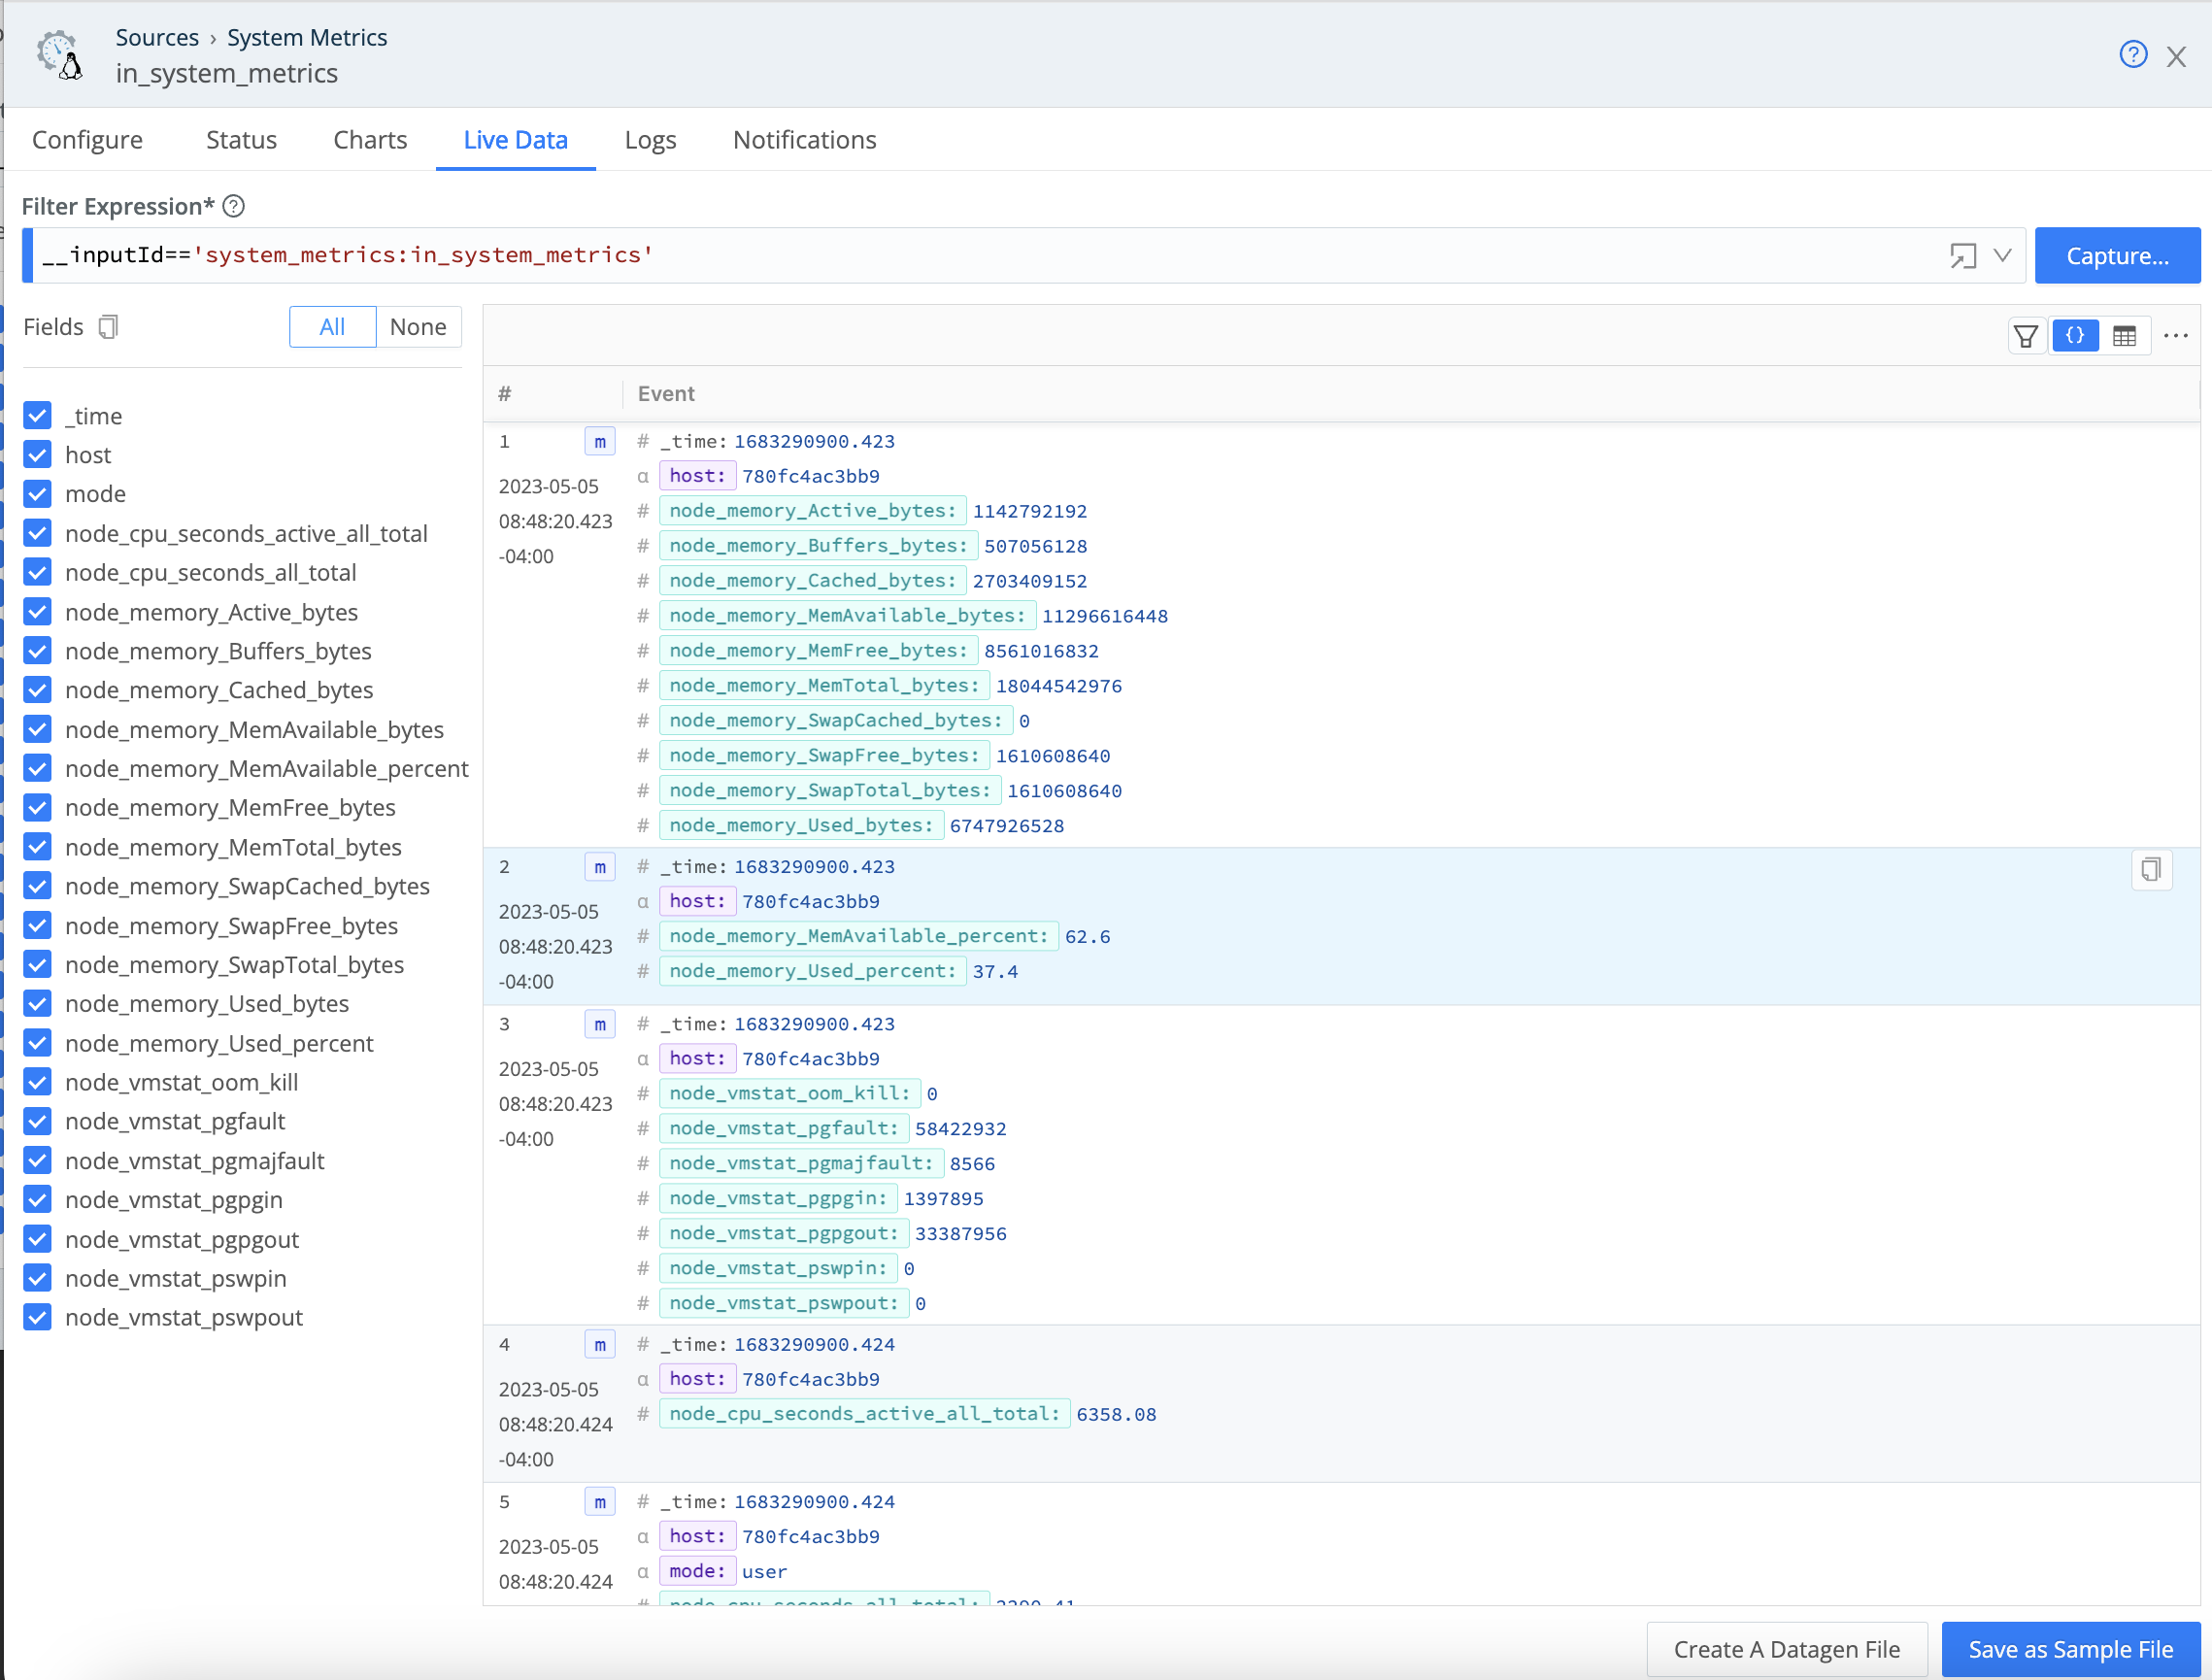
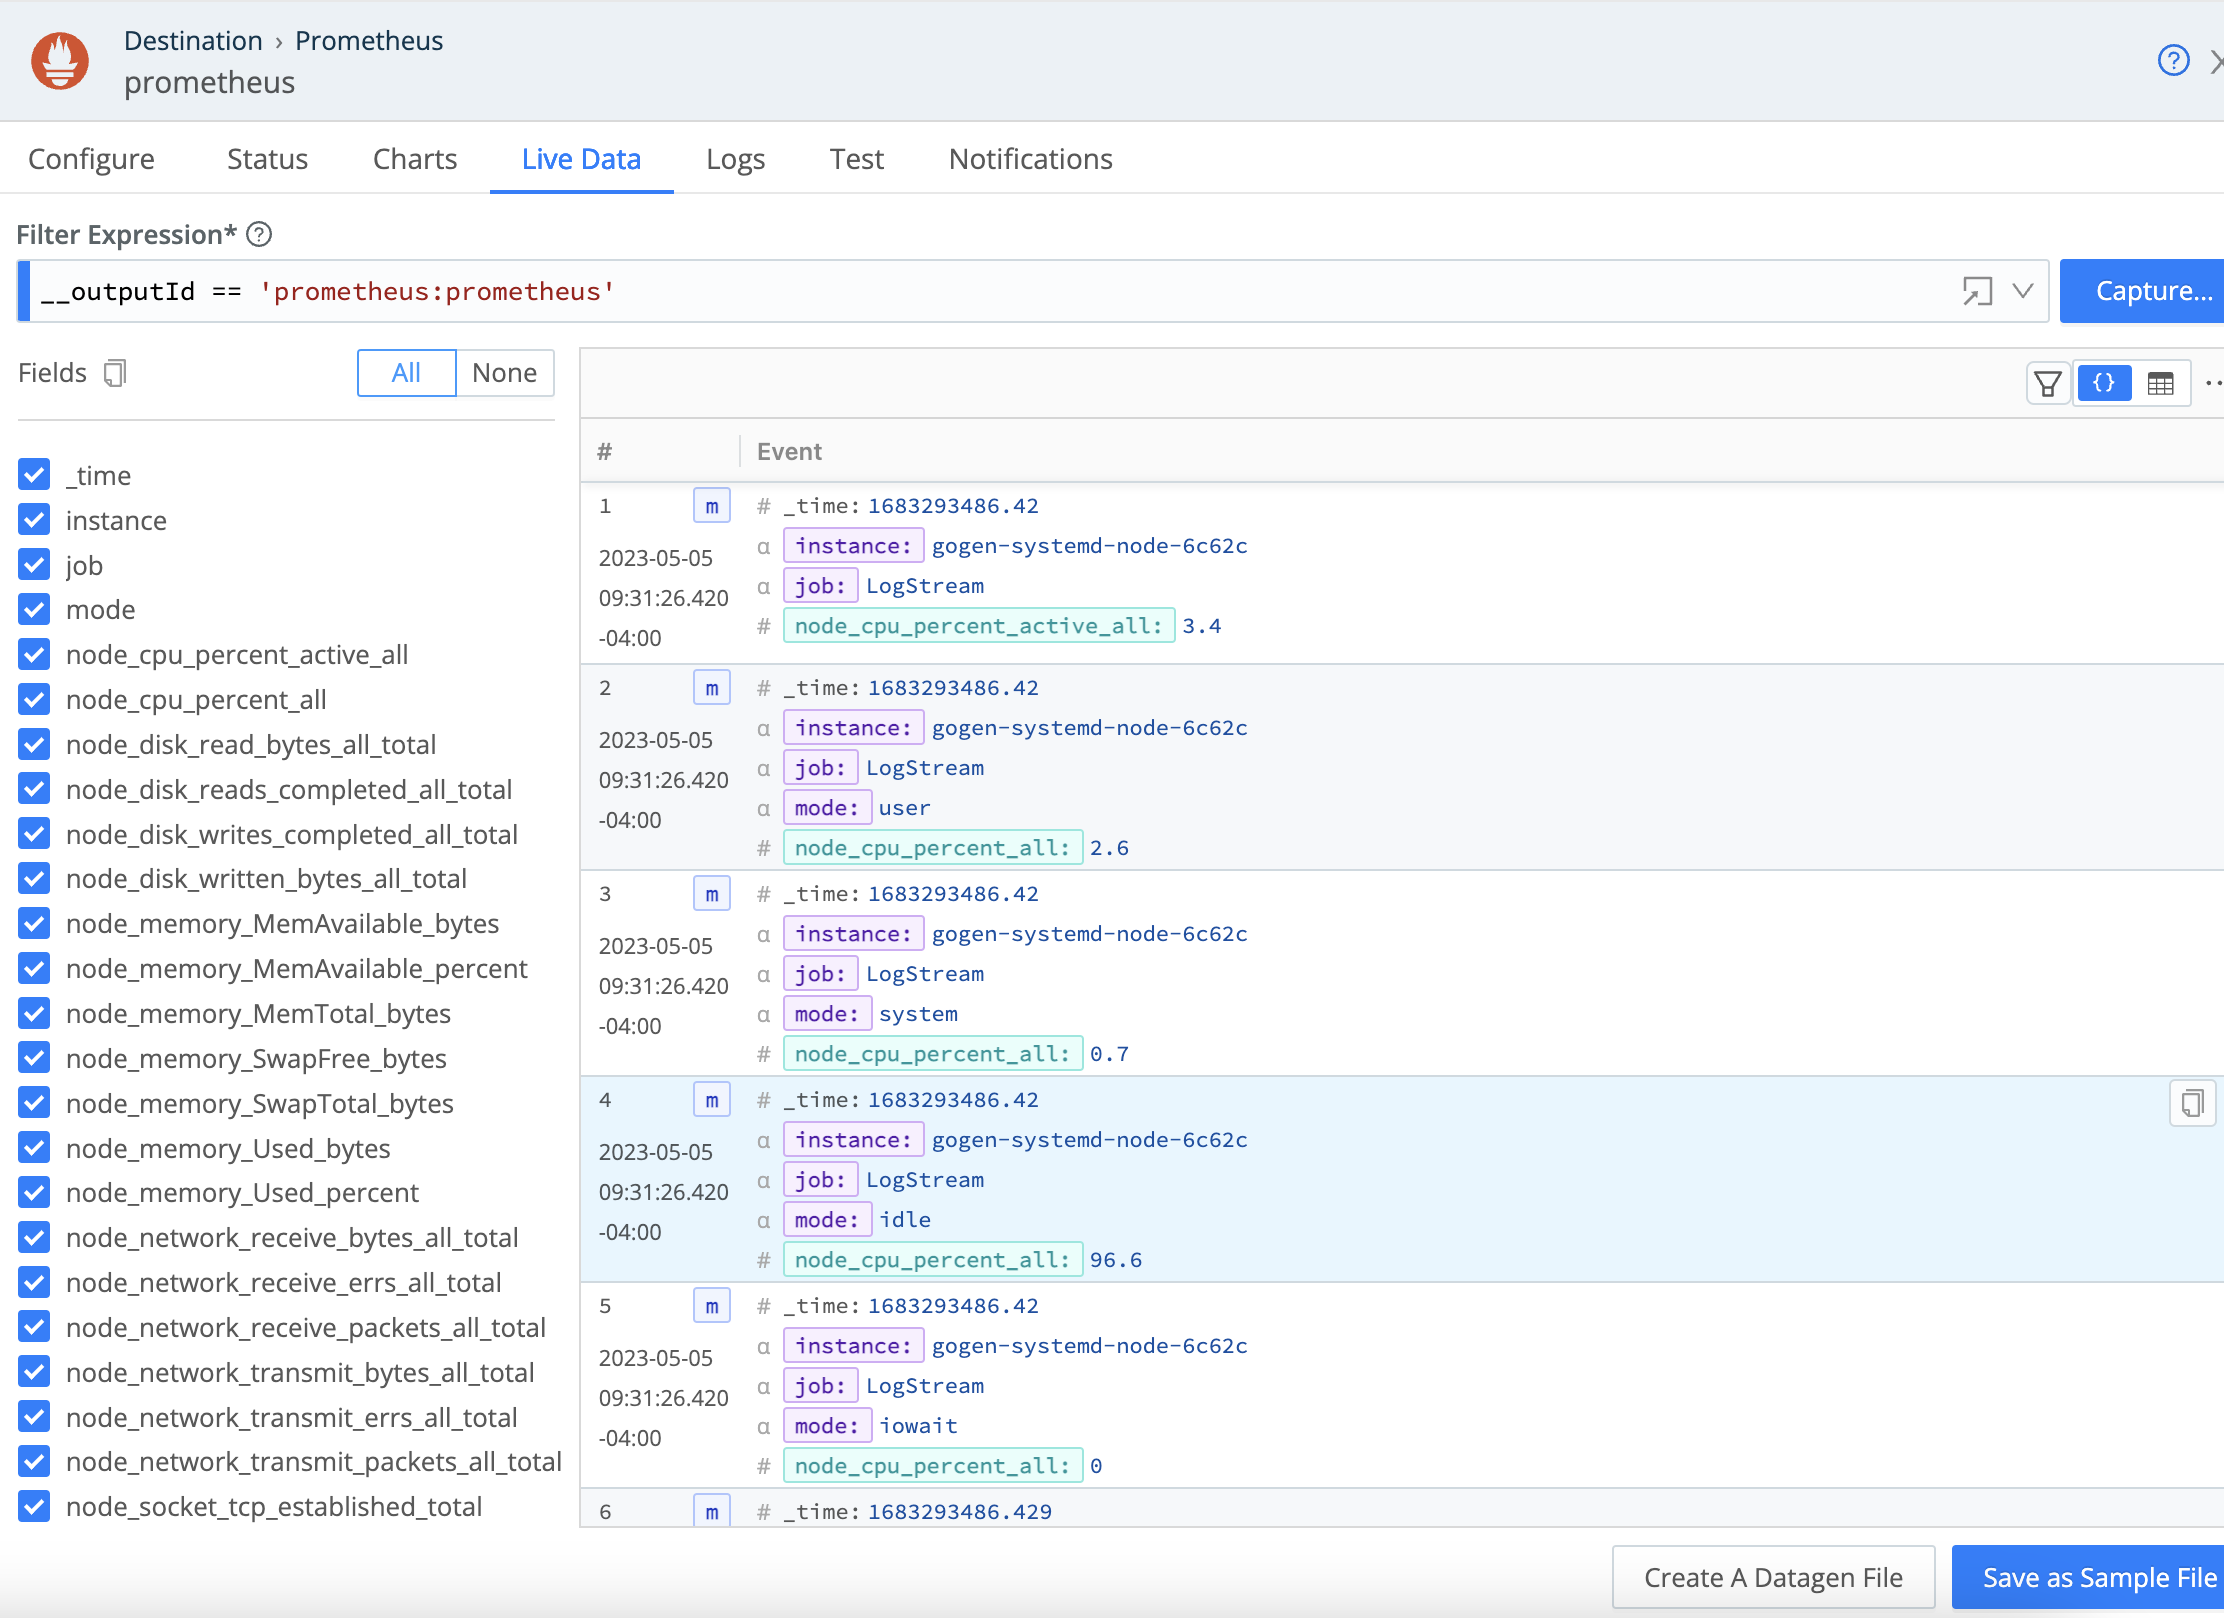
When done, Commit and Deploy your changes. Before moving on to the next step, check the Live Data tab to make sure the metrics are generated.
(Optional) Adjust the prometheus_metrics Pipeline
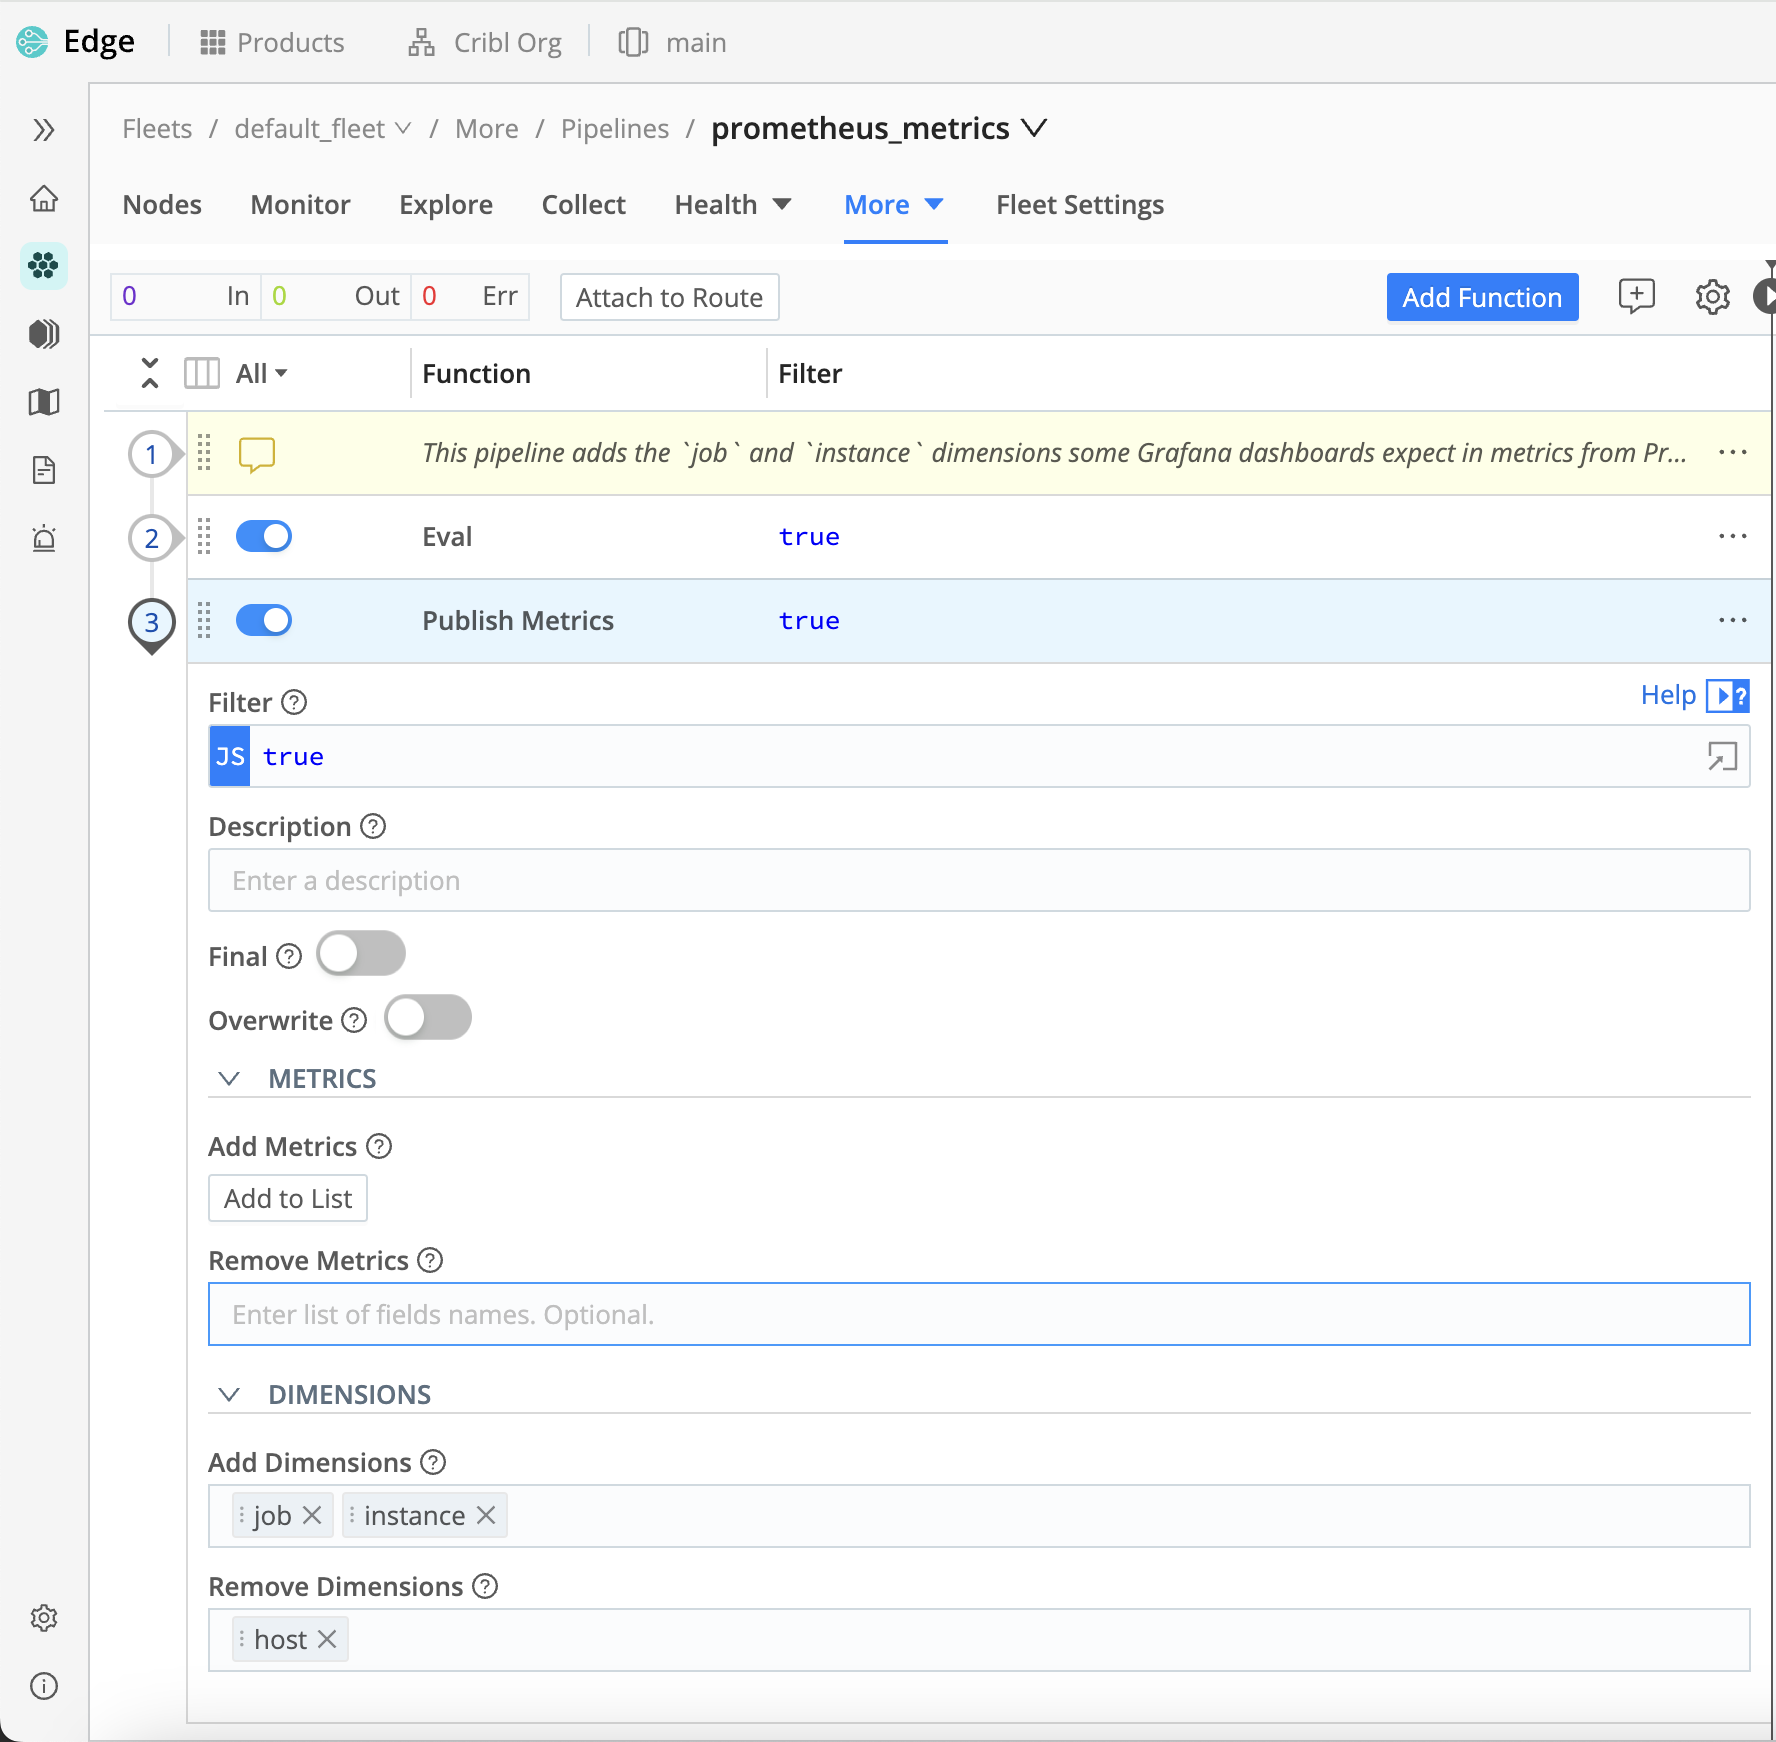
Optionally, you can adjust the prometheus_metrics Pipeline to include the host dimension or add/remove more dimensions.
Select a Fleet to configure. From the Fleet’s submenu, select More > Pipelines.
Configure the Prometheus Destination
Next, we’ll configure the Prometheus Destination to send data to Grafana Cloud.
Next, preview your data on the modal’s Live Data tab.
Visualize the Data in Grafana
Navigate to your Grafana Cloud instance, and select Explore on the left panel to review the node metrics. Selecting metrics and running the query will produce a chart and table of metric events that can be added to new or existing dashboards for analysis. If you are missing some expected metrics, you might need to adjust the variables in your Grafana Cloud instance. For details, see Variables.
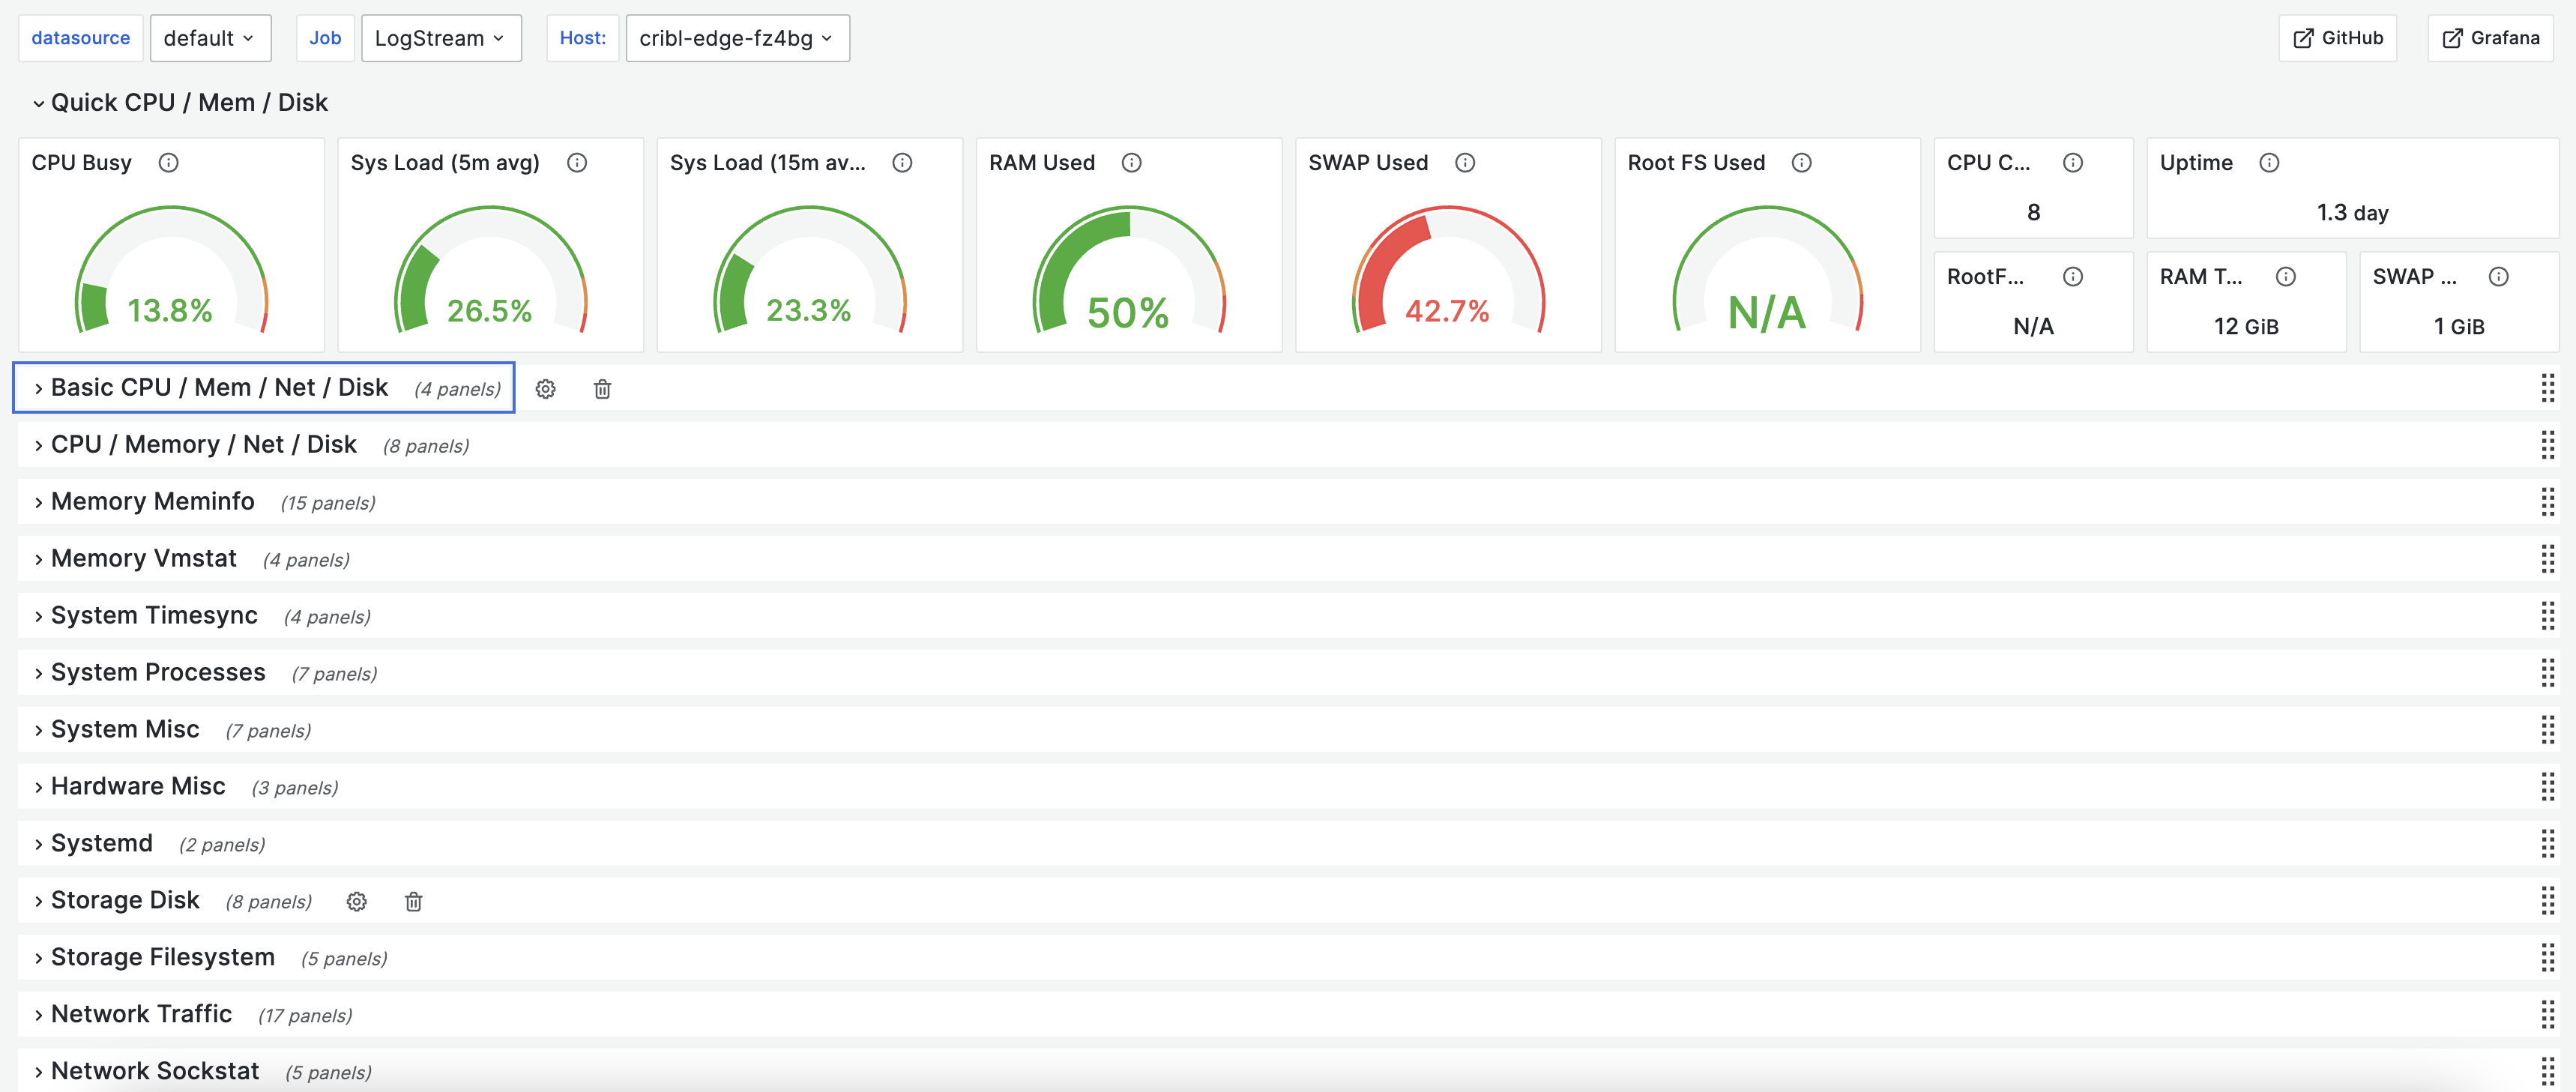
Use the Grafana Filter option to browse the dashboards for your Prometheus data. Below are the Cribl dashboards with the basic and detailed metrics shown.
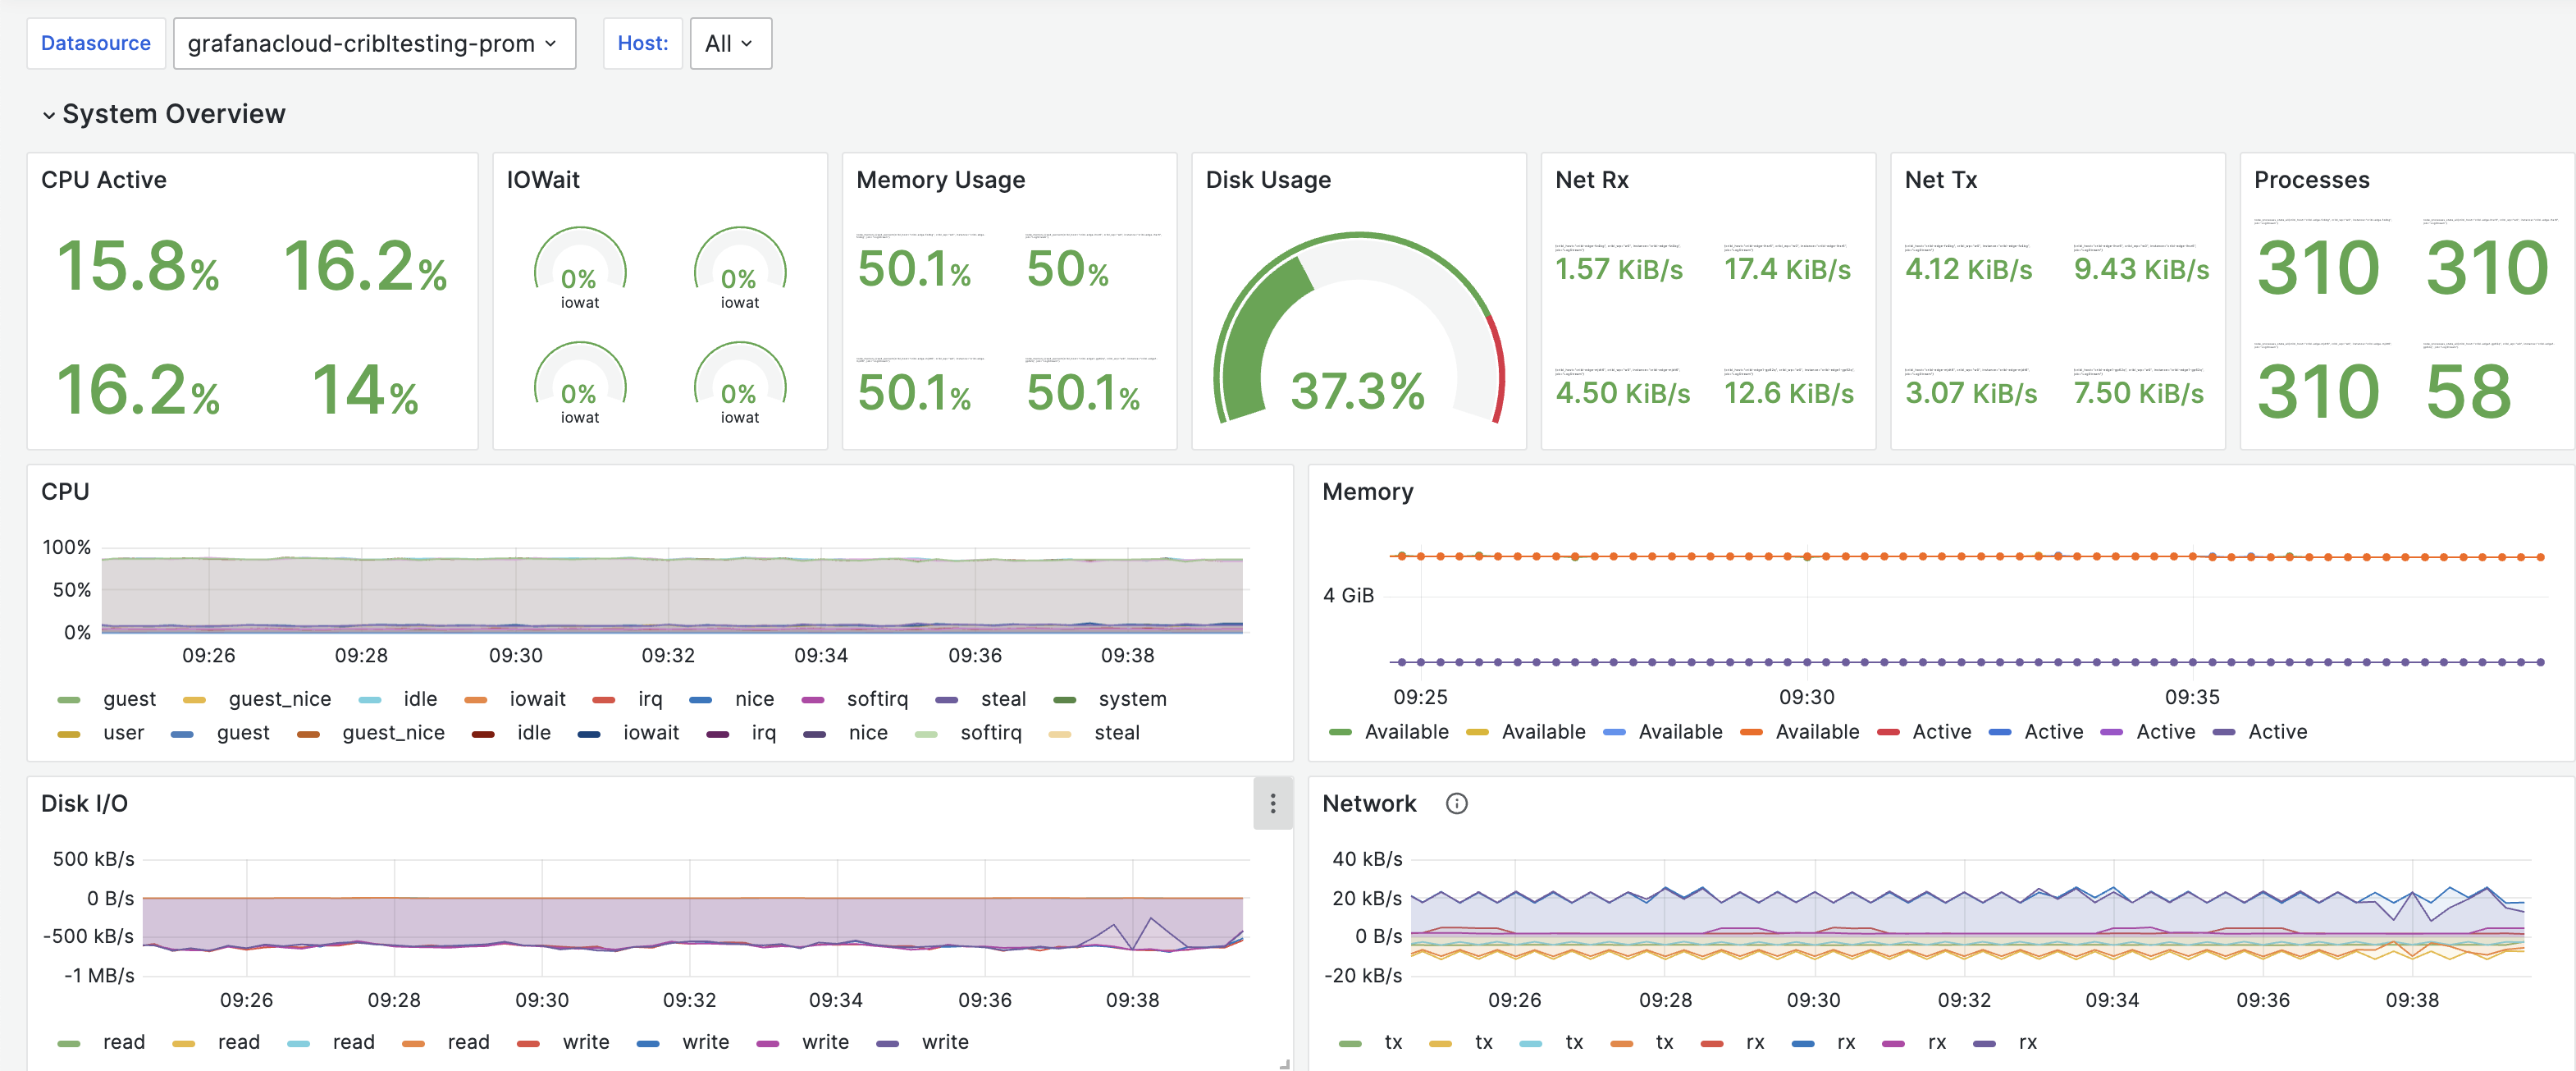
To view the detailed panels, select the arrow for each category: