


These docs are for Cribl Stream 4.12 and are no longer actively maintained.
See the latest version (4.17).
Cribl Edge to Cribl Stream
Cribl Edge automatically discovers logs, metrics, application data, etc. - in real time - from your configured endpoints, and delivers them to Cribl Stream or any supported destination. Meanwhile, Cribl Stream can help collect, reduce, enrich, transform, and route data from Cribl Edge to any destination. And using a Cribl HTTP Source, you can collect and route data from Edge Nodes to Stream Worker Nodes without incurring additional cost.
For more information about sending data between organizations and Workspaces without paying for data twice, see Transfer Data Between Workspaces or Environments.
This guide outlines how to route data from an Edge Node (or an entire Fleet) to an existing Stream Worker Group for additional processing. We will walk you through the following:
- Configure Cribl HTTP Source on Cribl Stream to receive data from the Edge Node.
- Configure the Exec Source on Cribl Edge to collect data on the Edge Node.
- Configure the Cribl HTTP Destination on Cribl Edge to send data to Cribl Stream.
- Configure a Route to Send the Data.
And finally, we will confirm the data flow.
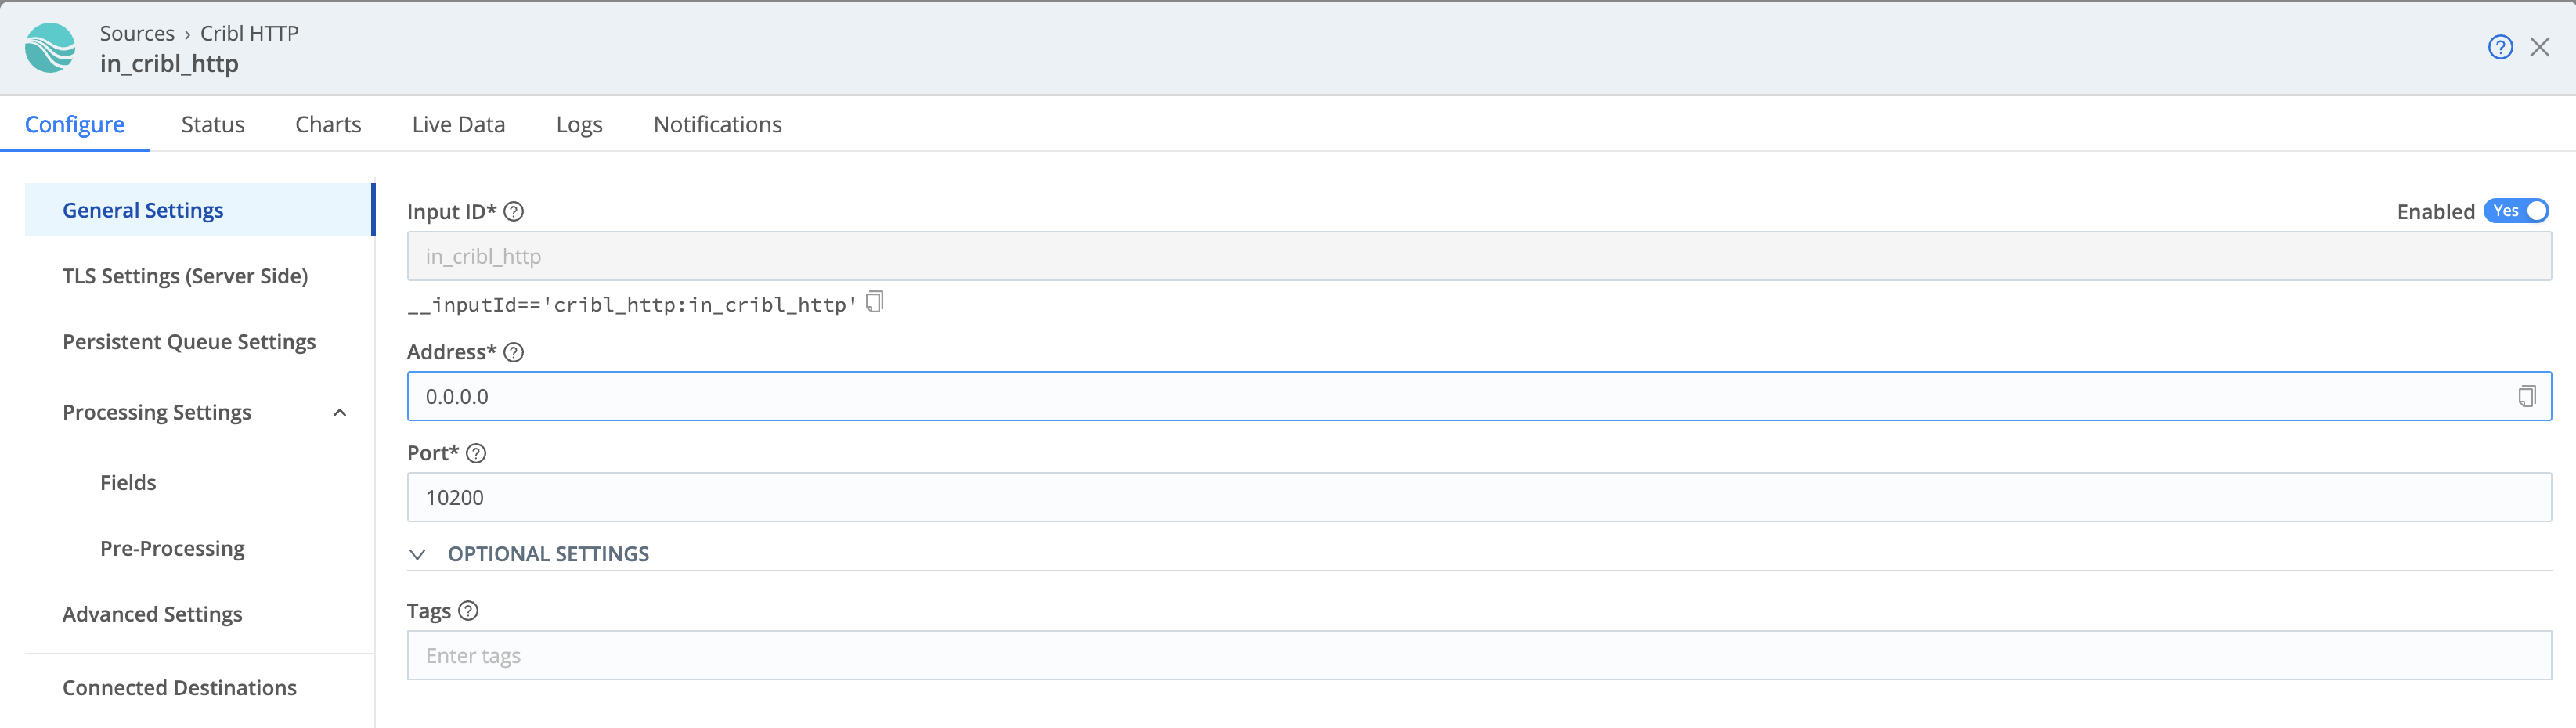
Configure the Cribl HTTP Source on Cribl Stream
In Cribl Stream, start by configuring and enabling a Cribl HTTP Source. The key requirement here is to set the Port to listen on. For this example, we’ll use the default 10200. (Optionally, you can also configure TLS, enable Persistent Queue, and/or a pre-processing Pipeline.)
When done, Commit and Deploy your changes. Before moving on to the next step, confirm that your Source is healthy.

On Cribl-managed Worker/Edge Nodes in Cribl.Cloud, make sure that TLS is either disabled on both the Cribl HTTP Source and the Cribl HTTP Destination it’s receiving data from, or enabled on both. Otherwise, no data will flow. In the Source, TLS is enabled by default.
Configure the Exec Source on Cribl Edge
Next, we’ll configure the Exec Source on your Edge Node. This Source will break the incoming streams of data into discrete events, and send them to Cribl Stream.
In this step, you can swap out the Exec Source by instead configuring a System Metrics or File Monitor Source. Or, configure multiple Sources to connect to the same Destination.
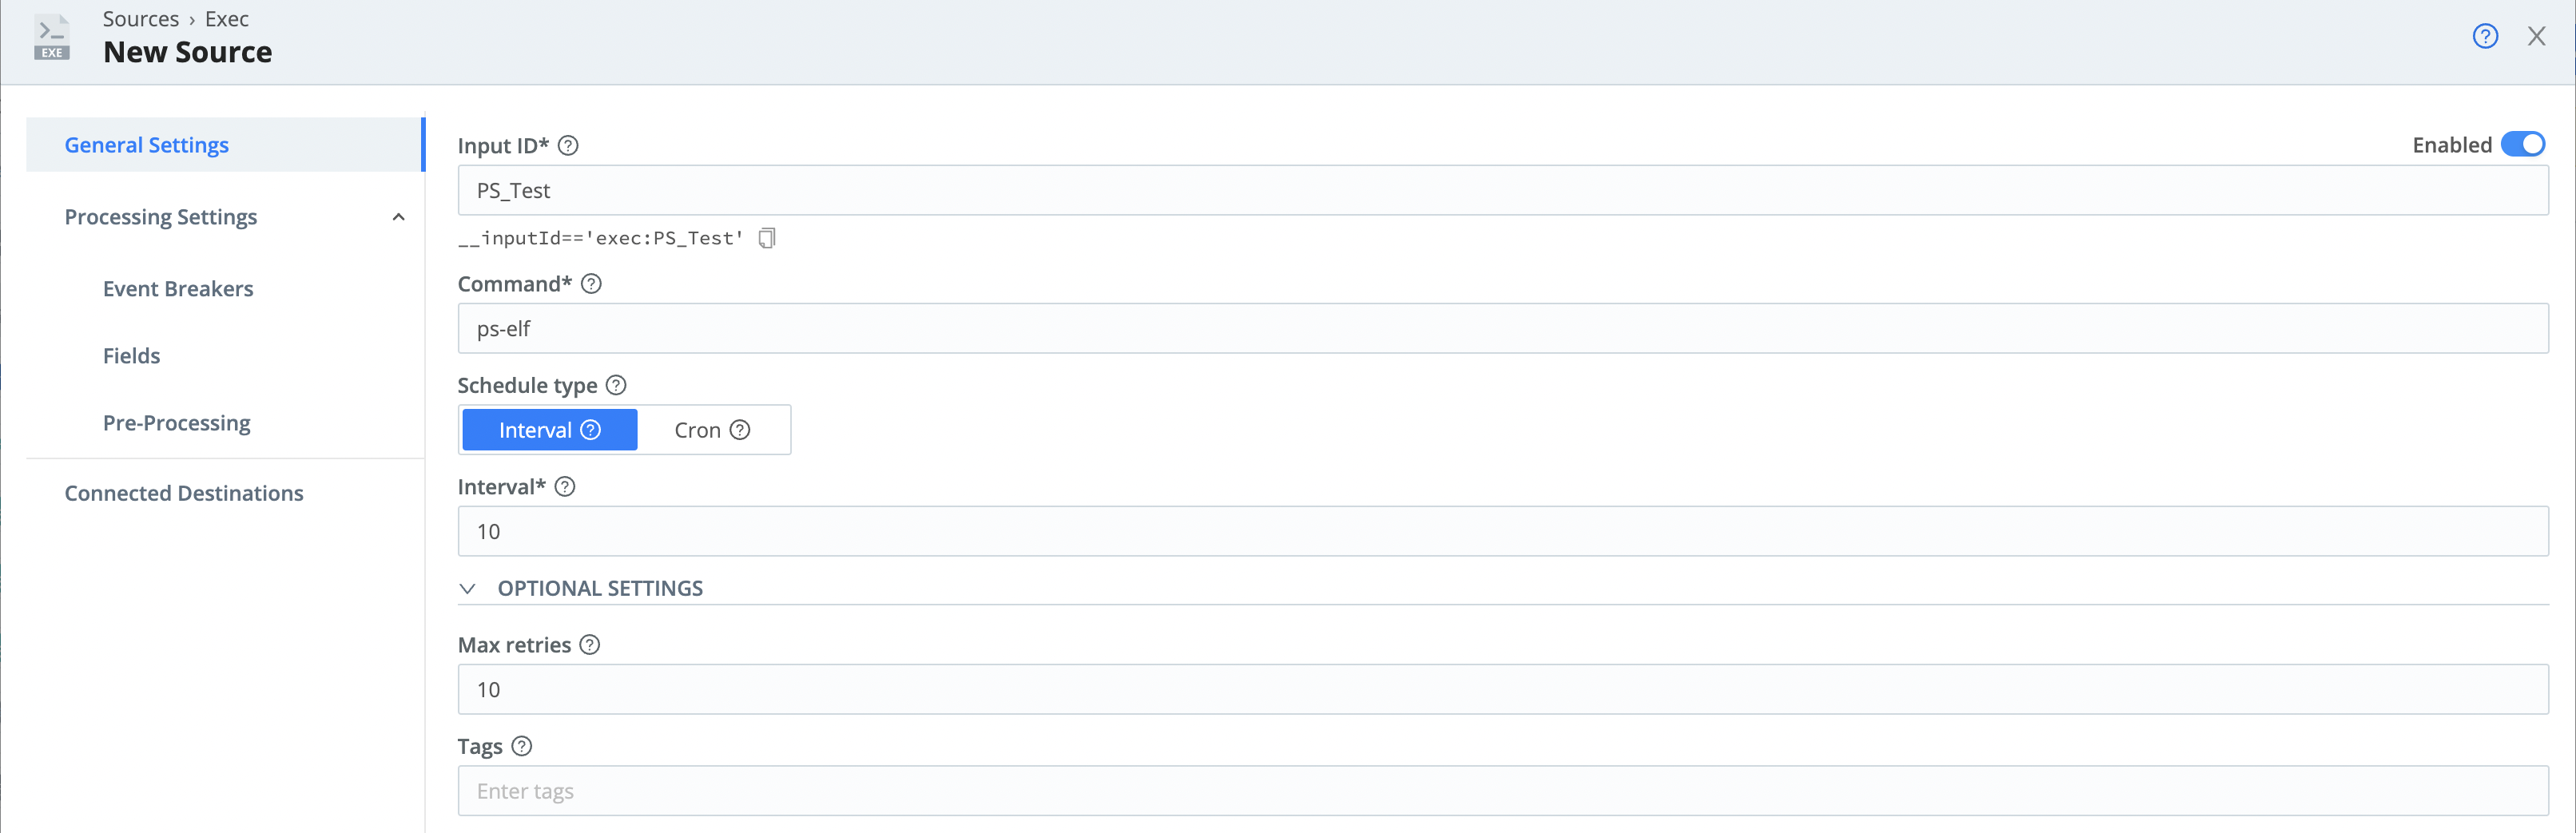
The Exec Source enables you to periodically execute a command and collect its stdout output. In the Exec Source’s configuration modal, specify:
- Which command to execute.
- The number of times to attempt running the command.
- The interval between attempts.
In our example, we are running the ps command to list and retrieve running processes every 10 seconds.
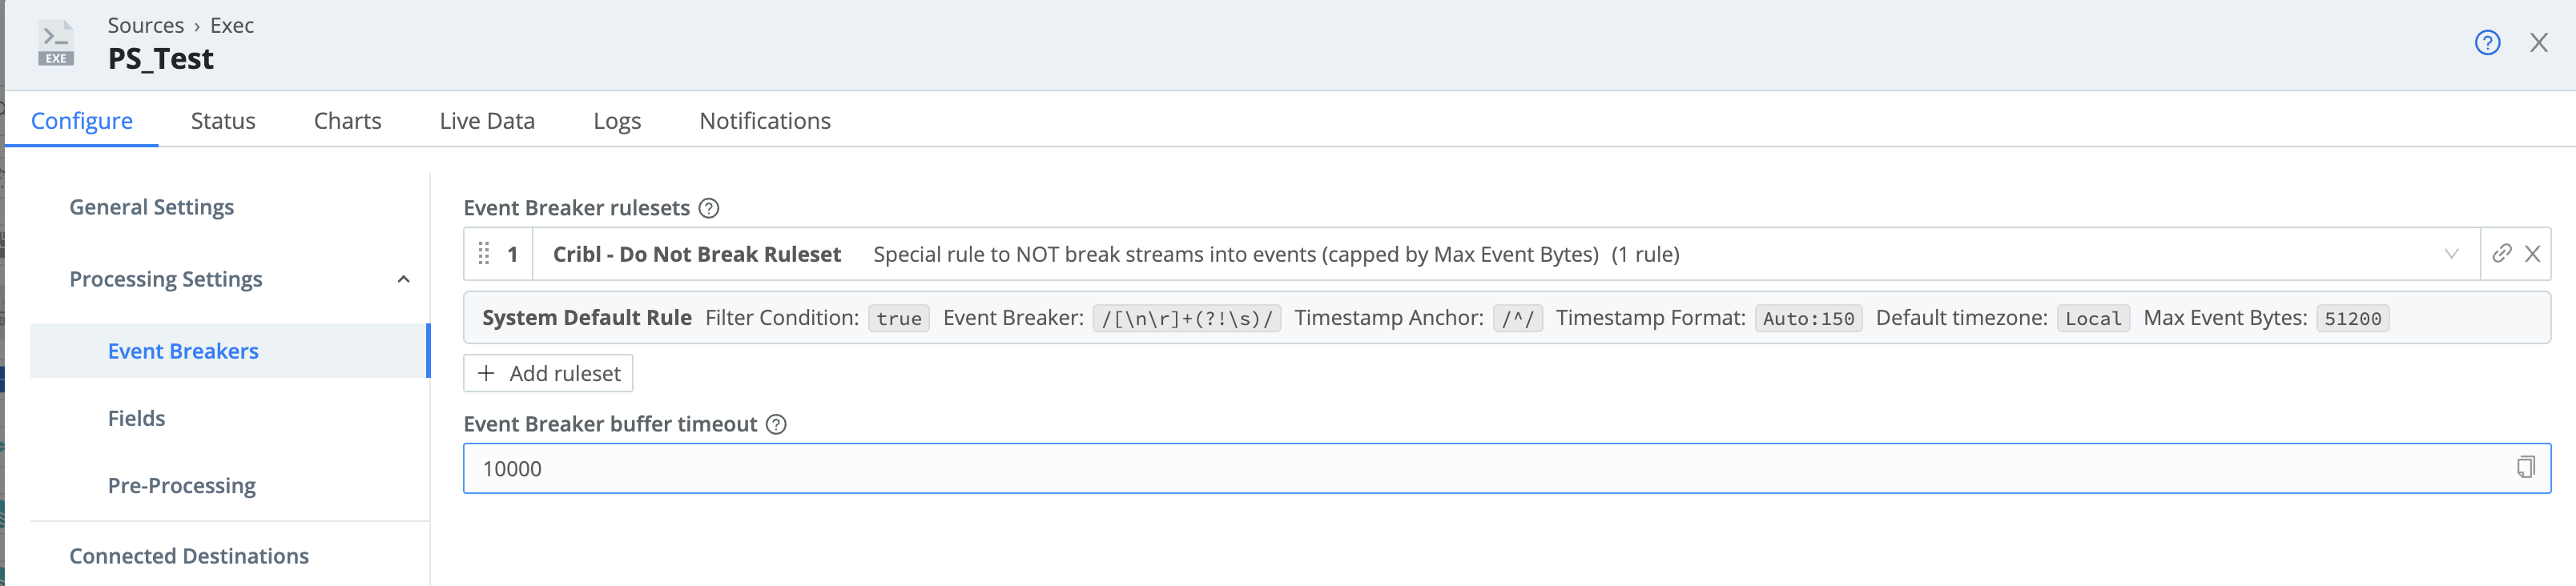
If we don’t configure an Event Breaker, then with each capture we run on the dataset, each process will be ingested as its own event, without the header information. So to structure the data, we’ll add an Event Breaker.
On the Exec Source configuration modal’s left tab, select Event Breaker. In the Event Breaker rulesets drop-down, select Cribl - Do Not Break Ruleset.
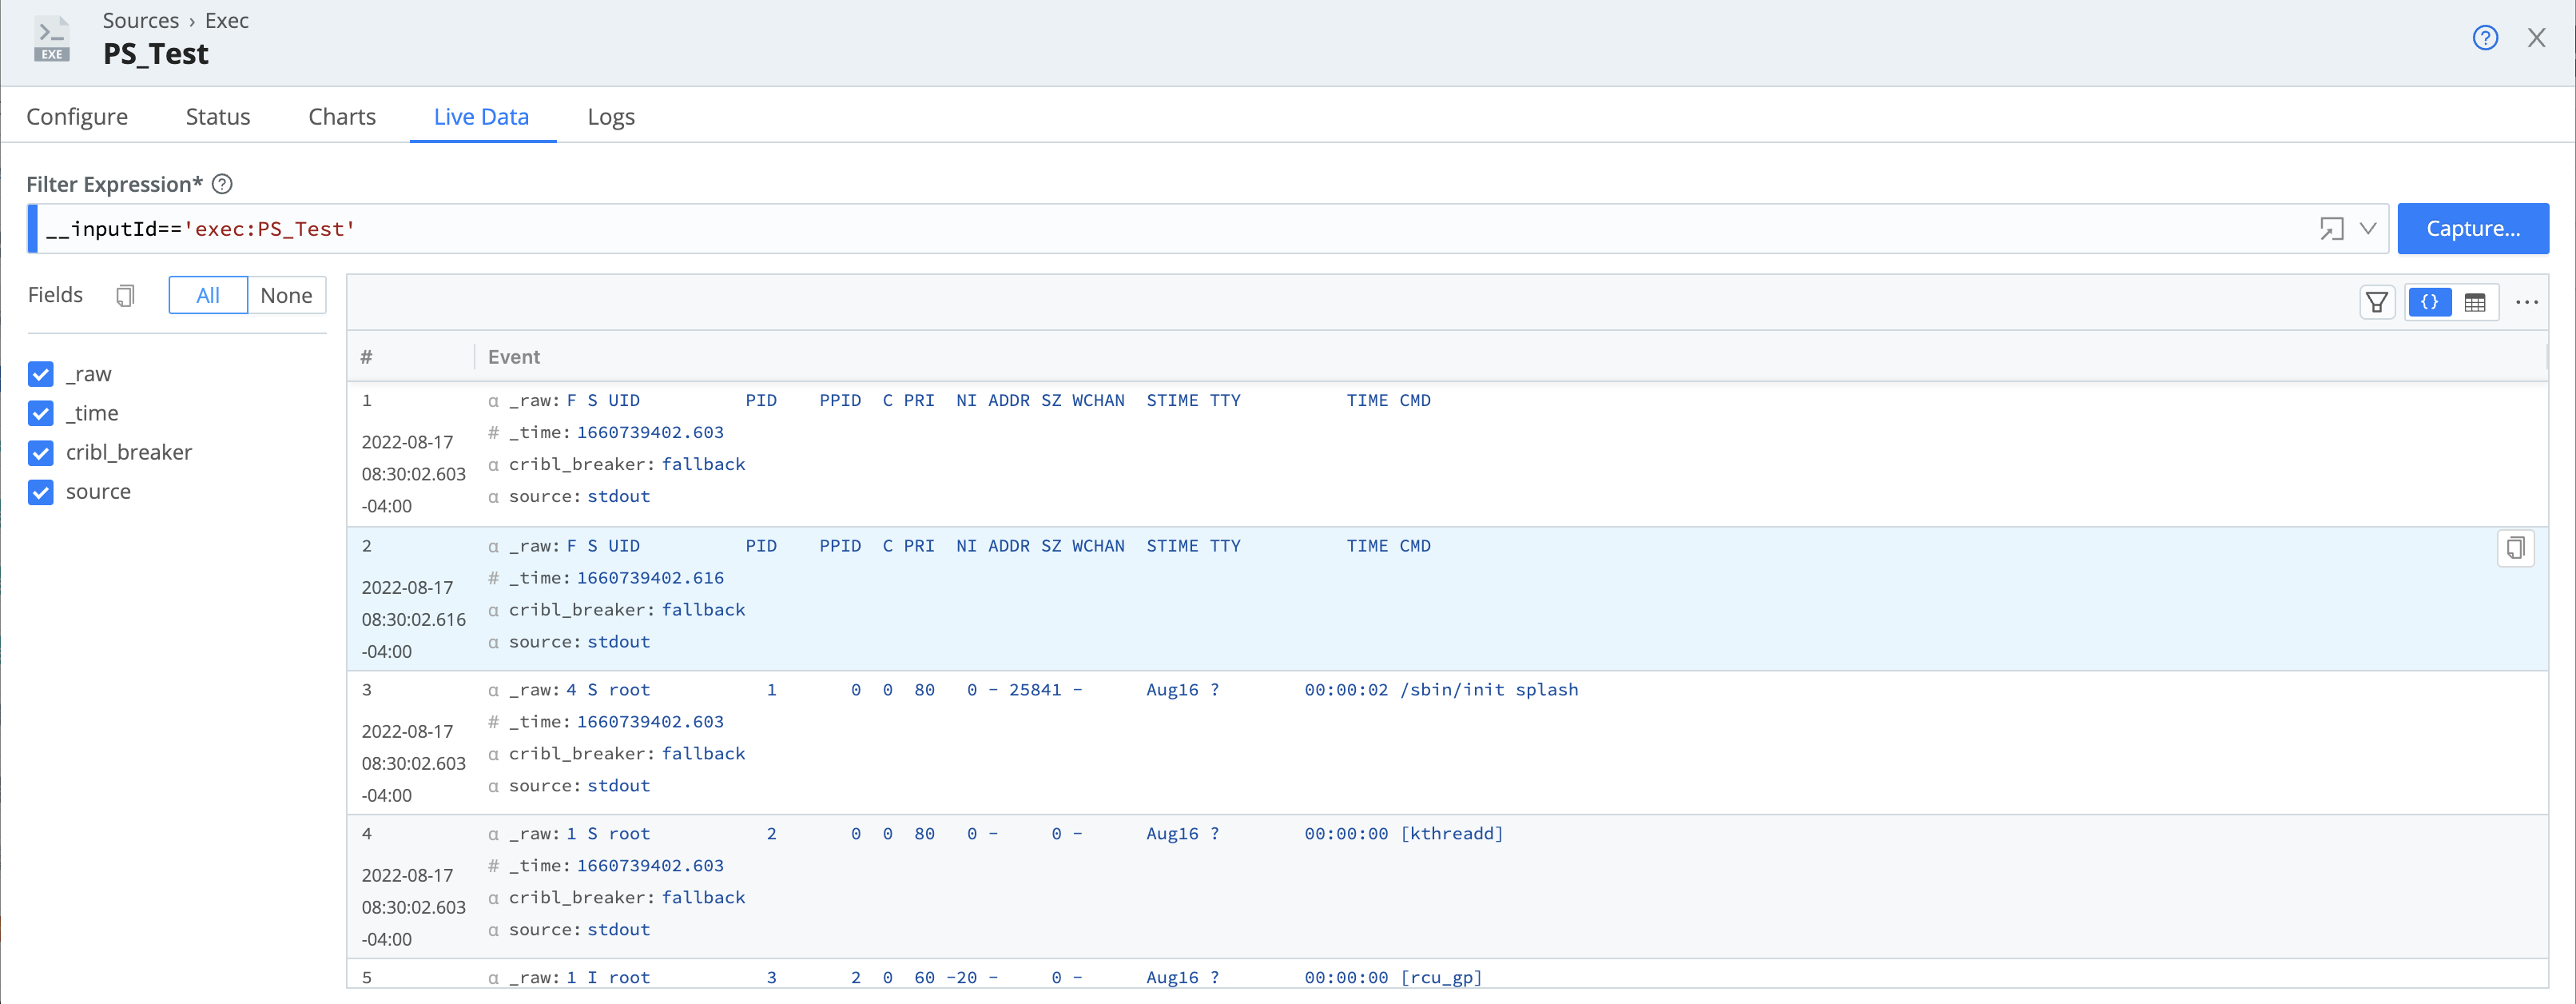
Next, preview your data on the modal’s Live Data tab.
Configure the Cribl HTTP Destination on Cribl Edge
To get the data flowing, we’ll configure the Cribl HTTP Destination on your Edge Node. A few things to note when configuring this Destination:
- The Cribl endpoint field in this Destination must point to the Address and Port you entered on the Cribl HTTP Source you configured in the first step.
- Optionally, define your Compression, Throttling, and Backpressure behavior requirements.
- On Cribl-managed Worker/Edge Nodes in Cribl.Cloud, make sure that TLS is either disabled on both the Cribl TCP Destination and the Cribl TCP Source it’s sending data to, or enabled on both. Otherwise, no data will flow. In the Destination, TLS is disabled by default.
Once you’ve configured your Destination, test it to verify that your Edge Node can communicate with the Stream Worker Group.
Configure a Route to Send the Data
Finally, configure a Route to send your data to Cribl Stream. For this example, we can use the passthru Pipeline.
Confirm the Data Flow
To confirm that your data is flowing, navigate back to Cribl Stream’s Cribl HTTP Source. Run a Live Data capture on the Source.
You can also check the Monitoring page > Data submenu, to isolate the throughput on your Source.