


These docs are for Cribl Stream 4.12 and are no longer actively maintained.
See the latest version (4.17).
Splunk Stream to Cribl Stream
Splunk Stream is a set of three Splunk packages that, combined, enable you to capture and work with streams of network event data. This adds up to a collector for streaming data. You can deploy Splunk Stream in either of two forms:
- As part of a Splunk Universal Forwarder (we’ll call this the forwarder-based config), sending data to a Cribl Stream Splunk TCP Source; or
- As an independent stream forwarder (we’ll call this the ISF config), running on a compatible Linux machine, and sending data to a Cribl Stream Splunk HEC Source.
In either case, the collector process (not to be confused with a Cribl Stream Collector) will need to call home to a Splunk Enterprise process with the Splunk Stream app installed. You’ll manage the collector’s settings in Splunk Enterprise.
For the broader Splunk configuration story, see Splunk’s documentation. Here, we’ll explain one small part of the Splunk configuration process: how to configure Splunk Stream to send the data it captures to Cribl Stream. See the section below - either Forwarder-based or ISF - that corresponds to your use case.
Setting Up the Forwarder-Based Config
Install the Stream TA on the Universal Forwarder targets, either manually or via the deployment server. You’ll need to add a new inputs.conf stanza pointing to your Splunk Stream App management instance. Adapt the example stanza below, replacing the placeholder with the hostname or IP address of your management host.
[streamfwd://streamfwd]
splunk_stream_app_location = https://<your_management_host>:8000/en-us/custom/splunk_app_stream/
disabled = 0The outputs.conf for the Universal Forwarder with Splunk Stream App is the same as for a Universal Forwarder with a non-streaming collector. See these examples.
To verify that your setup is working, run a Live Capture in your Cribl Stream Splunk TCP Source with appropriate filters. Once the Universal Forwarder is sending data to your Cribl Stream Workers, you’re ready to begin working with sample captures, Routes, and Pipelines.
If no data seems to be coming through, check the logs located at /opt/splunkforwarder/var/log/splunk/splunkd.log on each machine where your Forwarder is running.
Setting Up the ISF Config
Splunk Stream as an independent stream forwarder (ISF) can run only on Ubuntu- or RHEL-based x64 Linux machines that have bzip2 installed.
To install Splunk Stream, begin in the Splunk UI:
In the Stream App, navigate to Configuration > Distributed Forwarder Management.
Click the Install Stream Forwarders button.
In the resulting modal, under the text
To get data from other machines, run this command on your data source machine, copy thecurlcommand. E.g.:curl -sSL http://DellT20:8000/en-us/custom/splunk_app_stream/install_streamfwd | sudo bash
On each Linux machine where you want to install Splunk Stream, run the curl command that you copied. Installation will fail if the machine lacks bzip2.
Once installation is complete, return to the Splunk UI.
- To update the HEC endpoint URL, navigate to Actions > Edit Forwarder Group for the desired group.
- Toggle HTTP Event Collector Autoconfig off.
- In the Endpoint URLs field, list your Cribl Stream Worker URLs, as shown here:
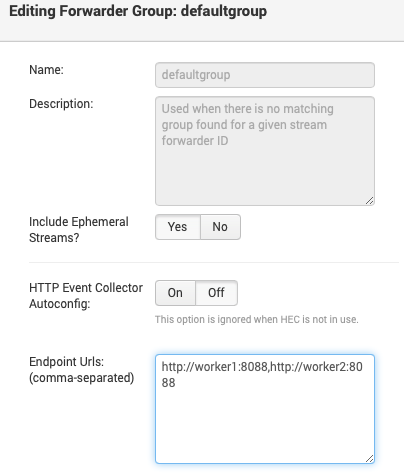
- Click OK.
Finally, on each Linux machine where you’re running Splunk Stream, update the ISF settings with the proper HEC token. (While it is technically possible to run without a token, Cribl strongly recommends against this practice.)
In Cribl Stream, copy the HEC token from your Cribl Stream Splunk HEC Source definition (the value of the
__hecTokeninternal field).On the desired Linux machines, open
/opt/streamfwd/local/streamfwd.confin a text editor.Add the following stanza, substituting your HEC token for the placeholder:
[streamfwd] httpEventCollectorToken = <HEC_token_from_your_Cribl_Stream_Source>Run the following command to restart the ISF:
systemctl restart streamfwd
To verify that your setup is working, run a Live Capture in your Cribl Stream Splunk HEC Source with appropriate filters.
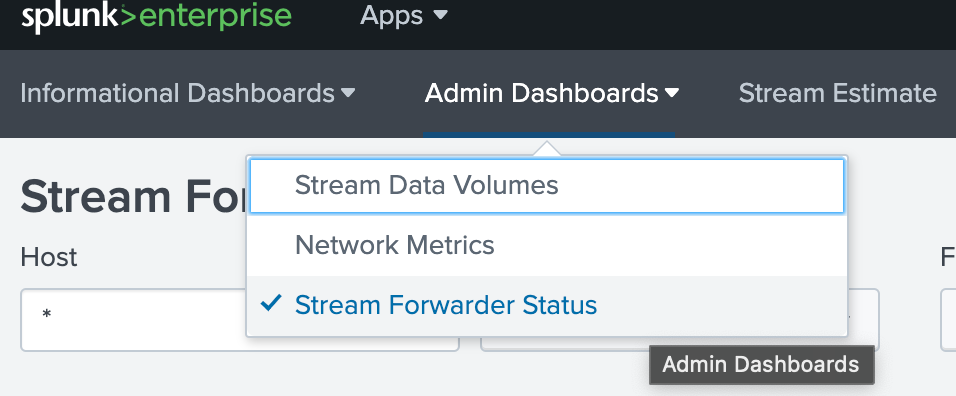
You can also check ISF status in Splunk. Navigate to Apps > Splunk Stream > Admin Dashboards > Stream Forwarder Status:
If no data seems to be coming through, check the logs located at /opt/streamfwd/var/log/streamfwd.log on each machine where your ISF is running.