


These docs are for Cribl Stream 4.3 and are no longer actively maintained.
See the latest version (4.17).
Sample Logs
Collecting samples of the event data you plan to work with in Cribl Stream can make your Cribl Stream onboarding experience even quicker and more efficient than if you don’t.
When you set out to collect sample data, first decide whether to collect before or after the sending agent processes it.
- If you can, collect the data after the agent processes it. Then you can set up Cribl Stream Pipelines more accurately the first time. The best option is live capture with Cribl Stream. Next best is gathering files.
- If the only practical option is to collect data before it reaches the agent, that works, too. (This will usually be a matter of gathering files.) Since setting up Pipelines is an iterative process, you can still arrive at an optimal setup even if it takes a bit longer.
Regardless of what sending agent you’re using, either the Capturing Data with Cribl Stream or the Gathering Original Files section will apply.
Beyond that, there are two supplemental sections: one about how to export data from Elasticsearch, and the other about exporting from Splunk. Of course, these are only two possibilities in a long list of sending agents. If you are using a sending agent that’s not covered here, please join us on Cribl’s Community Slack at https://cribl-community.slack.com/ and share your questions about collecting sample logs.
Describing Sample Data
For every group of sample files, create a README file which includes:
- Sourcetype (e.g., the type of log you’re collecting samples from).
- Originating app or appliance.
- Delivery mechanism (e.g., syslog, Filebeat, Splunk UF, or something else).
- Whether the was data collected before or after processing by the agent.
- A brief description of the data.
Capturing Data with Cribl Stream
Though not always the easiest, this is the best option, because samples are captured exactly as they will look when handed off to Cribl Stream in production. You’ll set Cribl Stream up as a passthrough which gets samples “right off the wire” and dumps them to DevNull.
Configuring Sources
In Cribl.Cloud:
Check the landing page to see whether the pre-defined Sources (Elastic, syslog, and Splunk, among others) are sufficient for your needs. If you need others, configure them using ports in the range 20000-20010.
Or, if your deployment is on-prem or in a private cloud:
Download and install Cribl Stream.
$ mkdir /opt; cd /opt
$ curl -Lso - $(curl https://cdn.cribl.io/dl/latest-x64) | tar zxvf -
$ cribl/bin/cribl startOpen localhost:9000 in a browser.
Configure the Source you need. For simplicity, use port 1024 or higher. (If you must use lower ports you’ll need to follow a different installation procedure.)
Directing Data to Cribl Stream
Point your sending agent at the Cribl Stream Source you created above. How you do this depends on what sending agent you use. See this Cribl blog for a how-to that focuses on Cribl.Cloud but also applies to on-prem deployments.
Live-capturing Data
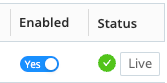
Once data has begun flowing, click the Live button for your chosen Source.
Grab 100 to 500 events, at a minimum. Try to capture as much variety as possible, even if that requires multiple captures.
When finished, click Save as Sample File. Note the file name (and rename if you like). Close the sample window.
In the Routing > Data Routes tab, select the Route you are using.
Your sample file(s) should appear in the Sample Data pane on the right. If the Sample Data pane does not appear, type ] (right square bracket) key to unhide it.
For each file you want to download:
- Click the file name.
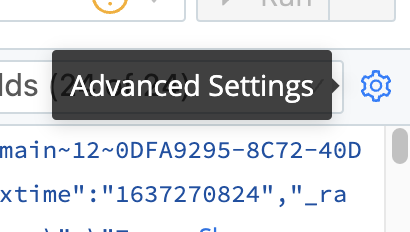
- Click the ⚙️ (gear icon) for Advanced Settings:
- In the resulting pop-up, select Save > NDJSON.
- Once the file finishes downloading:
- Move the file into the directory you’ve created for that set of sample files - which should also include a
READMEas described above.
- Move the file into the directory you’ve created for that set of sample files - which should also include a
- When all files have been moved into the directory, compress the directory as a
.tgzarchive.
Gathering Original Sample Files
If live-capturing data with Cribl Stream is impractical for you, gather sample files that the sending agent has not yet processed, using the following general workflow:
- Create a directory in which to store samples.
- Copy a sample file into the new directory.
- Repeat until all desired sample files have been copied.
- Add a
READMEfile to the directory, as described above. - Redact sensitive content in the data, if required.
- Archive the directory (e.g., with a command like
tar -czf samples.tgz samples) for portability; send it to your Cribl representative, if you are working with one.
Exporting Data from a Platform
If your data is in Elastic or Splunk, and you can neither capture live nor obtain original samples, use one of the following export procedures. Then complete the workflow above, using the exported files instead of original sample files.
If Splunk uses props and/or transforms to modify the
_rawdata of your logs, you must obtain your sample data from the source, because the exported data will not include events in their original form.
Exporting Data from Elastic
Elastic often transforms the data it stores. To the extent possible, note any particulars about the shape and content of the original data before it reached Elastic. Take special care to record the effects of any Logstash pipeline configs on the sample data. Record all this information in the
READMEyou create. This will make it easier to create the most effective filters in Cribl Stream.Install the Logstash plugins logstash-input-elasticsearch and logstash-output-csv:
$ cd /opt/logstash $ bin/logstash-plugin install logstash-input-csv $ bin/logstash-plugin install logstash-output-csvCompose a query to retrieve the data you want. Be sure to include the
messagefield, whose value should be the original event.Substitute your query for the placeholder in the following config snippet, and save the snippet as
output-csv.conf:input { elasticsearch { hosts => "elastic-host:9200" index => "target-index" query => ' {"query": { # your ES query here } } } }}' } } output { csv { fields => ["message", "field1", "field2"] path => "/home/user/ES-sourcetype-export.csv" } }Run your export operation:
/opt/logstash/bin/logstash -f output-csv.conf
Exporting Data from Splunk
You can export logs from Splunk using the GUI or command line.
In the Splunk GUI:
Run a search that returns the appropriate sample of target logs. Adjust the number of samples by appending
| head <number_of_samples_desired>to your search. For example, to grab 100 samples of Cisco ASA firewall data:index=firewall sourcetype=cisco:asa | head 100Adjust the search as needed to exclude or include the events you want to send.
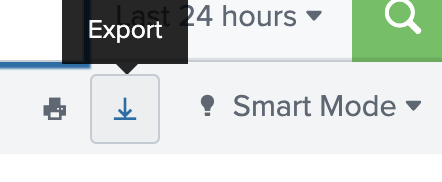
When your search is collecting the desired samples, export the search results:
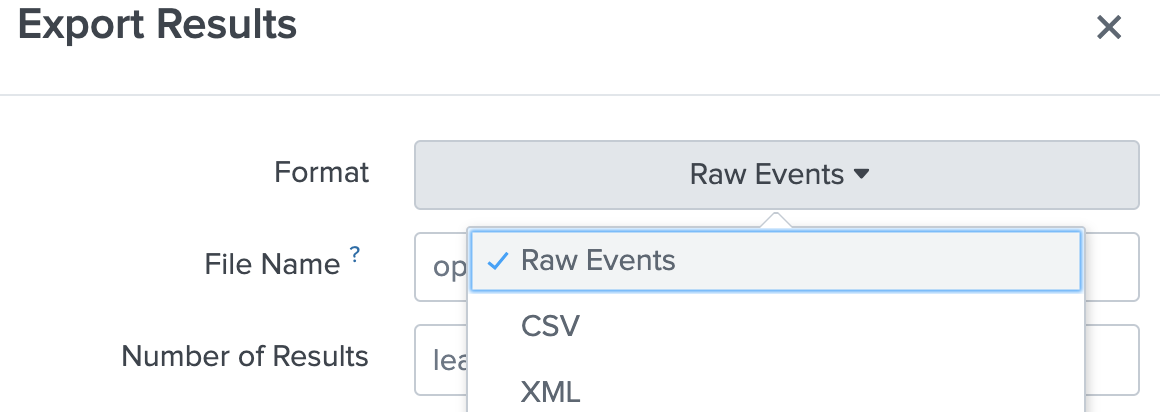
- Then select Raw Events, name the file after the source or sourcetype, and save.
Or, in the Splunk CLI:
You can obtain the same results as described in the previous section using commands like the following.
% $SPLUNK_HOME/bin/splunk search "index=firewall sourcetype=cisco:asa | head 100" -output rawdata > cisco_asa_sample.txt