


These docs are for Cribl Stream 4.4 and are no longer actively maintained.
See the latest version (4.17).
System Metrics
Cribl Stream instances can collect metrics from their Linux hosts, and can populate some standard metrics dashboards right out of the box. To see all of the metrics this Source supports, check out Linux System Metrics Details.
Type: System | TLS Support: N/A | Event Breaker Support: No
Cribl Edge Workers support this System Metrics Source only when running on Linux. To collect metrics from Windows hosts, use the Windows Metrics Source.
This Source is not available on Cribl-managed Cribl.Cloud Workers.
Configuring Cribl Stream to Collect System Metrics
From the top nav, click Manage, then select a Worker Group to configure. Next, you have two options:
Configure via QuickConnect
- In the submenu, click Collect (Edge only).
- Click Add Source at left. From the resulting drawer’s tiles, select [System and Internal >] System Metrics.
- Click either Add New or (if displayed) Select Existing.
The General Settings drawer will open.
Configure via Routing
- Click Data > Sources (Stream) or More > Sources (Edge).
- From the resulting page’s tiles or left nav, select [System and Internal >] System Metrics.
- Click New Source to open a New Source modal that provides the options below.
General Settings
Input ID: Enter a unique name to identify this Source definition.
Optional Settings
Polling interval: How often to collect metrics, in seconds. Defaults to 10.
Tags: Optionally, add tags that you can use to filter and group Sources in Cribl Stream’s Manage Sources page. These tags aren’t added to processed events. Use a tab or hard return between (arbitrary) tag names.
Host Metrics
Use the buttons to select a level of detail.
- Basic enables minimal metrics, averaged or aggregated.
- All enables full, detailed metrics, specified for individual CPUs, interfaces, and so on.
- Custom displays sub-menus and buttons from which you can choose a level of detail (Basic, All, Custom, or Disabled) for each type of event.
- Disabled means that no metrics will be generated.
The meaning of All and Disabled are self-evident. Basic and Custom have different meanings depending on event type, as follows:
System
Basic level captures load averages, uptime, and CPU count.
Custom toggles Process metrics on or off; these are metrics for the numbers of processes in various states.
CPU
Basic level captures active, user, system, idle, iowait percentages over all CPUs.
Custom toggles the following on or off: Per CPU metrics, Detailed metrics (meaning, for all CPU states), and CPU time metrics (meaning raw, monotonic CPU time counters).
Memory
Basic level captures captures total, used, available, swap_free, and swap_total.
Custom toggles Detailed metrics on or off. Detailed means for all memory states.
Network
Basic level captures bytes, packets, errors, connections over all interfaces.
Custom exposes the following:
- The Interface filter, which specifies which network interfaces to include or exclude (all are included if the filter is empty).
- Per interface metrics, which toggle on or off.
- Detailed metrics, which toggle on or off. If on, the Protocol metrics toggle appears, allowing you to choose whether to generate metrics for ICMP, ICMPMsg, IP, TCP, UDP, and UDPLite.
Disk
Basic level captures disk used in percent, bytes read and written, and read and write operations, over all mounted disks.
Custom exposes the following:
- The Device filter, which specifies which block devices to include or exclude (all are included if the filter is empty). Wildcards and
!(not) operators are supported. - The Mountpoint filter, which specifies which filesystem mountpoints to include or exclude (all are included if the filter is empty). Wildcards and
!(not) operators are supported. - The Filesystem type filter, which specifies which filesystem types to include or exclude (all are included if the filter is empty). Wildcards and
!(not) operators are supported. - Per device metrics, which toggle on or off.
- Detailed metrics, which toggle on or off. If on, the Enable inode metrics toggle appears, allowing you to choose whether to generate metrics for filesystem inodes.
Process Metrics
With Process Metrics enabled, Cribl Stream captures process-specific metrics from Linux servers and reports them as events. This allows you to monitor specific processes on Cribl.Cloud instances. You can generate events for any process object.
To collect a process metrics event, create a Process Set and add a filter expression. Processes that match the filter are returned as individual events. See Collecting Metrics. Process Sets are separate from aggregate and host-wide metrics.
Process-specific metrics are not affected by the Host Metrics detail setting.
Adding a Process Set
To add a Process Set:
- Open the System Metrics Source and access the Configure tab.
- Click the Process Metrics menu, then Add process set.
- Configure the details:
- Set name: The name for this process set.
- Filter expression: The JavaScript expression that will filter the processes.
- Include children: When toggled to “Yes”, the processes that match the filter include metrics for child processes.
Filtering Processes
You can filter processes using the field names and values from each process object.
Tip
To see all processes currently running on an Edge Node, click Explore in the submenu and open the Processes Tab.
Example filters
This filter looks for Java processes in the sleep state (an interruptible wait) that are using more than 100% of the CPU or more than 25% of memory:
cmdline.args[0] == 'java' && status == 'S' && (cpu > 100 || memory_percent > 25)
This filter looks for running NGINX web servers that have more than 12 open file descriptors:
service == 'nginx' && fds > 12
Here are some more Linux processes you could find metrics for:
cmdline.args[0].endsWith('/java') && cmdline.args[1] == 'nifi'exe.path == '/usr/bin/sshd'uid == 2cgroup.0 == /user.slice/user-1000.slice/stat.status == Rstat.starttime > 943517cpu > 30memory_percent > 30stat.num_threads > 10
The Filter expression field expects a specific syntax in order to apply the filter to the processes. These expressions evaluate to either
trueorfalse. See Filters for more information.
Collecting Metrics
Once you have at least one Process Set created and saved, Cribl Stream will begin collecting process metrics at the interval defined in the Polling interval field (General Settings menu).
To view the status of the Collector and total events collected, click the Status tab in the Linux Metrics Source.
To view a live capture of individual metrics gathered from processes that match
the Process Set, click the Live Data tab. The Process Set that owns each
metric is represented by the __process_set internal field.
Supported Processes
To view the complete table of supported Linux process metrics, their descriptions, types, and dimensions, see Process-Specific Metrics.
Using Advanced Mode
To test your filter expression against a sample input, click the Advanced mode button within the Filter expression field. The Filter expression modal will open.
Here, you can paste in your filter expression, select a sample JSON input from the drop-down (or enter your own directly in the Sample input field), and select a specific event to test against.
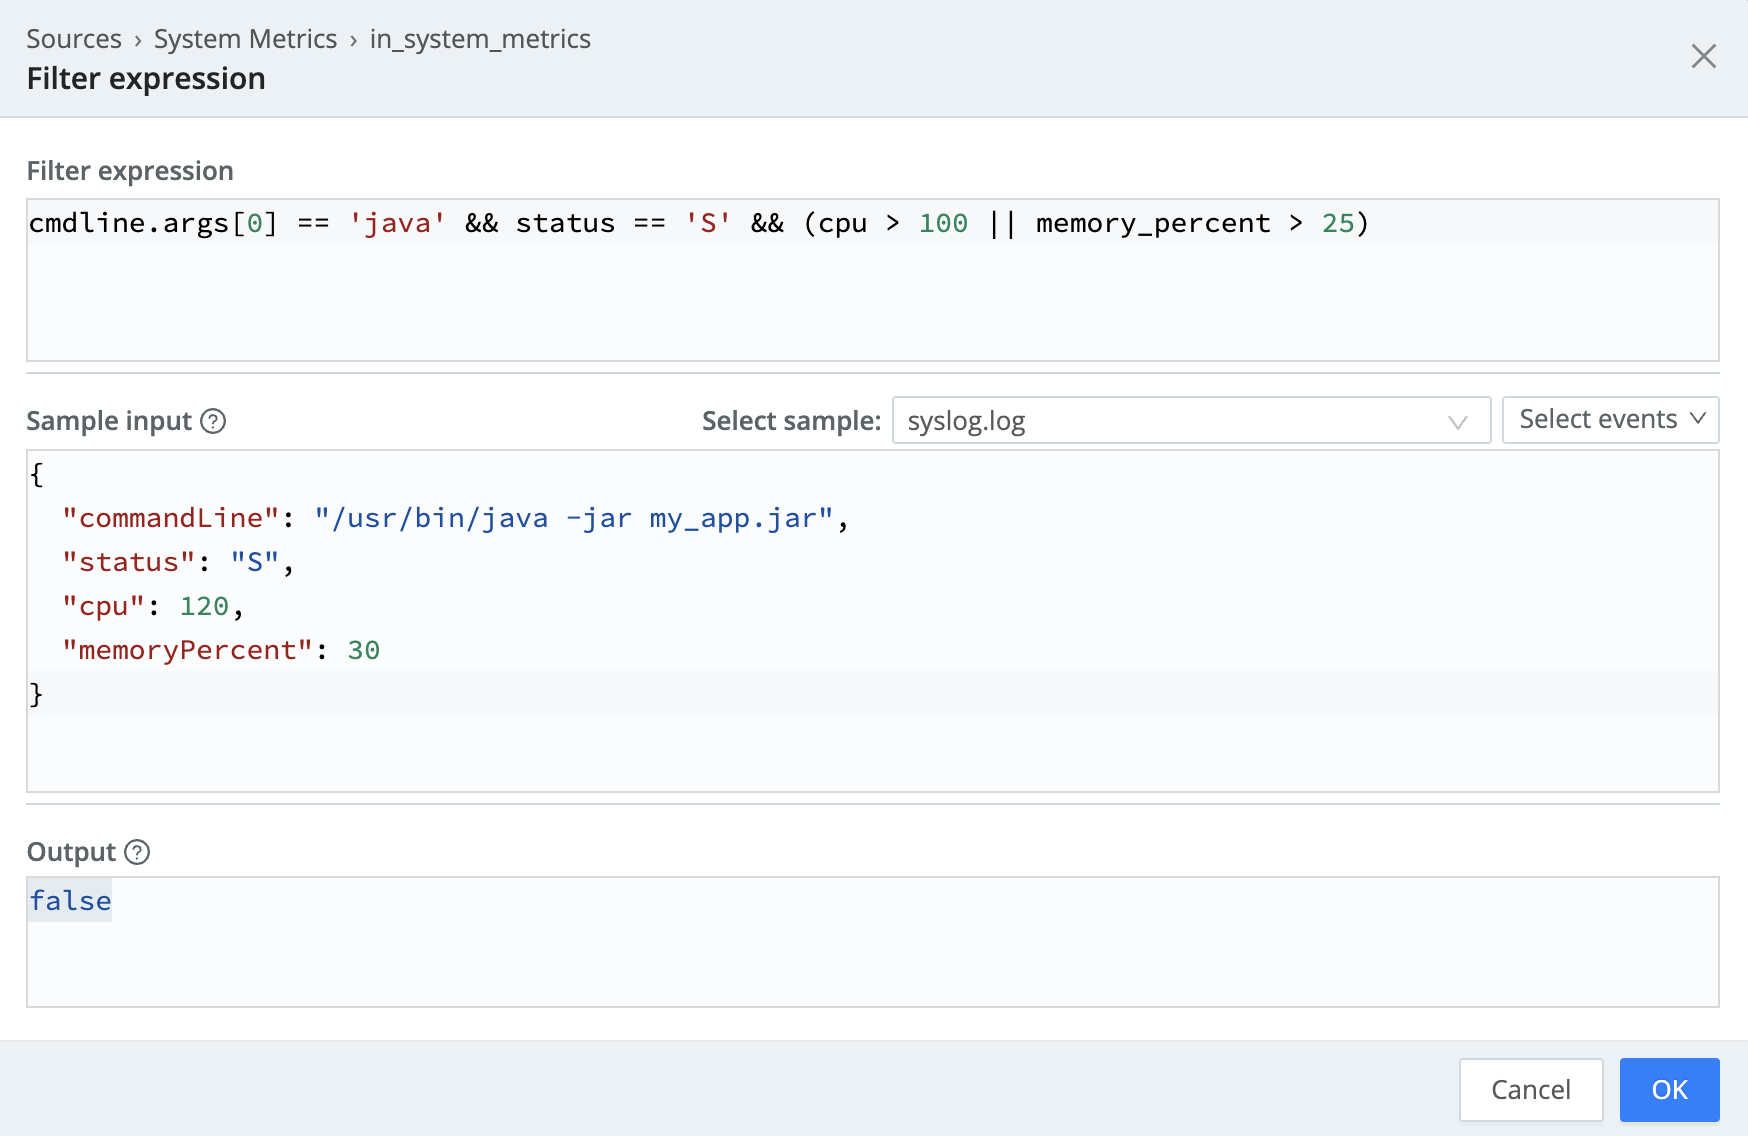
The Output will show you if the filter expression returns any matching processes, based on the filter expressions and JSON input.
Container Metrics
Use the buttons to select a level of detail.
- Basic generates the server event and per running container events.
- All adds per-device and detailed metrics.
- Custom provides controls for customizing which containers to generate metrics from.
- Disabled means that no metrics will be generated.
The Custom buttons displays additional controls, as follows:
- Container Filters: Enter a filter expression to govern which containers to generate metrics from. Leave empty (the default) to generate metrics from all containers.
- All containers: Toggle to
Yesto include stopped and paused containers. - Per device metrics: Toggle to
Yesto generate separate metrics for each device. - Detailed metrics: Toggle to
Yesto generate full container metrics.
The Basic, All, and Custom buttons provide the following Advanced Settings, which are different from those in the main Advanced Settings tab:
- Docker socket: Enter the full path(s) for Docker’s UNIX domain socket. Defaults to
/var/run/docker.sockand/run/docker.sock. - Docker timeout: Timeout, in seconds, for the Docker API. Defaults to
5.
Processing Settings
Fields
In this section, you can add Fields to each event using Eval-like functionality.
Name: Field name.
Value: JavaScript expression to compute field’s value, enclosed in quotes or backticks. (Can evaluate to a constant.)
Pre-Processing
If desired, choose a Pipeline from the drop-down if you want to process data from this Source before sending it through the Routes.
Disk Spooling
Enable disk persistence: Whether to save metrics to disk. When set to Yes, exposes this section’s remaining fields.
Bucket time span: What time range of events to hold in each bucket. Default value: 10m (10 minutes).
Max data size: Maximum disk space the persistent metrics can consume. Once reached, Cribl Stream will delete older data. Example values: 420 MB, 4 GB. Default value: 100 MB.
Max data age: How long to retain data. Once reached, Cribl Stream will delete older data. Example values: 2h, 4d. Default value: 24h (24 hours).
Compression: Optionally compress the data before sending. Defaults to gzip compression. Select none to send uncompressed data.
Path location: Path to write metrics to. Default value is $CRIBL_HOME/state/system_metrics.
Advanced Settings
Environment: If you’re using GitOps, optionally use this field to specify a single Git branch on which to enable this configuration. If empty, the config will be enabled everywhere.
Connected Destinations
Select Send to Routes to enable conditional routing, filtering, and cloning of this Source’s data via the Routing table.
Select QuickConnect to send this Source’s data to one or more Destinations via independent, direct connections.
Populating Dashboards with System Metrics
Cribl has configured a Prometheus dashboard to display Cribl Stream System Metrics, and shared the dashboard in the Grafana library, which is public. This is a relatively simple dashboard suitable for showing aggregate metrics. Try this dashboard if you prefer Basic mode for most of your metrics.
Another useful dashboard is the one that’s commonly used with Prometheus and their Node Exporter agent, found here. This dashboard can handle the highly detailed metrics. To use this dashboard, attach the prometheus_metrics pre-processing pipeline, and choose All mode.
For details on how populate your Grafana Cloud dashboards with system metrics, see System Metrics to Grafana.