


These docs are for Cribl Stream 4.5 and are no longer actively maintained.
See the latest version (4.17).
Syslog Best Practices
Cribl Stream can process a syslog stream directly. Moving to Cribl Stream from existing syslog-ng or rsyslog servers fully replaces those solutions with one that is fully supported and easily managed.
Processing syslog in Cribl Stream allows you to readily address these common challenges of ingesting data from syslog senders:
- Architecture: Cribl Stream routes the syslog stream directly, immediately, and securely to the destinations of your choice, reducing latency and management overhead.
- Volume: Removing redundant data and unnecessary fields in Cribl Stream typically reduces volume 20-30% overall. It also optimizes the data for downstream services like Splunk or Elasticsearch.
- Timestamp handling: Cribl Stream intelligently processes events sent from different time zones. It can embed a new, consistent timestamp, and can auto-correct timestamps that are off by an exact number of hours.
- Severity/Facility accuracy: Each syslog event begins with a bracketed integer that represents Facility and Severity, as defined in the Syslog Protocol. Cribl Stream translates this code (e.g.,
<165>,<0>) into the correct Facility and Severity values. - Metadata: Cribl Stream can automatically set metadata fields, including
sourcetypeandindex.
This tutorial outlines best practices for replacing your syslog server with Cribl Stream. To go even a bit deeper, check out this Cribl Office Hours video.
The Goal: Optimizing Syslog Events
By default, a Cribl Stream Syslog Source produces eight fields: _time, appname, facility (numeric), facilityName (text), host, message, severity (numeric), and severityName (text).
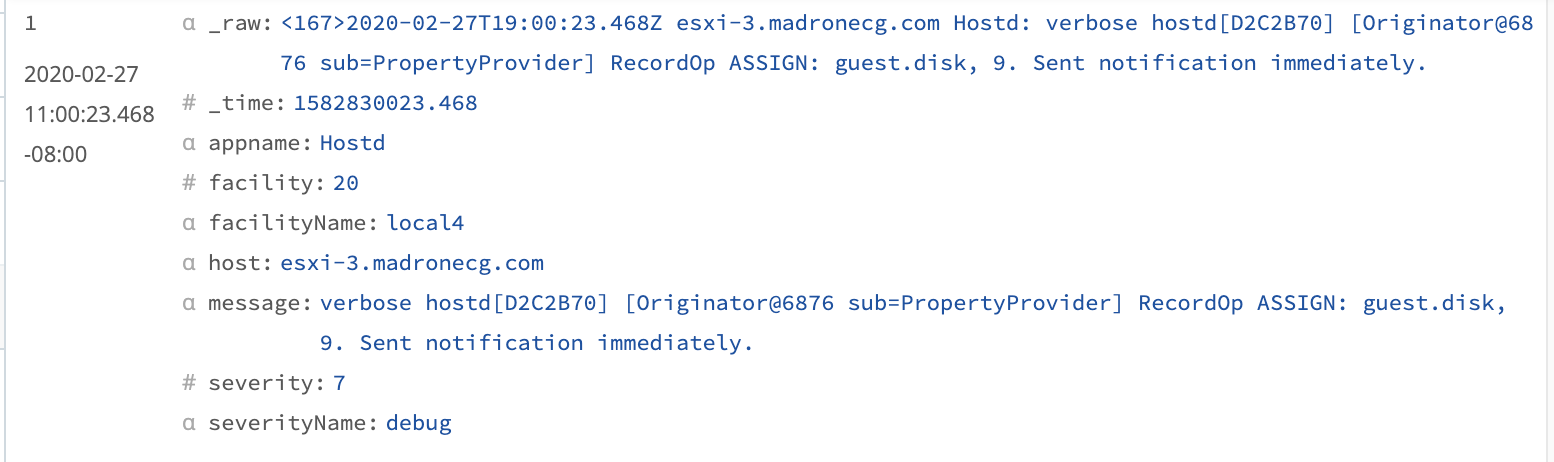
While this default parsing makes the output much more readable, we haven’t saved any volume - and we now have redundant pairs of fields (numeric versus text) that represent facility and severity.
Our next logical step is to streamline syslog events to something more like this:
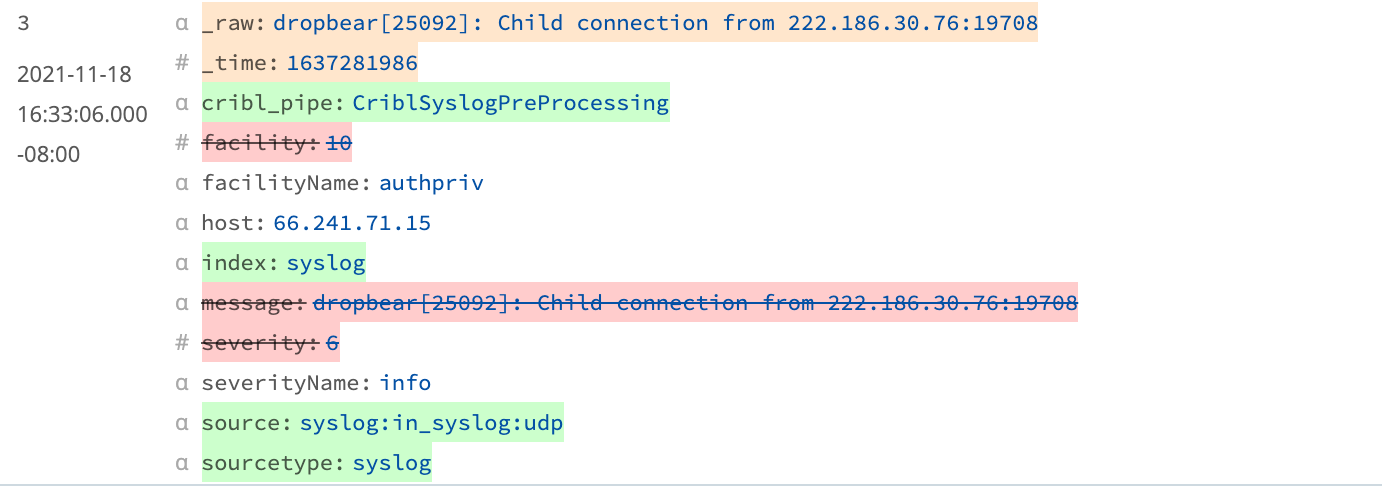
This accomplishes all of the following:
- Extracts the essentials.
- Removes the redundancies.
- Adds a new field to identify the Cribl Stream Pipeline (which we’re about to build).
- Adds metadata that the Destination needs.
- Shrinks the outbound
_rawpayload to just itsmessagecomponent.
Once we optimize syslog in this way, we can achieve still further efficiencies by dropping or downsampling frequent events, and by balancing high-volume syslog inputs across Cribl Stream worker processes.
Overall Architecture
Syslog data, especially when sent via UDP, is best collected as close to the source as possible. Ideally, you should capture syslog data at its origin. (This is true of syslog in general, not just syslog processed in Cribl Stream.)
Also, because syslog senders have no built-in load balancing, Cribl strongly recommends using a load balancer to distribute the load across multiple Worker Nodes.
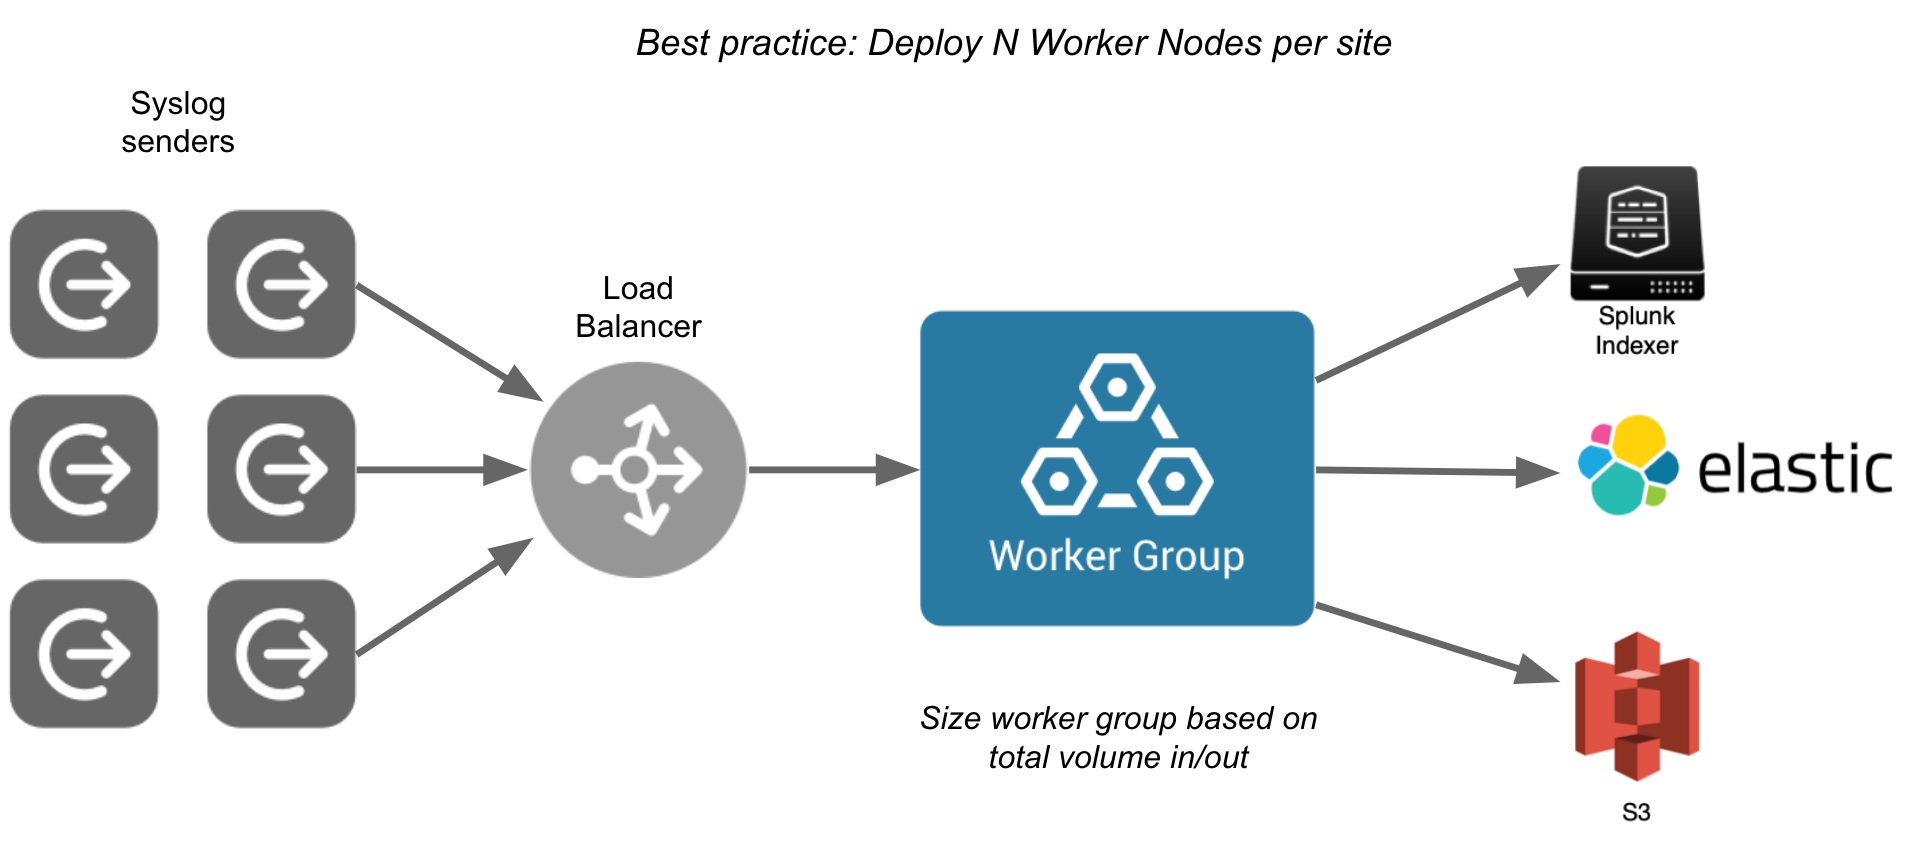
The load balancer shown above is dedicated only to communication between the syslog senders and the Stream Worker Nodes. Any load balancing between the Worker Group and its Stream Leader would be handled by a separate load balancer.
Load Balancers
The load balancer in front of the Leader UI can be an Application Load Balancer or a Network Load Balancer.
The load balancer between the Cribl Workers and the Cribl Leader listening on port 4200 must be a Network Load Balancer or other load balancer that supports health checks.
For load balancer configuration examples, see Configure Third-Party Load Balancers below.
High-Volume Syslog Senders
For general guidance on handling high-volume senders in Cribl Stream, see Scaling for High-Volume Syslog Senders for details on capacity planning, TCP load balancing, and other performance considerations.
UDP Versus TCP
For any given syslog device, you might need to choose between using UDP or TCP. Which is best depends on the characteristics of the sender. Here are some basic guidelines:
- For single, high-volume senders (over 300GB/day), use UDP if possible. For both the sender and Cribl Stream, UDP imposes lower overhead than TCP. The stateless nature of UDP allows each log event to be directed to a different worker thread than the last. This ensures maximum utilization of the Worker Nodes. See Sizing and Scaling for more details.
- For lower-volume senders, use TCP if the sender supports it.
- For all other use cases, use UDP.
Mitigate TCP Pinning
Cribl Stream’s TCP Load Balancing feature (available only in Distributed mode) prevents “TCP pinning” by distributing high-volume syslog traffic across all Worker Processes. When enabled, a dedicated load balancer process distributes incoming data via IPC sockets, improving performance. For details, see TCP Load Balancing.
Pipeline Planning
In Cribl Stream, we speak of pre-processing Pipelines, processing Pipelines (or just plain Pipelines), and post-processing Pipelines. Cribl recommends combining the first two in an arrangement that we’ve found to be optimal for syslog.
Pre-Processing Syslog Sources
Pre-processing Pipelines are useful for standardizing or normalizing incoming data from multiple Syslog Sources. Pre-processing can ensure consistency, streamline ingest-time processing for syslog events, and reduce the need to replicate the functionality and logic in each processing Pipeline that is associated with a Syslog Source.
However, pre-processing may not be necessary or desirable in every case. For example, if you have unique processing requirements for different subsets of data, it may be more effective to configure separate processing Pipelines according to your needs.
The Cribl Pack for Syslog Input provides a pre-processing Pipeline that modifies the data that Cribl Stream delivers. Before you deploy the pre-processing Pipeline, review the Pipeline’s comments as described in Importing the Pre-Processing Pipeline to understand the available functions and options and enable or disable them as desired.
Pipeline for Selected Syslog Data Subsets
Configure dedicated Pipelines (and Routes!) for each distinct subset of data that arrives via syslog senders. These subsets might include DHCP logs from the router, traffic logs from the firewall, operational logs from load balancers, and virtualization logs from on-prem virtualization hypervisors.
Certain kinds of subset-specific processing have become Cribl Stream best practices. These include:
- For ESXi or other hypervisor logs, use the Drop Function to drop
debug-level logs. - For firewall logs, enrich with DNS names, GeoIP fields, and lookups from a threat list.
- For load balancer logs, use the Suppress Function to reduce volume.
Unless you’re new to Cribl Stream, you’ve already created your own Pipelines, so we’re not going to review that here. (If you are new to Cribl Stream, consider running through the free Cribl Stream Overview sandbox course ASAP.)
Importing the Pre-Processing Pipeline (Optional)
Even before setting up a Cribl Stream Syslog Source, you have the option to install the Cribl Pack for Syslog Input (a.k.a. cribl-syslog-input Pack), which provides the required pre-processing Pipeline.
If this is your first time installing from the Cribl Dispensary, see the full directions with screenshots. Otherwise:
- Open the Cribl Pack Dispenary’s Cribl Pack for Syslog Input page.
- Under Releases at right, click the link for the latest release.
- In the resulting Assets section, right-click the
.crblfile to download it locally. - In Cribl Stream, select a Worker Group, then select Processing > Packs.
- Click the Add New button, and select Import from file.
- Select the Pack you downloaded, and follow the prompts from there. In most cases, when installing a Dispensary Pack, you should not enter an override value for New Pack ID.
- Review the Pack’s
READMEfile, available in the Pack’s Settings link and also online.
Let’s examine what this Syslog Input Pack provides, starting with the Routes page.
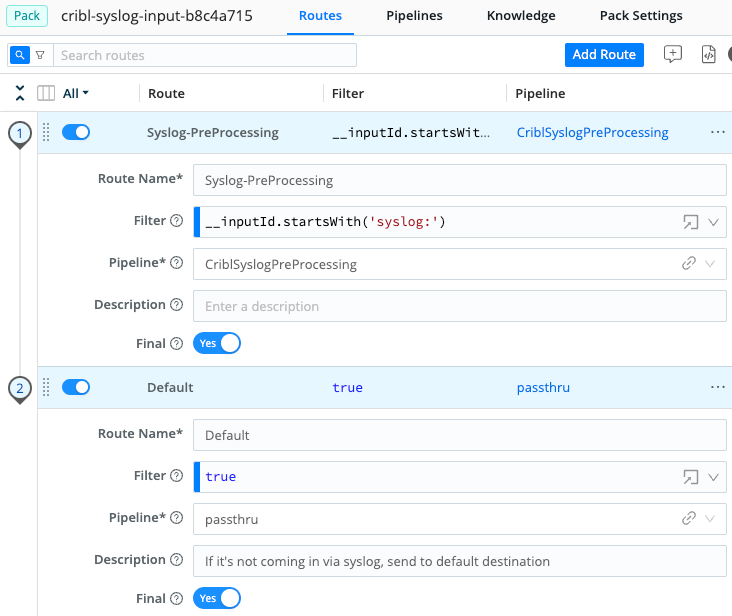
The first Route matches based on inputId. Anything arriving via a Cribl Stream Syslog Source will match this filter, as long as you’ve configured the Source to use the Pack, as shown below.
On first installation of the Pack, the Pipeline defaults to commonly used configurations. Cribl strongly recommends reviewing the Pipeline’s internal documentation to understand which features are enabled. This documentation consists of Comments for each section, and a Description for each Function to explain what’s happening in that step.
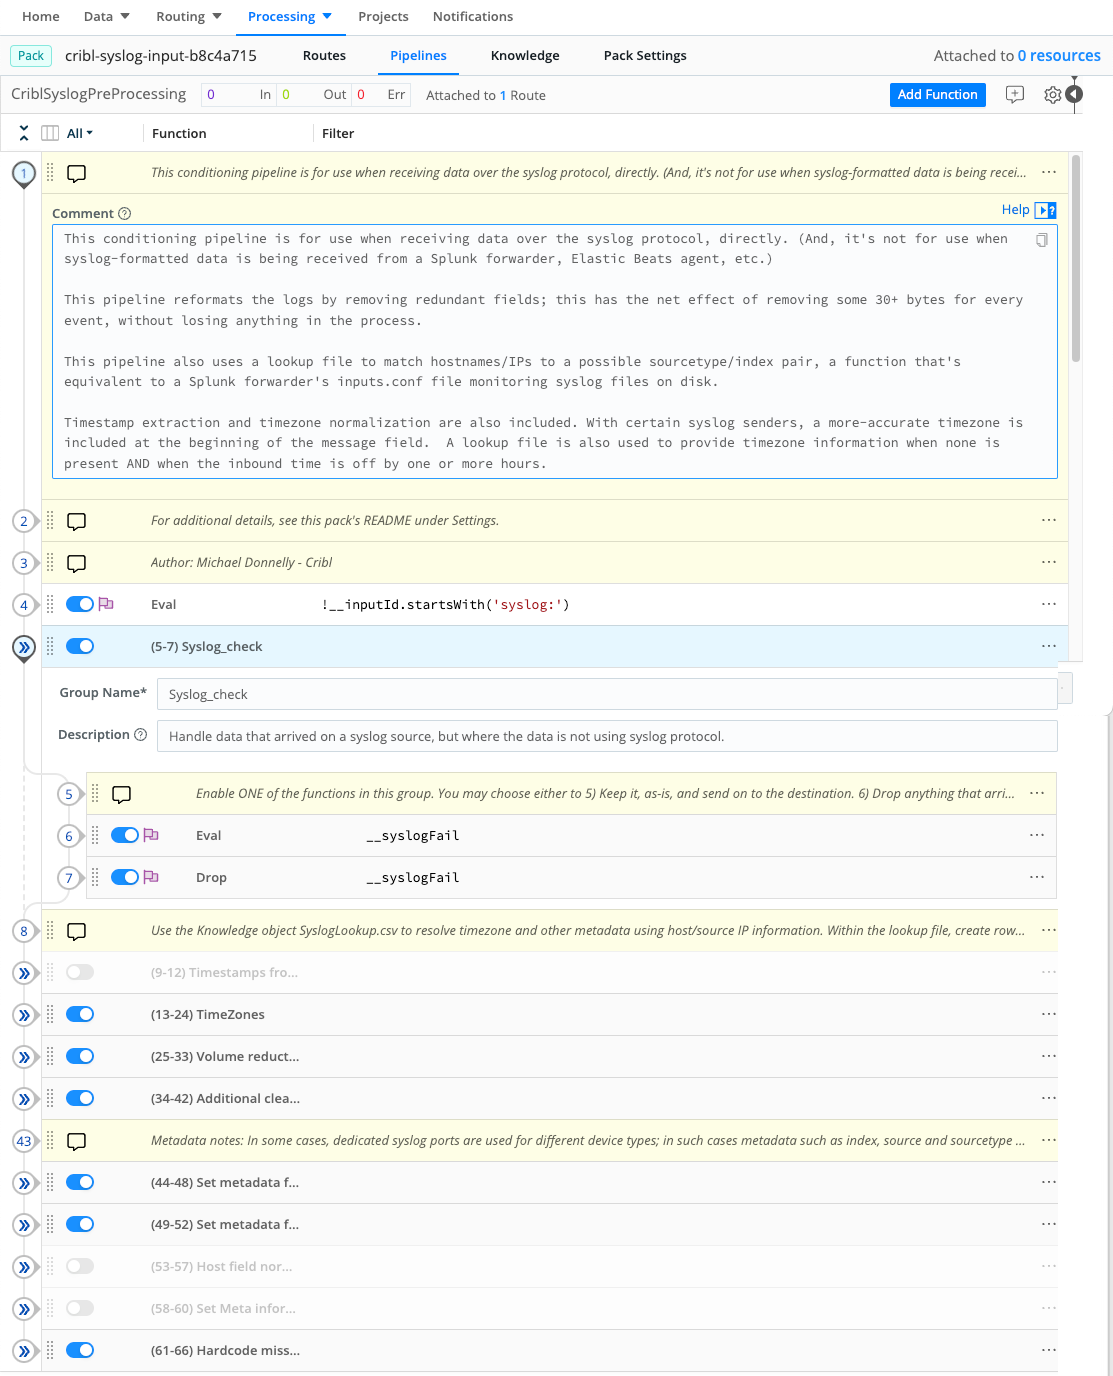
Examining this documentation should make it clear what changes (if any) are needed to suit your deployment environment. Go ahead and make those changes now.
The Lookup File
The Pack ships with a lookup file called SyslogLookup.csv, whose contents you should replace as necessary. To access the file, navigate to Processing > Packs, select the cribl-syslog-input Pack, and click Knowledge.
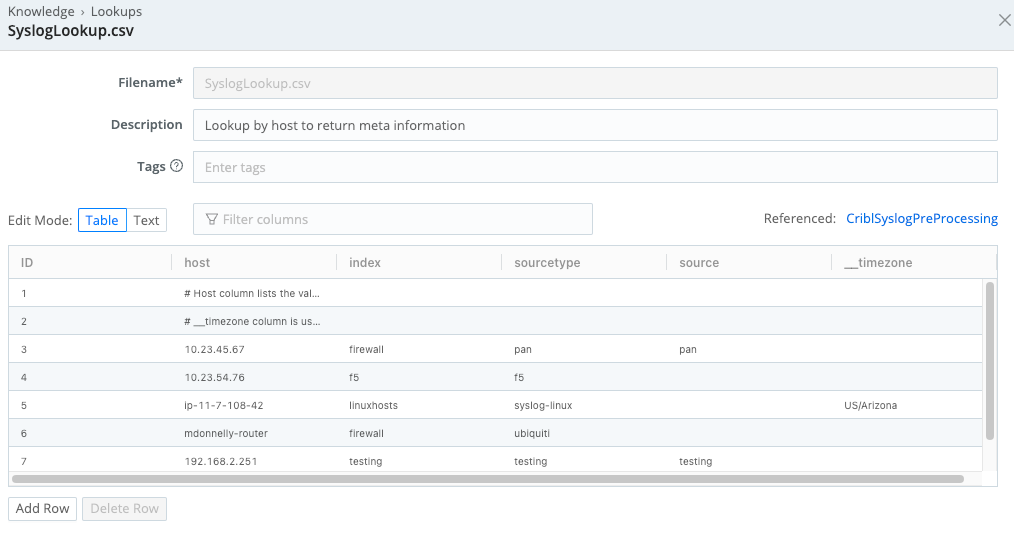
SyslogLookup.csv file, to be filled with customer dataCreating Syslog Sources
Now that you’ve imported the pre-processing Pipeline, the next step is to ensure that you have the Syslog Sources you need.
Configure the in_syslog Source
Cribl Stream ships with a Syslog Source named
in_syslog, which is preconfigured to listen for both UDP and TCP traffic on Port 9514. You can clone or directly modify this Source to further configure it, and then enable it.
Use the in_syslog Source for syslog senders that are hard-coded to send to port 514, as described above.
In the QuickConnect UI: Click Add Source. From the resulting drawer’s tiles, select [Push >] Syslog. Click Select Existing, then in_syslog.
Or, in the Data Routes UI: From the top nav of a Cribl Stream instance or Group, select Data > Sources. From the resulting page’s tiles or the Sources left nav, select [Push >] Syslog. In the Manage Sources page, click in_syslog.
Configure the fields and options as follows:
General Settings
- Enabled: Toggle to
Yes. - UDP Port and TCP Port: Assuming you’re following the guidelines in this tutorial, you’ll have a load balancer relaying incoming traffic from port 514 to port 9514. Therefore, leave the
in_syslogSource configured to listen on its default port, 9514, for both TCP and UDP.
TLS Settings (TCP Only)
- Enabling TLS is strongly recommended if the Source will be receiving data across the Internet.
Processing Settings
- Metadata: There is no need to add fields here, because for generic senders coming in on 9514, the Pack will set the meta-information via the
SyslogLookup.csvfile. What you need to do is edit the lookup file to add content appropriate to your deployment. - Pre-processing: From the Pipeline drop-down, select
PACK: cribl-syslog-input (Syslog Preprocessing).
Create a Source for Each Device Class
As explained above, you should now create a Syslog Source for each vendor/class of syslog sender. Create each Syslog Source as follows:
In the QuickConnect UI: Click Add Source. From the resulting drawer’s tiles, select [Push >] Syslog. Click Add New.
If you use QuickConnect, remember that each Source/Destination pair will be parallel and independent.
Or, in the Data Routes UI: From the top nav of a Cribl Stream instance or Group, select Data > Sources. From the resulting page’s tiles or the Sources left nav, select [Push >] Syslog. Click New Source to open a New Source modal.
Configure the fields and options as follows:
General Settings
- Input ID: This field specifies the name for the Source, which will appear in the
__inputIdfield as well as on Monitoring pages that show Source information. Common examples includein_syslog_cisco_switchfor Cisco switches,in_syslog_f5for F5 load balancers, and so on. - UDP Port and TCP Port: Enter the dedicated port you have chosen for the device class, and use UDP or TCP according to the recommendations above.
TLS Settings (TCP Only)
- Enabling TLS is strongly recommended if the Source will be receiving data across the Internet.
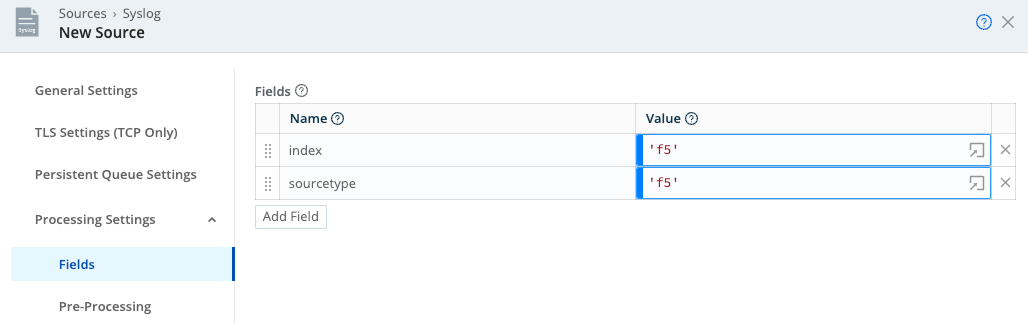
Processing Settings
- Metadata: Select Fields (Metadata) and add the fields appropriate for the intended Destination(s), such as
sourcetype,index,__timezone, and any other meta-information you want to tie to the sender’s hostname or IP address.
- Pre-processing: From the Pipeline drop-down, select
PACK: cribl-syslog-input (Syslog Preprocessing).
Adding Processing Pipelines
Congratulations! You’ve gotten a nice grounding in syslog processing, and you’ve seen methods with which you can:
- Properly architect the deployment environment, where syslog sender data travels through a load balancer, which then distributes it across a Cribl Stream Worker Group.
- Import a Pack from the Cribl Pack Dispensary.
- Create new Cribl Stream Syslog Sources which use the Cribl Pack for Syslog Input.
- Hard-code meta-information for specific ports, or use the lookup file to map meta-information for specific hosts.
Your logical next step: using Pipelines and Routes, transform syslog data in a way that makes sense for your particular syslog sender(s).
We’ll look at two use cases:
The point is to see how Cribl Stream offers different approaches for different scenarios. For configuring one dedicated Source to receive a given, single dataset, QuickConnect is ideal. But to accommodate a mix of data arriving on the same Source and port, and needing to be divided into subsets, and processed differently by different Pipelines - that is where we need Routes.
Use Case A: QuickConnect a Syslog Sender to a Source
Of the many possible examples, we’ll focus on reducing the volume of VMware ESXi syslog data by dropping events of debug severity.
Data reduction will be significant, because debug severity events can make up 80-90% of syslog data sent from ESXi servers. Not only that: Reducing the data volume reduces the CPU load and storage used to process the data, and searches will respond faster.
In a world where we’re searching for needles in a haystack, dropping 80% of the hay makes everything better.
To set this up:
- In your Worker Group, navigate to Pipelines, click Add Pipeline, then click Add Pipeline.
- Name the new Pipeline
DropNoisySyslogor something similar. - Click Comment and enter a good description of what you’re doing. (This is an important best practice!)
- Add a Drop Function with filter
severityName=='debug'. (You could also use sampling, or dynamic sampling if you wanted to be fancy about this.) - Click Save and we’re done.
Next, we need to direct VMware ESXi data to our Pipeline. We’ll do this using QuickConnect, which is the fastest way to configure a new Source, tie it to a Destination, and assign pre-processing and processing Pipelines to that Source. (We could also do this with Routes; that simply requires a few more configuration steps.)
In the QuickConnect UI:
- Click Add Source.
- From the resulting drawer’s tiles, select [Push >] Syslog.
- Click Add New.
- Configure the fields and options as follows:
- Name:
in_syslog_ESXi. - TCP:
1517. This is the TCP port on which ESXi servers send their logs. - Pre-Processing > Pack: Select
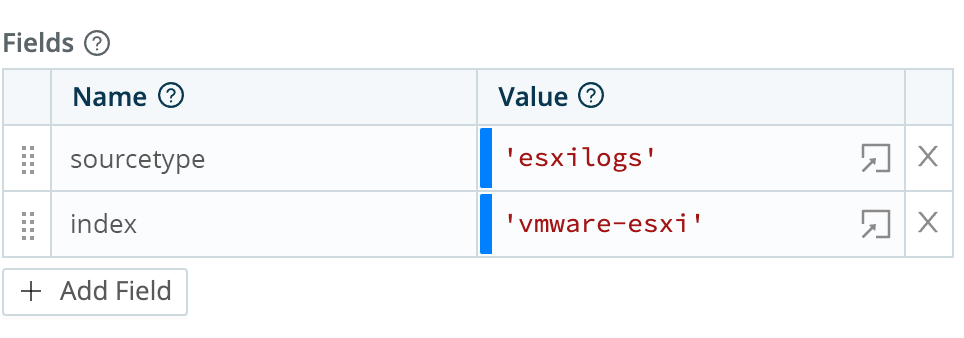
cribl-syslog-input. - Fields (metadata): Add a
sourcetypefield with valueesxilogs, and anindexfield with valuevmware-esxi.
- Name:
- Click Save.
- On the main QuickConnect page, drag a connector from
in_syslog_ESXito each Destination you want to receive these events. When prompted, select Pipeline, select yourDropNoisySyslog, and click Save. - Commit and deploy, and you’re all set!
Use Case B: Route Multiple Syslog Senders to a Source
Let’s imagine you have incoming data from a router. This data is tagged with sourcetype=myrouter, and it includes a mix of DHCP actions, login/authentication attempts, and firewall traffic logs.
Our goal is to send each of the three data subsets of data - DHCP, login, and firewall - to its own Pipeline.
We know that the Cribl Pack for Syslog Input has a Lookup Function that - for data arriving on the default port - should return meta-information such as sourcetype or index. We can combine this metadata with some matching of strings within the data, in Route filters that direct the right data to the right Pipeline.
Although in reality, the
myrouterfirewall does not exist, the example that follows shows the art of the possible. We’ll spell out the procedures as if the scenario were real. Perhaps one day you’ll use it as a template for an actual deployment.
Create a Pipeline for Each Data Subset
- Create three Pipelines, naming each one for a data subset:
myrouter-dhcp,myrouter-auth, andmyrouter-fw-traffic. - Leave the Pipelines empty for now; we’ll add Functions later on.
Create a Route for Each Data Subset
- Navigate to Routing > Data Routes.
- Click Add Route.
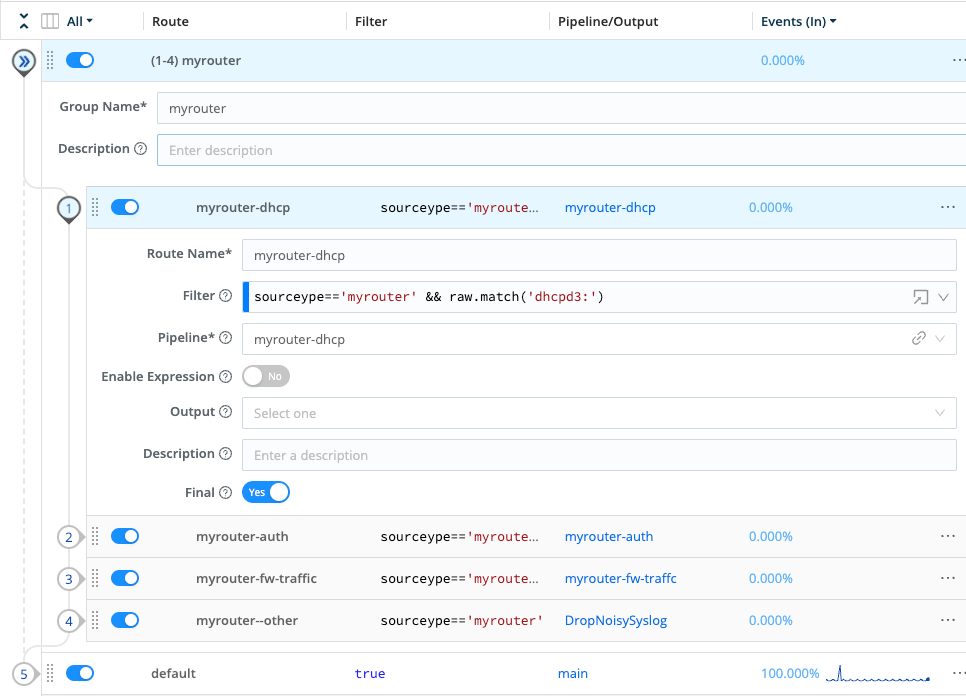
- Configure a Route as specified in the table below:
| Name | Filter | Pipeline |
|---|---|---|
myrouter-dhcp | sourcetype=='myrouter' && raw.match('dhcpd3:') | myrouter-dhcp |
myrouter-auth | sourcetype=='myrouter' && raw.match('login') | myrouter-auth |
myrouter-fw-traffic | sourcetype=='myrouter' && raw.match('TRAFFIC') | myrouter-fw-traffic |
myrouter-other | sourcetype=='myrouter' | DropNoisySyslog |
- Repeat the preceding steps until you have configured four new Routes - one for each of the three data subsets, plus a final Route to drop events that don’t match our Filters (i.e., noise).
All Routes should have the Final flag to Yes, and the output set to whatever Destination you think is appropriate for the given data subset.
- Click the
myrouter-dhcpRoute’s ••• (Options) menu, then select Group Actions > Create Group. - Name new Group
myrouter. - Drag the Routes you created above into the new Group. (Be sure that
myrouter-otheris listed last.) - Drag the new Group to whichever vertical position makes the most sense for your deployment.
Once you’ve completed all the above steps, then after collapsing your new Routes, you should see something like this:
Next, edit each of the myrouter-<data-subset> pipelines:
- Use an Eval Function to modify the
sourcetype(and perhaps other metadata.) - Use appropriate Functions to accomplish the enrichment, suppression, volume reduction, and/or other transformations that the data needs.
Takeaways from This Routing / Pipeline Use Case
- Routing provides the flexibility needed when dealing with multiple datasets from a single sender, or when a single Source receives multiple datasets.
- Ensure that you have a dedicated Pipeline (and Route) for each discrete dataset that you want to manipulate in some way (e.g.,
fw-traffic). - Ensure that you have a final Route that matches the general data from the overall sourcetype.
- Use the Routing page’s Groups option to create logical containers for sets of Routes that belong together.
Configure Third-Party Load Balancers
This section provides configuration examples and reference links for setting up third-party load balancers with syslog.
F5 BIG-IP Example
ltm virtual udpsyslog_514_vs {
destination 10.10.10.10:514
ip-protocol udp
mask 255.255.255.255
pool udpsyslog_514_pool
profiles {
    udp { }
}
Vlans-disabled
}

ltm pool udpsyslog_514_pool {
members {
    10.10.20.10:514 {
        address 10.10.20.10
        session monitor-enabled
        state up
    }
    10.10.20.20:514 {
        address 10.10.20.20
        session monitor-enabled
        state up
    }
}
monitor tcp
service-down-action reset
}Citrix Netscaler Example
Reference: Load Balancing syslog Servers.
add service service1 192.0.2.10 SYSLOGUDP 514
add service service2 192.0.2.11 SYSLOGUDP 514
add service service3 192.0.2.11 SYSLOGUDP 514
add service service4 192.0.2.10 SYSLOGTCP 514
add service service5 192.0.2.11 SYSLOGTCP 514
add service service6 192.0.2.11 SYSLOGTCP 514
add lb vserver lbvserver1 SYSLOGUDP -lbMethod AUDITLOGHASH
add lb vserver lbvserver1 SYSLOGTCP -lbMethod AUDITLOGHASH
bind lb vserver lbvserver1 service1
bind lb vserver lbvserver1 service2
bind lb vserver lbvserver1 service3
bind lb vserver lbvserver1 service4
bind lb vserver lbvserver1 service5
bind lb vserver lbvserver1 service6
add syslogaction sysaction1 -lbVserverName lbvserver1 -logLevel All
add syslogpolicy syspol1 ns_true sysaction1
bind system global syspol1AWS NLB Guide
Reference: UDP Load Balancing for Network Load Balancer.
NGINX Plus Guide
Reference: TCP and UDP Load Balancing.
HAProxy (Including TCP Break-Apart)
Reference: haproxy speaks syslog.
This example resides at /usr/local/etc/haproxy/haproxy.cfg:
ring worker1
format rfc5424
maxlen 1500
size 32764
timeout connect 5s
timeout server 10s
server worker1 worker1.example.com:1514
ring worker2
format rfc5424
maxlen 1500
size 32764
timeout connect 5s
timeout server 10s
server worker2 worker2.example.com:1514

# Add as many ring buffers as needed here

log-forward syslog-lb
# UDP Listener (IPv4/IPv6)
dgram-bind :::1514

# TCP Listener (IPv4/IPv6)
bind :::1514

# Load-balance outgoing messages on 2 TCP outputs
log ring@worker1 sample 1:2 local0
log ring@worker2 sample 2:2 local0

maxconn 65536
timeout client 10s